Article Text

Statistics from Altmetric.com
SUMMARY
The diagnosis of fibrosis within liver disease is important for prognosis, stratification for treatment, and monitoring of treatment efficacy. The rising incidence and prevalence of non-alcoholic fatty liver disease (NAFLD) has driven the search for accurate non-invasive tools of liver fibrosis within this condition. With the aid of a systematic review, we explore how the field has evolved from the discovery of simple blood parameters to panel markers of liver fibrosis. We will discuss the biological plausibility, limitations, potential uses, and emerging diagnostic techniques of non-invasive markers in this rapidly expanding field.
INTRODUCTION
NAFLD is emerging as one of the commonest causes of abnormal liver function tests, and in the Western world the estimated prevalence is reported to be as high as 30%.1 The prevalence of NAFLD is expected to rise in developed countries given the epidemic of its major underlying determinant obesity, in addition to the increasing ascertainment of this condition. Histologically, NAFLD is a spectrum of disease from simple fatty deposition (steatosis), to necroinflammation in zone 3 in association with ballooning degeneration (non-alcoholic steatohepatitis (NASH)), to periportal and/or perisinusoidal fibrosis, to cirrhosis. The natural history is varied; at the early stages of disease the majority remain stable at the same histological stage and grade, a proportion however will progress to cirrhosis (there is variation in the rate of progression), and finally some will have regression of disease.
Liver biopsy is seen as the “gold standard”. Its value in revealing the relationship between inflammation and fibrosis and the presence and relative contribution to other aetiologies should not be underestimated. However, significant limitations to biopsy exist. In large studies, pain is a significant issue in 20% of cases and severe complications have been reported to occur in 0.57%.2 The biopsy may represent only 1/50 000th of the liver, and sampling error has been shown to be an issue in a variety of liver diseases, including NAFLD.3 All staging systems in widespread use share common failings that have been discussed at length.4,5 Principal of these is the imposition of categorical variables in an ordinal scale, using pathological scoring systems, on a process that is a continuous variable. In addition, regular quantum progression of stages of fibrosis imposes linearity on the staging of fibrosis that is likely to be artificial. Hence stage 2 fibrosis (F2) is neither twice the severity of stage 1 (F1) nor half the severity of stage 4 (F4). Greater degrees of standardisation and a continuous measure of fibrosis can be obtained by using automated image analysis but these systems are costly, laborious, and they have not been fully validated. Furthermore, they remain dependent on liver biopsy.
Non-invasive markers of liver fibrosis have been most extensively studied in the context of hepatitis C. There has been considerable interest in extending this work into the field of NAFLD because of the increasing prevalence of disease. The presumptive diagnosis of NAFLD is rapidly becoming the commonest cause for referral to hepatology outpatient clinics. Currently, identification of severe disease is dependent on liver biopsy. As it is not practical to biopsy every patient with suspected NAFLD, patients are often stratified and selected for biopsy on the basis of transaminases and clinical and anthropometric parameters. This may result in underestimation of significant disease. Identification of individuals with fibrosis in NAFLD may be important for a number of reasons. Firstly, recent long term studies suggest that development of fibrosis within NAFLD has an important prognostic significance.6,7 Secondly, once fibrosis is identified it may increase the imperative for patients to implement major lifestyle changes and clinicians to monitor the response to intervention. Finally, pharmacological treatments are currently being evaluated in NAFLD, largely in the context of randomised controlled clinical trials, but if successful agents are found it will be important to have identified a target population that can be potentially treated. We have therefore performed a systematic review to assess the performance of non-invasive markers to assess liver fibrosis in NAFLD.
METHODS
A systematic literature search was performed to ascertain studies measuring fibrosis by non-invasive markers in NAFLD. Sources searched included:
Electronic databases 1996–October 2005: Cochrane Library 2005, MEDLINE, and EMBASE using a search strategy (available from authors) derived from the literature.8,9 Search terms were added following initial searches as appropriate.
Reference lists from relevant articles.
Inclusion criteria
Studies were included if:
they were systematic reviews, meta-analyses, or primary studies of one or more non-invasive markers;
they used liver biopsy as a reference standard;
they included >30 participants (as smaller studies will be underpowered to produce precise estimates of test performance);
alcohol consumption of subjects was stated and a reasonable attempt was made to exclude patients with other causes of liver disease (for example, alcohol and viral infections).
Studies identified by the search strategy were assessed for inclusion by two reviewers (NG and JP).
Exclusion criteria
Studies were excluded if:
data on fibrosis stage(s) were not extractable;
data were presented only in abstract form;
publications were not in English.
Data extraction strategy
Data extraction was undertaken by one reviewer (NG) and checked by a second reviewer (JP), with any disagreements being resolved through discussion. A third reviewer was consulted (PR) to resolve persisting issues. Information collected included patient demographics, test assay details, background prevalence of fibrosis severity, risk factors, histological parameters, statistical methods used, and test performance characteristics. Where data was available, 2×2 contingency tables were constructed to determine diagnostic accuracy statistics (for example, sensitivity, specificity, and predictive values) or odds ratios presented as a measure of association.
Quality assessment strategy
The quality of the included studies was assessed using a modified quality assessment of diagnostic accuracy studies (QUADAS) tool (see appendix 1).10
Study characteristics
The electronic search yielded 1781 abstracts which were read in full. Forty seven full papers were retrieved of which 18 were excluded, leaving 29 studies in separate populations to be included in the review. The majority of studies satisfied all of the criteria of the QUADAS tool (see appendices 1 and 2) but there was heterogeneity in the methods used for patient selection, histological scoring, and data analysis.
The demographics of patients included in the final analysis are shown in table 1⇓. The prevalence of severe fibrosis (grade 3–4) ranged from 9% to 43% (median 22.5%). Body mass index (BMI) in the studies ranged from 26 to 60 kg/m2 (median 31); five studies recruited from patients undergoing bariatric surgery. The cut off for alcohol consumption varied among studies but the majority excluded patients consuming >200 g/week (approximately 25 units/week). Only seven studies included details of length of biopsy specimen or number of portal tracts.
Three studies combined non-invasive markers to produce a diagnostic algorithm in association with specificities, sensitivities, predictive values, and/or area under the receiving operator curve statistics. The remaining studies investigated the association of individual variables with severe fibrosis versus moderate fibrosis (17 studies), moderate fibrosis versus mild fibrosis (four studies), any fibrosis versus no fibrosis (seven studies), and no fibrosis versus moderate fibrosis (one study).
VARIABLES ASSOCIATED WITH FIBROSIS
Variables associated with fibrosis can be subdivided into five groups (table 2⇓):
sociodemographic and anthropometric,
simple liver biochemistry and haematology,
features of metabolic syndrome and glucose sensitivity,
fibrosis markers, and
miscellaneous markers.
BIOLOGICAL PLAUSIBILITY OF NON-INVASIVE MARKERS
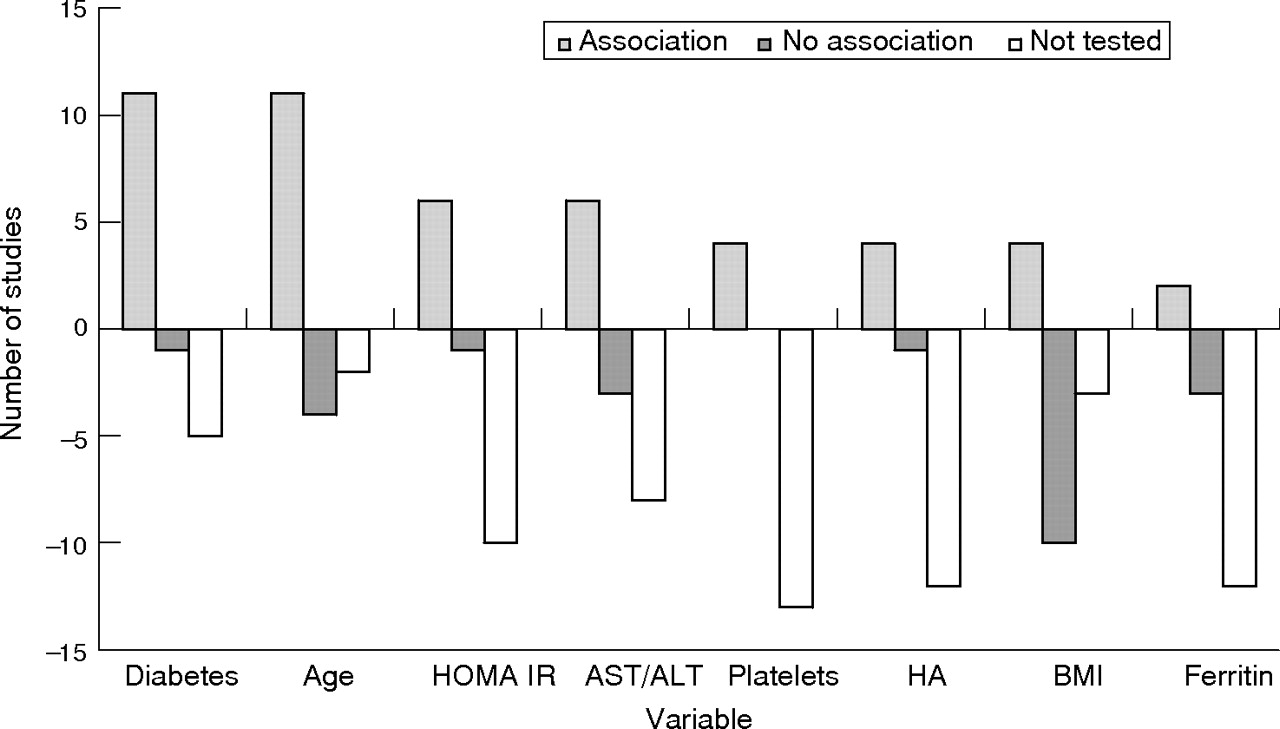
The variables most commonly associated with fibrosis are: presence of diabetes, increasing age, increased homeostatic insulin resistance (HOMA-IR), increased aspartate aminotransferase/alanine aminotransferase (AST/ALT) ratio, decreased platelets, hyaluronic acid, and BMI.
Each of these markers has biological plausibility. In NAFLD, age at biopsy is a reflection of probable duration of exposure to risk (for example, to obesity and/or insulin resistance) and there is emerging evidence that the fibrotic response itself may be more exaggerated with increasing age; a similar phenomenon is seen in the context of hepatitis C.40 The variables diabetes, HOMA-IR, quantitiative insulin sensitivity check index (QUICKI), and oral glucose sensitivity index (OGIS) all reflect insulin resistance and there is growing evidence that this has a major role in the development and progression of fibrosis within NAFLD. The mechanisms by which insulin resistance trigger fibrosis may be through free fatty acid mobilisation, generation of reactive oxygen species, and production of fibrogenic growth factors.41,42 The high AST/ALT ratio has been shown to be elevated in a variety of diseases causing fibrosis and cirrhosis and this may be related to reduced sinusoidal clearance of AST relative to ALT. Reduction in platelet count may occur as a result of portal hypertension but also some chronic liver diseases may reduce the hormone thrombopoietin which stimulates platelet production. In NAFLD, as in other chronic liver diseases, platelet count alone appears to be a better indicator of severe fibrosis/cirrhosis rather than earlier stages of fibrosis. Hyaluronic acid may increase in fibrosis due to a mixture of increased collagen turnover and reduced hepatic clearance and this has been shown to increase in other aetiologies of liver fibrosis, such as alcohol, hepatitis B, and hepatitis C.43–,45 Finally, BMI is a surrogate of exposure to obesity although most studies have investigated BMI at the index biopsy rather than BMI over a period of time prior to biopsy. There is growing acceptance that the distribution of obesity (that is, central or visceral obesity versus peripheral obesity) is an important determinant of disease progression, and this is evidenced by some of the studies above finding a positive association of waist to hip ratio with liver fibrosis.
PANEL MARKERS FOR THE DETECTION OF NAFLD
Very few studies were designed as traditional diagnostic studies, making comparisons of diagnostic tests with reference standards. The majority have concentrated on finding statistical associations of variables with fibrosis to try and elucidate the mechanisms of NAFLD rather than producing diagnostic algorithms. This is in contrast with hepatitis C; we have recently published data on 10 distinct panel marker tests assessing fibrosis in this condition.46 Panel marker tests combine variables found to be significant first at univariate analysis into a multivariate analysis predictive algorithm. As identification of variables precedes formulation of an algorithm, this suggests that non-invasive markers are generally at an earlier stage of development for NAFLD. The three studies producing a panel marker diagnostic test with area under the curve (AUC) values and cut offs with relevant specificities and sensitivities included the BAAT score, HA score, and ELF score.12,23,29 Only one of these studies included a validation cohort and the number of patients in all three studies was relatively small. Two studies compared F3/4 versus F0/1/2 and the other compared F2/3/4 versus F0/1. The AUC ranged form 0.84 to 0.92 (table 3⇓).
LIMITATIONS OF NON-INVASIVE VARIABLES IN NAFLD
There is a clear balance between obtaining a diverse derivation population that mirrors clinical practice and in whom the diagnostic uncertainty exists (that is, to limit so-called spectrum bias) versus the feasibility of choosing a study population in which it is ethically permissible to obtain liver biopsies. The studies cited above do vary in recruitment methods and patient characteristics but in some there is a degree of selection bias partly due to the requirement of a liver biopsy as the reference test. For example, five of 27 studies included patients undergoing bariatric surgery. Patients in theses studies had a very high BMI, resulting in selection bias of these cohorts. Many studies only included patients with abnormal liver function tests (LFTs), reflecting clinical referral pathways to hepatology. Overall the effect may be to find associations at the severe end of the spectrum of disease and/or within a restricted range of markers so the associations and panels may not be generalisable to types of patients not included (for example, those with normal LFTs).
Studies varied in the markers they studied. When associations were found, studies present univariate data or multivariate data but in the latter there is variation in which factors are included in the final model. Using the variable diabetes as an example to distinguish severe fibrosis from moderate or no fibrosis (that is, F3/4 v F0/1/2), 10 studies suggested an association of diabetes with severe fibrosis (six by univariate analysis and four by multivariate univariate). However, only half of the studies published odds ratios for these associations (fig 1⇓).
Panel markers, utilising a combination of variables found at multivariate analysis, are subject to the same bias of the derivation population as single markers. These predictive equations are derived to best fit the original training sample. To demonstrate that these tests are generalisable and robust they need to be validated in different populations and preferably by independent external investigators. The panels of markers do have quite high AUCs. However, this can be misleading because as in hepatitis C virus they have clinically acceptable predictive values at extreme thresholds but these are only applicable to a minority of the population tested. Finally, any increased accuracy of panel marker tests has to be balanced against additional cost and practicality compared with simple routine parameters.
WHAT STAGE OF DISEASE SHOULD WE BE DISTINGUISHING?
One of the reasons why the field of non-invasive markers for NAFLD may lag behind hepatitis C is because of the uncertainty of which end point to measure. The current field is divided into studies attempting to distinguish between stages of fibrosis, fibrosis from NASH, and NASH from simple steatosis. Recently, investigators have published a panel test of non-invasive serum markers to diagnose steatosis alone within NAFLD;47 the arguments of whether this is superior to ultrasound aside it highlights the uncertainty and open debate of which stage or stages of NAFLD require diagnosis. Although recent studies suggest fibrosis has the greatest implication on prognosis, detection of the earliest stages of NASH would allow early initiation of therapeutic intervention prior to the development of fibrosis.
Classification of fibrosis by histology has utilised a variety of scoring systems (see table 1⇓). Although some have been designed specifically for NAFLD, others such as Metavir and Sheuer, were formulated for the scoring of fibrosis in the context of chronic viral hepatitis. Recently, a scoring system, designed and validated by the non-alcoholic steatohepatitis clinical research network, called the NAFLD scoring system, has been published utilising components of steatosis, lobular inflammation, and ballooning.48 Fibrosis is scored separately and stage 1 fibrosis is subdivided into 1A, 1B, and 1C dependent on the distribution of fibrosis around the portal tract, sinusoids, or a combination of these. If this scoring systems gains widespread acceptance it will allow greater comparison of both therapeutic and diagnostic trials in NAFLD.
An interesting observation is that within fibrosis, many of the studies in NAFLD have focused on separating F0/1/2 from F3/4. The variables most significant in distinguishing severe fibrosis from less severe disease are shown in fig 2⇓. The emergence of new therapeutic treatment for NAFLD and antifibrotic medication will dictate which precise cuts in fibrosis will need distinguishing. It is conceivable that different algorithms will exist depending on the nature of the treatment contemplated or if the test is simply performed for prognosis.
CURRENT USE OF NON-INVASIVE MARKERS IN NAFLD
The ideal test for fibrosis in NAFLD would be easy to perform, inexpensive, reliable (within patients and between and within laboratories) and would provide an accurate assessment of the degree of liver fibrosis throughout the range of matrix deposition from mild scarring, through compensated cirrhosis, and then beyond, to provide a clear picture of worsening degrees of decompensated cirrhosis. The test would be highly predictive of long term outcomes such as hepatic decompensation, portal hypertension, liver failure, liver cancer, the necessity for transplantation, and death from liver disease.
The current non-invasive markers, especially the panels, potentially allow clinicians to select patients with severe fibrosis or exclude severe fibrosis, with the caveat that only a minority of the population tested will have a test result with a high predictive value. In clinical practice, this may allow a reduction in the number of biopsies performed. Moreover, it is a useful alternative in patients having an absolute contraindication or refusing percutaneous liver biopsy.
In the context of NAFLD, there is evidence that lifestyle changes can result in improvement in underlying fibrogenesis and in some cases regression of cirrhosis.49,50 Monitoring the response to this lifestyle intervention is vital to reinforce motivation for the patients and alert the clinician when more aggressive intervention (for example, entering patients into pharmacological trials or bariatric surgery in cases of severe obesity) is required. Currently, clinicians may only be able to assess fibrosis by repeating a biopsy every two to three years because of its invasive nature and in the interim period rely on serum aminotransferases. Measuring serial serum markers at more frequent intervals may allow the detection of severe fibrosis at an earlier stage or act as reassurance for those patients consistently showing values corresponding to no or minimal fibrosis.
EMERGING TECHNOLOGIES AND FUTURE DIRECTION
There has been considerable interest in improving radiological imaging for diagnosing the severity of liver disease. Although routine ultrasound has acceptable diagnostic accuracy in detecting steatosis, it has been relatively disappointing in distinguishing NASH and fibrosis within NAFLD. A novel technique called elastography has been explored in a variety of liver diseases, including NAFLD. A vibration is produced by the probe which induces an elastic shear wave. Propagation of this wave through the liver, which is measured by an ultrasonic transducer, is correlated to liver stiffness. A study of 711 patients, 26 patients with NASH, demonstrated an AUC of 0.8 for significant fibrosis and 0.96 for cirrhosis.51 The depth of measurement was 25–65 mm and therefore there is a concern about data acquisition in patients with severe visceral obesity. In chronic hepatitis C, a recent study measured hepatic vein transit time (HVTT) of levovist from the antecubital fossa to the hepatic vein in 85 patients with mild, moderate, and severe disease.52 HVTT reduced with increasing severity of disease, the underlying hypothesis being that functional haemodynamic changes are correlated to disruption of the hepatic architecture. In cirrhosis, intrahepatic shunting will have an obvious effect on the HVTT but there is the possibility that more subtle changes in sinusoidal haemodynamics occurring in early fibrosis may also be detected by this technique.
The platform technologies of genomics, proteomics, and metabonomics may reveal new biomarkers in addition to giving insights into the mechanisms of liver fibrosis. Younossi et al performed a genomic and proteomic analysis on 91 patients with NAFLD.53 They looked at differences between groups of controls, steatosis alone, steatosis and non-specific inflammation, and NASH rather than fibrosis per se. Nevertheless, on comparing controls to the three subgroups of NAFLD they found 22 genes with more than a twofold difference in expression and 12 significantly different protein peaks.
It is likely that combinations of simple blood parameters, novel biomarkers, and functional imaging will increase diagnostic accuracy and allow greater separation of stages of fibrosis. The limitations of liver biopsy, as discussed earlier, may create a glass ceiling for potential non-invasive tests. As liver fibrosis itself is a surrogate for clinical outcomes, using hard clinical end points as the reference standard may be one potential solution. The cost and length of these trials will be a limiting factor.
CONCLUSION
Simple clinical and biochemical parameters appear to be associated with fibrosis in NAFLD. Studies incorporating these variables into diagnostic tests have started to emerge. It is likely that accuracy will continue to improve with refinement of these diagnostic algorithms by addition of novel biomarkers and combining different modalities such as serum biomarkers and radiological imaging. The majority of studies concentrate on the distinction of severe fibrosis but separation of milder forms of fibrosis and NASH from simple steatosis will be required to support emerging therapeutic trials.
APPENDICES
APPENDIX 1
Table A1 shows the QUADAS tool to assess quality.
Appendix 2
Table A2 shows the results of the QUADAS tool.
Appendix 2
Table A3 shows the association of non-invasive markers with fibrosis stage in NAFLD.
Quality assessment of diagnostic accuracy studies (QUADAS) tool to assess quality
Results of quality assessment of diagnostic accuracy studies (QUADAS) tool
Association of non-invasive markers with fibrosis stage in non-alcoholic fatty liver disease
Characteristics of studies evaluating non-invasive markers of fibrosis in non-alcoholic fatty liver disease (NAFLD)
Variables associated with fibrosis
Panel marker tests measuring fibrosis in non-alcoholic fatty liver disease

Forest plot of strength of association of diabetes with severe fibrosis. UVA, univariate analysis; MVA, multivariate analysis; OR, odds ratio; UL, upper limit.

Variables associated with severe fibrosis. HOMA-IR, homeostatic insulin resistance; AST, aspartate aminotransferase; ALT, alanine aminotransferase; HA, hyaluronic acid; BMI, body mass index.
REFERENCES
Supplementary materials
Competing interests: ING, grant supported by Pfizer. JP, MRC clinical research training fellow and educational grant from Bayer. WMR, consultant for Gilead, Bayer and Pfizer, member of International Advisory Board for Roche, Chief Scientific officer for iQur Limited.