Article Text

Abstract
Objective The aggressive basal-like molecular subtype of pancreatic ductal adenocarcinoma (PDAC) harbours a ΔNp63 (p40) gene expression signature reminiscent of a basal cell type. Distinct from other epithelia with basal tumours, ΔNp63+ basal cells reportedly do not exist in the normal pancreas.
Design We evaluated ΔNp63 expression in human pancreas, chronic pancreatitis (CP) and PDAC. We further studied in depth the non-cancerous tissue and developed a three-dimensional (3D) imaging protocol (FLIP-IT, Fluorescence Light sheet microscopic Imaging of Paraffin-embedded or Intact Tissue) to study formalin-fixed paraffin-embedded samples at single cell resolution. Pertinent mouse models and HPDE cells were analysed.
Results In normal human pancreas, rare ΔNp63+ cells exist in ducts while their prevalence increases in CP and in a subset of PDAC. In non-cancer tissue, ΔNp63+ cells are atypical KRT19+ duct cells that overall lack SOX9 expression while they do express canonical basal markers and pertain to a niche of cells expressing gastrointestinal stem cell markers. 3D views show that the basal cells anchor on the basal membrane of normal medium to large ducts while in CP they exist in multilayer dome-like structures. In mice, ΔNp63 is not found in adult pancreas nor in selected models of CP or PDAC, but it is induced in organoids from larger Sox9low ducts. In HPDE, ΔNp63 supports a basal cell phenotype at the expense of a classical duct cell differentiation programme.
Conclusion In larger human pancreatic ducts, basal cells exist. ΔNp63 suppresses duct cell identity. These cells may play an important role in pancreatic disease, including PDAC ontogeny, but are not present in mouse models.
- pancreas
- stem cells
- cancer
- development genes
- imaging
Data availability statement
Data are available upon reasonable request. All data relevant to the study are included in the article or uploaded as supplementary information. All relevant data can be requested by contacting the corresponding author.
This is an open access article distributed in accordance with the Creative Commons Attribution Non Commercial (CC BY-NC 4.0) license, which permits others to distribute, remix, adapt, build upon this work non-commercially, and license their derivative works on different terms, provided the original work is properly cited, appropriate credit is given, any changes made indicated, and the use is non-commercial. See: http://creativecommons.org/licenses/by-nc/4.0/.
Statistics from Altmetric.com
Disclaimer: this video summarises a scientific article published by BMJ Publishing Group Limited (BMJ). The content of this video has not been peer-reviewed and does not constitute medical advice. Any opinions expressed are solely those of the contributors. Viewers should be aware that professionals in the field may have different opinions. BMJ does not endorse any opinions expressed or recommendations discussed. Viewers should not use the content of the video as the basis for any medical treatment. BMJ disclaims all liability and responsibility arising from any reliance placed on the content.
What is already known on this subject?
ΔNp63 has a central role in determining the basal-like subtype of pancreatic ductal adenocarcinoma.
Different from other tissues with basal cancers, the normal pancreas reportedly does not contain (ΔNp63-expressing) basal cells.
Current protocols for marker-based identification and three-dimensional (3D) imaging of individual (rare) cells in human archival pancreatic samples face severe limitations.
What are the new findings?
We report a rare and atypical pancreatic duct cell that expresses ΔNp63, other basal cell markers and some g.i. stem cell markers.
These ΔNp63+ cells are more prevalent in chronic pancreatitis.
Except after culturing medium to large ducts as organoids, we fail to detect ΔNp63+ cells in murine experimental pancreatic models.
ΔNp63 favours basal cell differentiation while limiting classical duct cell differentiation markers.
We provide an easy to implement protocol for 3D clearing and high-resolution imaging of sizeable samples of (fresh or formalin-fixed and paraffin-embedded) human pancreas or of an entire mouse pancreas.
How might it impact on clinical practice in the foreseeable future?
Extrapolating from knowledge in other organs, basal cells in the pancreas may have a stem cell/progenitor role, including in diseases such as basal-like or squamous pancreatic cancer.
Application of the improved three-dimensional imaging protocol to archival clinical specimens will allow unprecedented insights in pancreatic histopathology.
For above-mentioned diseases, we caution for findings in experimental mouse models that may not (fully) recapitulate the aetiopathogenesis.
Introduction
Pancreatic ductal adenocarcinoma (PDAC) is a cancer of high unmet need. In several PDAC cohorts, a classical and a basal-like molecular subtype have been identified, the latter having the worst prognosis.1 The basal-like subtype is characterised2 and driven3 by the basal cell transcription factor ΔNp63, an isoform of tumour protein P63 (TP63).3 4 Notta et al, refined these insights by showing that not the basal-like A subtype, having the highest basal cell markers including TP63, but a distinct basal-like B subtype showed the worst prognosis.5 This illustrates our lack of knowledge on TP63 and other basal cell markers in the pancreas.1
ΔNp63+ basal cells can be the cells of origin of cancer in other tissues6 7 but for the normal pancreas it is accepted that expression of TP63 is absent.3 8–10 This is in contrast to the bronchus, prostate, salivary gland, skin, breast and placenta,9 where ΔNp63 is expressed by a specific cell population in normal ducts, located on the basement membrane and distinguished by specific markers among which cytokeratin (KRT) 5 and 14.11 Furthermore, ΔNp63 is a well-studied key player in the development of stratified epithelium and an inhibitor of cell differentiation, crucial for stem cell renewal.12 13 Accordingly, basal cells are progenitors in development, tissue homeostasis and regeneration.11 14 15 Hence, we re-assessed ΔNp63 expression, and other basal cell markers, with a focus on healthy human pancreas and chronic pancreatitis (CP), a risk factor for PDAC.16
Studying the three-dimensional (3D) spatial organisation at single cell level in sizeable pancreatic samples requires tissue clearing together with fluorescent labelling and 3D imaging.17 18 However, this approach faces several limitations when it comes to clinical specimens that are often formalin-fixed and paraffin-embedded (FFPE). Applying methods from brain research such as CUBIC, CLARITY and DISCO that were mainly used to study macroscopic changes,19 provided suboptimal results for pancreas, particularly when using light sheet fluorescence microscopy. In addition to two-dimensional (2D) assessment of basal cell markers, we thus had to optimise protocols for a 3D approach.
Here, we report a novel rare cell population in the pancreas that expresses ΔNp63 and other basal cell markers. Contrary to human, we failed to detect this cell population in adult mouse pancreas. Yet, ΔNp63 could be induced in ductal organoids and ΔNp63 suppresses the classical duct cell differentiation programme. This discovery raises important conceptual questions about their developmental origin, fate and role in regeneration and disease, including the basal-type PDAC.
All relevant information is provided in a supplementary section.
Results
Normal human pancreatic ducts harbour a rare ΔNp63+ cell population that becomes more prevalent in CP and in a subset of PDAC
We first assessed the expression of ΔNp63 in organ donors without a history of pancreatic disease. In approximately half (53/113) of the donors, when one random section (67.2±6.8 mm²) was assessed, we detected strong but rare ΔNp63 expression in ducts (figure 1A). This was confirmed by RNA in situ hybridisation for ΔNp63 and by immunofluorescence staining using an anti-P63 antibody that detects all isoforms (online supplemental figure 1). In the normal tissue, from head or tail region, ΔNp63+ cells were detected as single cells in the basal lining of a duct, small clusters around ducts, a combination thereof or very rarely as single cells (online supplemental figure 2A–D), although these observations were limited by interpreting 2D sections.
Supplemental material

Normal human pancreatic ducts harbour a rare ΔNp63+ cell population that becomes more prevalent in CP and in a subset of PDAC. (A) ΔNp63 staining in one representative section of NHP (n=114): Three ductal areas are shown, of which one (a’) contains a limited number of positive cells, and two other areas (a” and a’’’) are negative. (B) ΔNp63 staining in one representative section of human CP (n=11). Three ductal areas are shown, of which two (b’ and b’’) contain a high number of positive cells, and one area (b’’’) is negative. An inset is shown in (b’). (C–F) Representative images of the stainings in a PDAC cohort (n=141), displaying four different tumour groups: (C) negative tumour, (D) partially positive tumour, showing basal cells in one duct, (E) positive tumour and (F) adenosquamous tumour. (G) Quantification of the percentage of ΔNp63+ cells in whole tissue sections from NHP, CP and PDAC. *p<0.05, ****p<0.0001. (H) Quantification of the number of ΔNp63+ cells in ΔNp63+ ducts from NHP and CP. ***p<0.0001. (I) ΔNp63 expression in basal-like (n=37) versus classical subtype (n=7) PDAC cell lines (Error bars indicate SD). *p<0.05. CP, chronic pancreatitis; NHP, normal human pancreas; PDAC, pancreatic ductal adenocarcinoma.
On quantification, 0.006% of all cells were ΔNp63+ (figure 1G), corresponding to 1.6% of all cells in ducts (online supplemental figure 2E). For the ΔNp63-positive samples, we found a random distribution in age, gender, the time in the intensive care, body mass index (BMI) (online supplemental figure 2F–I) and tissue fixation protocol (not shown). Donor characteristics did also not differ between ΔNp63-positive and ΔNp63-negative samples (online supplemental figure 2J–M). When analysing more than one FFPE block (n=4 donors with 2 to 10 FFPE blocks), at least one block harboured ΔNp63+ cells. Together, this suggested that ΔNp63 cells could likely be found in the pancreas of any donor if sufficient material was analysed.
Next, we assessed CP, a condition with expansion of ducts and an established risk factor for PDAC.16 When analysing one section per patient (228.3±17 mm²), the majority of CP (9/11) were positive (figure 1B), with cells usually grouping near ducts and cysts (figure 1B). The occurrence of ΔNp63+ cells in CP was significantly higher (0.17% of total cells (figure 1G) and 4% of duct cells (online supplemental figure 2E) compared with healthy controls. For the same size ducts, the number of ΔNp63+ cells was also significantly increased compared with normal (figure 1H). Only 2.26%±2.11% of ΔNp63+ cells labelled with Ki67 suggesting that their increase in CP is not due to proliferation.
Finally, we assessed a cohort of PDAC (online supplemental table 1) with on average 0.36% of all cells in a section (cancer and adjacent non-cancer) positive for ΔNp63 (figure 1C–G). We did not find a direct correlation between ΔNp63 expression in cancer cells and adjacent tissue (not shown). One-third of tumours, including adenosquamous tumours (online supplemental figure 3A,B), had larger positive areas and had the strongest staining intensity. H-scoring for ΔNp63 in cancer cells correlated with tumour differentiation (p=0.03). ΔNp63 was significantly associated with poorly differentiated tumours (p=0.00078, post-hoc Bonferroni).
Supplemental material
In contrast to the prognostic value of the basal gene expression signature,2 3 20 ΔNp63 as a stand-alone protein marker did not correlate with overall survival (online supplemental figure 3C), confirming a previous report on n=422 PDAC.10 Also, the The Cancer Genome Atlas (TCGA) data set (n=150) showed no survival association with TP63 messenger RNA (mRNA) (log rank=0.15) while it did for the other basal cell markers KRT14 and S100A2 (log rank=0.004 and log rank=0.008, respectively) (https://app.gebican.fr/pdac-survival/).
To further assess the correlation of ΔNp63 expression with the basal-like signature, we took advantage of n=44 PDAC cell lines,21 allowing to directly assess the epithelial component of the tumour. All other transcriptomic studies referred to TP63 (ENSG00000073282), whereas here we specifically distinguished the ΔN-isoform (ENST00000354600). When using the pancreatic adenocarcinoma molecular gradient (PAMG), which reflects gradually the molecular subtypes from the most basal-like to the most classical,22 we confirmed a negative correlation (Pearson’s coefficient R=−0.34, p=0.023) with ΔNp63 (online supplemental figure 3D). Also, in a PurIST binary classification, levels of ΔNp63 expression are significantly higher in basal versus classical PDAC (p=0.036) but, interestingly, a proportion of basal-like PDAC do not express any ΔNp63 (figure 1I and online supplemental figure 3D).
We thus report for the first time the occurrence of rare ΔNp63-expressing cells in normal human pancreatic ducts. Their presence is significantly higher in CP and in a subset of PDAC. The ΔNp63 isoform correlates with the basal-like gene expression signature in PDAC but cannot be used as a reductionist (prognostic) marker.
ΔNp63+ cells are distinct from normal pancreatic duct cells and display typical basal cell markers
To determine the identity of ΔNp63-expressing cells, we analysed the expression of an epithelial marker (E-cadherin), canonical pancreatic duct cell markers (KRT19, CA19.9, SOX9, HNF1β, KRT7) and a marker of pancreatic duct glands (MUC6), a suggested stem cell niche.23 In addition, we analysed basal cell markers (KRT5, KRT14 and S100A2)11 24 25 as well as basal positioning, pale cytoplasm and nuclei.26 In breast, myoepithelial cells express ΔNp63 as well as myogenic markers.27 So, we also analysed calponin and alpha smooth muscle actin (aSMA). All results shown below were made on CP because of the convenience of having more ΔNp63+ cells but the described staining patterns overall did not differ in the rare ΔNp63+ cells in normal pancreas (online supplemental table 2).
Supplemental material
P63+ cells were positive for E-cadherin (online supplemental figure 4) and KRT19 (figure 2A) but not for CA19.9 (figure 2B). Nuclear expression of SOX9 and HNF1B was rare, while all the neighbouring P63– duct cells stained positive (figure 2C,D). P63+ cells also lacked ductal KRT7 (figure 2E).

ΔNp63+ cells are distinct from normal pancreatic duct cells and display typical basal cell markers. (A) IF for KRT19 (white) and P63 (red), showing co-expression; (B) IHC for ΔNp63 (brown) and CA19.9 (red). CA19.9 expression is absent in ΔNp63+ cells and weaker in the duct lumen (see inset); (C) IF for SOX9 (white) and P63 (red). SOX9+ cells are indicated with an orange arrow, while P63+ cells are indicated with a white arrow; (D) IF for HNF1B (white) and P63 (red). HNF1B+ cells are indicated with an orange arrow, while P63+ cells are indicated with a white arrow; (E) IF for KRT7 (white) and P63 (red). White arrow indicates a P63+ cell, while the orange arrow indicates a KRT7+ cell; (F) IF for P63 (red) and KRT5 (white). White arrow indicates a P63+ cell, orange arrow indicates a P63– cell; (G) IF for P63 (red) and KRT14 (white). Solid white arrow indicates a P63+KRT14+ cell, dotted white arrow indicates a P63+KRT14– cell. Orange arrow indicates a P63– cell; (H) IF for S100A2 (white) and P63 (red). Solid white arrow indicates a P63+S100A2+ cell, dotted white arrow indicates a P63+S100A2– cell. Orange arrow indicates a P63– cell. IF, immunofluorescence; IHC, immunohistochemistry.
On a haematoxylin-eosin saffron (HES) staining (online supplemental figure 5A–D), P63+ cells often presented with a basal location, a paler cytoplasm and paler nuclei, compared with P63– cells. All P63+ cells strongly expressed KRT5 (figure 2F), while a subset expressed KRT14 (figure 2G). A large subset was S100A2+, a direct transcriptional target of ΔNp6328 (figure 2H), similar to prostate and airway basal cells.24 25 The pancreatic P63+ cells did not express MUC6 (online supplemental figure 5E,F) and MUC6 did not overlap with the other basal marker KRT5 (online supplemental figure 5G). Additionally, the cells were negative for aSMA and calponin (online supplemental figure 5H–K).
In conclusion, pancreatic ΔNp63+ cells display a phenotype reminiscent of canonical basal cells from other tissues and represent a population of atypical ductal cells.
Ducts containing ΔNp63+ cells express gastrointestinal stem cell markers
In other epithelia, basal cells are thought to be progenitors. Therefore, we investigated gastrointestinal (GI) stem cell markers including DCLK1, CD142 and OLFM429–31 in addition to more general, pluripotent stem cell markers (NANOG, OCT4).
Most basal P63+ cells were DCLK1+ (figure 3A). Singular DCLK1+ P63– cells were also observed, confirming previous reports in pancreas32 33 (figure 3B). Basal cells and some neighbouring luminal cells, specifically of ducts containing P63+ cells, expressed CD142 while CD142 was not found in ducts lacking P63+ cells (figure 3C,D). OLFM4 was absent in P63+ cells and rarely expressed in neighbouring cells (figure 3E). However, we found it exclusively in the lumen of ducts containing P63+ cells (figure 3E,F) and could discard this as being bile (not shown). The cells did not express NANOG or OCT4, in contrast to positive control samples (online supplemental figure 6).

Ducts containing ΔNp63+ cells express gastrointestinal stem cell markers. (A) IF for DCLK1 (white) and P63 (red). P63+ cells express DCLK1 but are not like tuft cells (B) that are solitary cells with apical microvilli and devoid of P63; (C) IF for P63 (red) and CD142 (white). P63+ cells and the cells located at the apical side of P63+ cells express CD142, unlike ducts without P63+ cells (D); (E) IF for P63 (red) and OLFM4 (white). Ducts that contain P63+ cells secrete OLFM4 into their lumen (indicated with asterisk) and rarely contain OLFM4+ cells, unlike ducts that do not contain P63+ cells (F). IF, immunofluorescence.
In summary, ducts containing pancreatic basal cells show expression of some GI stem cell markers, either in the basal cells, in the juxtaposed cells or both, suggesting the basal cells pertaining to a stem cell niche.
FLIP-IT allows 3D visualisation of pancreatic basal cells in archival FFPE tissue
Another distinct feature and function of basal cells is the anchoring to the basal membrane.34 To visualise this, 3D imaging with high magnification and high numerical aperture objectives in conjunction with highly cleared samples and preservation of fluorescence intensity is required. Thus far, imaging at a high magnification (≥20×) could only be achieved with lengthy confocal or two-photon microscopy thus limiting the scanning capabilities, increasing the scanning time and inducing extensive photobleaching.35 36
Hence, we developed a protocol for Fluorescence Light sheet microscopic Imaging of Paraffin-embedded or Intact Tissue (FLIP-IT) with optimised permeabilisation and delipidation based on sodium dodecyl sulfate delipidation buffers. For the Refractive Index matching, we used the complementary effect of CUBIC-R (CUBIC) and ethyl cinnamate (ECi). FLIP-IT enabled us to assess FFPE and intact (fresh) tissues from patients and mice (figure 4A, online supplemental figures 7 and 11) at unmet speed, that is, the process from clearing to imaging was completed in less than 2 weeks, much faster than published methods19 (see also online supplemental methods). ECi also preserved the fluorescent signal for months.
Supplemental material

FLIP-IT allows 3D visualisation of pancreatic basal cells in archival FFPE tissue. (A) Overview of the FLIP-IT protocol for processing of human archival FFPE samples; (B) Overview 3D volume rendering of a large duct system (cyan) with P63+ cells (pink) in normal human pancreas. Objective 20×, zoom 0.36. Scale bar corresponds to 100 µm; (C) Z-plane clipping of B with KRT19 (cyan), P63 (pink) and laminin (green). Asterisk indicates reference structure in B. Objective 20×, zoom 0.36. Scale bar corresponds to 100 µm; (D) Overview 3D volume rendering of a dome positive for P63 (pink) in CP. Objective 20×, zoom 1. Scale bar corresponds to 100 µm. (D’) Inset from D. Yellow arrows indicate P63+ (pink) cells in contact with the basal membrane (orange). White arrows indicate P63+ cells not in contact with the basal membrane. Objective 20×, zoom 1. Scale bar corresponds to 20 µm. n≥2. CR-ECi, CUBIC-R-ethyl cinnamate; FFPE, formalin-fixed and paraffin-embedded; FLIP-IT, Fluorescence Light sheet microscopic Imaging of Paraffin-embedded or Intact Tissue; RI, Refractive Index; 3D, three-dimensional.
Rare P63+ cells could be found as solitary cells in or as clusters attached to ducts with a minimal diameter of 20 micron (figure 4B). Solitary P63+ cells lie between the basal lamina and the luminal cells of large ducts and P63+ clusters also associated to the basal lamina (figure 4C). In contrast, in CP, KRT19+ domes of multiple cell layers formed around a lumen, where only the basally located P63+ cells touched the basal membrane (figure 4D,D').
Because of the overlap between P63 and KRT5 (figure 2F) and the mutual exclusive expression of KRT5 and KRT7, both cytoskeletal markers that allow a good appreciation of cell morphology, 3D image rendering was used for straightforward identification of KRT5+ KRT7– basal cells (online supplemental video 1 and figure 5A). Small clusters of round basal cells in normal pancreas (n=4, one punch each) were grouped around a small lumen (figure 5C,C'). In CP (n=2, two punches each) (online supplemental video 1 and figure 5B), large dome-like clusters associated to cystic ducts and were already apparent from the overview 3D rendering, with KRT5+ cells located at the outside of the domes and KRT7+ cells lining the lumen (figure 5D,D'). 3D measurements of sphericity and volume at single cell level demonstrated that the domes consisted of flatter cells and that the cell volume of the KRT5+ cells had increased in CP (online supplemental figure 8).
Supplementary video

3D imaging of KRT5-positive basal cells in NHP and expansion as dome-like structures in CP. (A) Overview 3D rendering of NHP and (B) CP from FFPE blocks stained for KRT5 (pink) and KRT7 (cyan). Arrows indicate magnified regions in (C) and (D). Objective 20×, zoom 0.36. Scale bar corresponds to 500 µm; (C) HR-LSFM of a KRT5+ (pink) dome on a large KRT7+ (cyan) duct with lumen diameter 120 µm at its widest point in normal pancreas. Asterisk indicates lumen. Objective 20×, zoom 2.5. Scale bar corresponds to 20 µm; (D) HR-LSFM of dome wall showing its constitution in CP. Objective 20×, zoom 2.5. Scale bar corresponds to 20 µm; (C’) inset from C showing in detail the cellular structure of KRT5+ (pink) cells in NHP. Objective 20×, zoom 2.5. Scale bar corresponds to 5 µm; (D’) HR-LSFM of dome wall showing flat KRT5+ (pink) and KRT7+ (cyan) cells intercalated (yellow arrow) and KRT5+ (pink) cells lining the exterior of the dome wall. Asterisk indicates lumen. Objective 20×, zoom 2.5. Scale bar corresponds to 5 µm. n≥2. 3D, three-dimensionalCP, chronic pancreatitis; FFPE, formalin-fixed and paraffin-embedded; HR-LSFM, high-resolution light sheet fluorescence microscopy; NHP, normal human pancreas.
Thus, leveraging on a novel imaging protocol, FLIP-IT, that is widely applicable, we established the spatial distribution and morphometric features of individual pancreatic basal cells within the ductal tree, in normal pancreas and CP.
ΔNp63 expression is undetectable in commonly used mouse models of pancreatic disease but is acquired by a subset of SOX9low duct cells
We re-assessed ΔNp63 expression in adult mouse pancreas since single-cell RNA sequencing studies did not provide evidence for its expression (online supplemental table 3). In contrast to mouse mammary gland and skin (online supplemental figure 9), ΔNp63 was undetectable in pancreas, even when assessing over 4×10⁶ duct cells with artificial intelligence (AI)-assisted identification of duct cells, including larger ducts such as the main pancreatic duct and the common bile duct (online supplemental figure 10). The 95% CI for the number of ΔNp63+ cells per sample ranges from 0 to maximum 3.633031e–06 (meta-analysis) or 1.215163e–07 (Clopper-Pearson). Hence, we have no reason to assume that ΔNp63+ cells exist in the adult mouse pancreas. If they do, their occurrence is too limited to deduce meaningful information unless after analysing very large sample sizes. Similarly, we did not find ΔNp63+ cells in pancreas from pregnant, postpartum, neonatal and aged mice (figure 6A). We also analysed experimental models of CP, that were, caerulein-treated (treatment up to 8 weeks, analysis up to 14 weeks after treatment) or duct-ligated KrasWT mice and caerulein-treated KrasG12D (KC) mice.37 ΔNp63 was undetectable here as well as in tumours from Kras and Trp53 mutant KPC mice.37 All these samples were also negative for KRT5 and KRT14 (not shown). 3D imaging of a whole mouse pancreas, including the main duct (online supplemental figure 11) confirmed the absence of KRT5+ cells. In addition, Krt14-eGFP mice showed no KRT14 by GFP or KRT14 staining (skin was positive, not shown). Also, adult rat (n=7) and pig pancreas (n=3) were negative.
Supplemental material
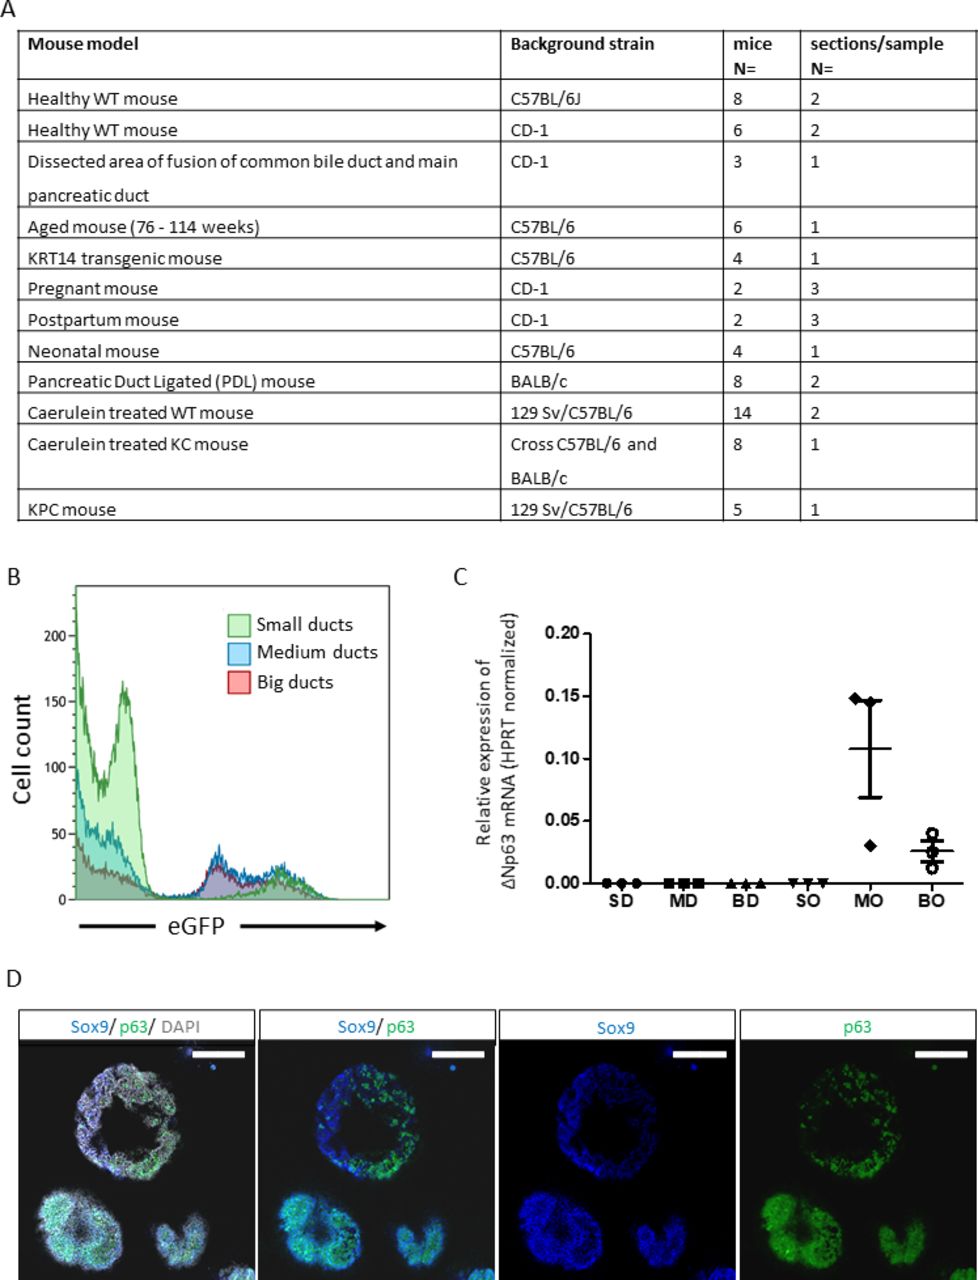
ΔNp63 is induced in mouse pancreatic organoids but is undetectable in normal mouse pancreas and in mouse pancreatic disease models. (A) Table summarising mouse models used to investigate ΔNp63 expression using immunohistochemistry staining for ΔNp63, Krt14 and Krt5. Background strain is indicated for each separate mouse model. Number of mice analysed, and sections analysed per sample are indicated. (B) Representative flow cytometry plot of ductal cells isolated from Sox9:eGFP reporter mice, showing different levels of Sox9:eGFP expression that inversely correlate with the size of the ducts. (C) Bar plot indicates ΔNp63 mRNA levels normalised to Hprt of mouse ducts of different sizes (BD, big duct; MD, medium duct; SM, small duct) and organoids derived of the aforementioned ducts (organoids derived from BO, big ducts; MO, medium ducts; SO, small ducts). Error bars indicate SD of three independent experiments. (D) Representative immunofluorescence staining of p63 (green) and Sox9 (blue) of organoids derived from big to medium sized ducts. Nuclei are stained grey (DAPI). Scale bar=200 µm. mRNA, messenger RNA; WT, wild type.
We next investigated organoid cultures that favour a progenitor cell-like phenotype. We used ductal cell digests from Sox9-eGFP reporter mice.38 These preparations showed intrinsic heterogeneous SOX9 expression with larger ducts having lower expression (figure 6B). Cell fractions were produced according to eGFP expression level, corresponding to the size of the ducts. None of the freshly isolated cell fractions showed ΔNp63 expression by real-time quantitative PCR (figure 6C), confirming our histological analyses (figure 6A). On organoid culture, cells from SOX9low medium to large size ducts showed an upregulation of ΔNp63 (figure 6C), as well as of Krt5 and Krt14 mRNA (not shown) gene expression. Whole mount staining of organoids confirmed a heterogeneous pattern of p63 protein expression that correlated with the lowest levels or with near absence of SOX9 (figure 6D and online supplemental video 2), reminiscent of the findings in human pancreas. P63+ cells showed little proliferation, as observed by 5-ethynyl-2′-deoxyuridine (EdU) labelling (online supplemental figure 12). Different from p63, Krt5 and 14 were not detected. Thus, organoids from larger ducts activate basal markers but do not fully acquire a basal phenotype.
Supplementary video
In conclusion, while normal adult mouse pancreas and commonly used models of CP and PDAC do not show basal cells. Organoid cultures established from larger pancreatic ducts can acquire ΔNp63 expression, pointing at plasticity in duct cell differentiation.
ΔNp63 supports a basal differentiation state while repressing classical duct cell identity
HPDE cells, obtained after immortalisation of cells from larger human pancreatic ducts,39 express ΔNp63 (online supplemental figure 13A,C), hitherto unreported. TAp63 is also expressed, however at lower levels (not shown). Hence, HPDE cells provided a useful proxy to decipher the role of ΔNp63 in the pancreatic duct cell. Four different small interfering RNAs (siRNAs) gave efficient knockdown (KD) of ΔNp63 (online supplemental figure 13B), with the one against the ΔN isoform validated at protein level (online supplemental figure 13C). RNAseq analysis of the KD experiment highlighted 1593 differentially expressed genes (online supplemental table 4). Of these, TP63 and another 748 genes were downregulated and 844 genes were upregulated (figure 7A). The top upregulated genes feature MUC1 and PADI2, known pancreatic duct cell genes,40 as well as several endocrine genes. Downregulated genes were enriched for the KEGG pathways ‘Cell cycle’ and ‘Hippo Signalling Pathway’, consistent with the reported roles of ΔNp63 and basal cells,4 41 42 whereas upregulated genes featured in ‘Cytokine-cytokine receptor interaction’ and 'metabolic pathways'. Next to MUC1, other duct cell genes such as SOX9 appeared upregulated while basal cell genes were downregulated (figure 7C,D), as confirmed by immunofluorescence staining and qRT-PCR, and validated for other siRNAs (figure 7E,F and online supplemental figure 13D). KD of ΔNp63 in the mouse duct-derived organoids confirmed upregulation of SOX9, HNF1B and, to some extent, KRT19, especially in medium-sized duct organoids (online supplemental figure 13E). Finally, to confirm the association of ΔNp63 with basal gene expression and repression of ‘classical’ duct cell genes, we assessed the PAMG scores. The results showed that after ΔNp63 KD, the cells shifted from a basal-like to a classical phenotype (figure 7G). These findings highlight that ΔNp63’s described role in PDAC3 also applies to normal duct cells.
Supplemental material

ΔNp63 maintains a basal cell differentiation state while repressing duct cell identity. (A) Volcano plot and (B) KEGG pathway analysis of differentially expressed genes after KD of ΔNp63+ in HPDE cells (n=3, p<0.01 and FDR<0.01). In orange, the pathways represented by downregulated genes, in purple those from the upregulated genes. (C) Volcano plot of basal and (D) of ductal markers in the same RNAseq data. (E) Confirmation of basal (P63 and KRT5) and classical ductal marker KRT19 by immunofluorescence staining and (F) quantitative RT-PCR (*p<0.05; **p<0.01; ***p<0.001; ****p<0.0001). (G) Correlation of PAMG scores in ΔNp63 KD (purple) and control (orange) HPDE samples (R =–0,95, p=0.0032). FDR, false discovery rate; KD, knockdown; PAMG, Pancreatic Adenocarcinoma Molecular Gradient.
We conclude that concurrent with its known master regulatory function in suppressing epithelial cell differentiation, ΔNp63 also suppresses pancreatic duct cell differentiation in favour of a basal differentiation programme.
Discussion
Despite a consensus on the existence of a basal-like molecular subtype of PDAC driven by ΔNp63,3 it is widely accepted that ΔNp63-expressing cells do not exist in healthy human and mouse pancreas.3 8–11 Here, we provide compelling evidence of a ΔNp63+ cell population in the pancreas of individuals without a history of pancreatic disease. The lack of association with socio-demographic and clinical parameters suggests that this cell fate is a constitutive feature of normal pancreatic differentiation.
The location of ΔNp63+ cells between the basal membrane and the luminal duct cells and their expression of KRT5, KRT14 and S100A2 shows that they are the counterpart of basal cells from other epithelial tissues. Like airway basal cells, they are either KRT14+ or KRT14–, while they are all KRT5+.43 KRT5 and KRT14 were reported in the human pancreas44 in less than 5% of ductal cells, corresponding with our findings. Studies using transmission electron microscopy reported a basally located cell type in human and rat pancreas, which were suggested to be a source of new ductal cells.45 46 Previous studies were likely limited by the lack of large collections of normal pancreata. Altogether, our findings call for a re-evaluation of the concept that the pancreatic duct is a homogeneous ‘simple epithelium’, as established in classical histology textbooks.
The ΔNp63+ basal cells of the pancreas are situated in the ductal tree and express KRT1944–47 but the overall absence of CA19.9, SOX9 and HNF1B indicate that these cells represent a novel pancreatic duct cell type. Single-cell RNA sequencing (scRNAseq) has failed to provide evidence thereof. A recent paper on human duct cell heterogeneity48 did not report cells with basal cell characteristics, possibly because only ALK3+ cells were analysed and ALK3 itself has not been reported in basal cells.24 Other scRNAseq of human pancreas49 50 did not pick up (ΔN)p63 either. The rarity of ΔNp63+ cells, their restricted distribution along the ductal tree and the shallowness of current scRNAseq likely account for this. In one data set, we detected rare ΔNp63+ cells in patients with type 2 diabetes,51 reaffirming their increased presence in disease.
We established a 3D imaging pipeline that allowed for the first time assessing cubic millimetres of a clinical sample or a whole mouse pancreas. Using FLIP-IT with punches of archival samples, we visualised the ductal tree and confirmed the existence of rare basal cells in ducts with a minimal diameter of 20 µm. In CP, these cells were differently organised as larger multilayer dome structures that could reach sizes of cubic millimetre order. Thus FLIP-IT allows for unprecedented 3D views of cells stained for markers of choice, endowing researchers with a wealth of information on (pancreatic) histopathology. We envision that this new approach can also inform about the exact positioning of, for example, stromal cell types versus tumour epithelium.
In contrast to human tissue, we failed to detect any basal cell in the adult mouse pancreas, including several disease models in which other organs activate such population.52 53 Bearing in mind that Sox9 in human pancreatic basal cells was rare, we assessed mouse pancreatic duct cells according to their variable Sox9 expression. Indeed, only when culturing the Sox9low duct cells under stem cell-favouring organoid conditions, ΔNp63 expression was induced. This illustrated an inherent potential of duct cells to turn on a basal cell phenotype. However, our data suggest that published work might have missed this important cell type when using murine tissue. If basal cells were to exist in mice, using Sox9 and Hnf1b as Cre-drivers may not be adequate models. Krt19-Cre might be more suitable since all pancreatic basal cells, at least in human, express KRT19.
Our findings warrant studies on pancreatic basal cells in homeostasis and disease. Pancreatic stem cells have been disputed and have been mostly studied in the context of β-cell regeneration. Only after substantial tissue injury, (facultative) stem cells appear to become activated.54 It is conceivable that basal cells would be a different and ‘last resort’ stem cell, similar to skin and intestine, where different types of stem cells reside in restricted niches. In pancreas this niche appears to express markers of GI stem cells. Commonly for such cells, their full potential is not called upon under normal physiological conditions, only specific conditions may recruit these cells.55 The organoid culture conditions could have provoked such response. Interestingly, SOX9– cells in the ductal tree seem to contribute to new β-cells56 and a SOX9-dosage effect mediates adult duct cell identity.57 We find a broader duct cell plasticity regulated by ΔNp63 in HPDE where ΔNp63 favours the basal cell fate at the expense of differentiated duct cell markers, including but not restricted to suppression of SOX9. It remains speculative whether ΔNp63 expression in HPDE is due to the cell of origin being a basal cell or being acquired on immortalisation and inactivation of TP53.
We demonstrate that pancreatic basal cells are more abundant in CP suggesting an active contribution to its pathogenesis. With the very low rate of proliferation and conscious of the duct cell plasticity discussed above, our data suggest that this increase is due to altered cell differentiation rather than proliferation of pre-existing basal cells. Early-stage samples of disease would facilitate such study but are scarce. In absence of mouse models, development of human modelling systems, for example, using purified basal cells from adult human pancreas, would be very valuable.
One clear gap of knowledge is the development of subtypes of PDAC. Their ontogeny and plasticity could be driven by oncogenic mutations and by environmental stress but could also be the cell of origin. Murine pancreatic acinar and duct cells can generate tumours1 58 and different PDAC phenotypes share traits with the cells of origin where (epi)genetic features of duct cells are retained in the more aggressive basal subtype.59 60 Our findings call for considering the role of basal cells. The inverse correlation of ΔNp63 and SOX9 expression is also reminiscent of our previous work where the basal subtype showed the lowest SOX9 expression.61 We now added that ΔNp63 cannot replace the basal gene expression signature, in line with the Notta study where ΔNp63 and other basal cell markers were limited to a smaller subset of basal-like A tumours not associated with poor prognosis. A better understanding of the basal cells may provide critical insights in this matter. Chan-Seng-Yue5 and Miyabayashi et al62 pointed to the evolution of some classical PDAC into a basal phenotype. One could speculate that tumours arising from or harbouring basal cells would present a wider differentiation potential to transition from classical to basal than those arising from a cell with committed differentiation.
In the light of our discovery of pancreatic basal cells, the established role of basal cells in other tissues and their absence in commonly used mouse experimental models, our observations compel re-interpretation of the cellular pathogenesis of pancreatic diseases.
Data availability statement
Data are available upon reasonable request. All data relevant to the study are included in the article or uploaded as supplementary information. All relevant data can be requested by contacting the corresponding author.
Ethics statements
Patient consent for publication
Ethics approval
Mouse experiments in the Cell Differentiation laboratory received ethical approval (16-277-1 (LA1230277)). Ethical approval for the mouse experiments at de Duve institute received under ID 2019/UCL/MD/005. Mouse experiments in the University of Pittsburgh Medical Center received ethical approval under ID 18022411.
Acknowledgments
We would like to thank the Centre for Inflammation Research at VIB-UGent for pancreata of their transgenic mouse model, the Cell Differentiation laboratory for sections of neonatal mice and the use of their antibodies, the Beta Cell Neogenesis laboratory for sections of the PDL mice and the Reproduction and Genetics laboratory for the use of their antibodies. We thank the Beta-Cell Bank and the Central Biobank UZ Brussel for the human samples. Sequencing and analysis were performed by VIB Nucleomics Core (www.nucleomics.be). We thank Suzanne Blotwijk for the advanced statistical analyses.
References
Supplementary materials
Supplementary Data
This web only file has been produced by the BMJ Publishing Group from an electronic file supplied by the author(s) and has not been edited for content.
Footnotes
SM, KC and MVB are joint first authors.
Twitter @SamadELKA, @TxellRovira
SM, KC and MVB contributed equally.
JC and AFR contributed equally.
Contributors This study was conceptualised and designed by SM, KC, MVB, MR and IR. SM, KC, MVB, TA, AFR, JC, AEK, HM, YH, GL, DLDP, ND'H, CB and MR performed experiments, data collection and interpretation. FE, HH, LB, PJ, PiV, ND, J-LVL, WW, PL, FXR and MR provided intellectual input and important samples. SM, KC and IR wrote the manuscript, and all authors edited the manuscript. KC, SM and MVB contributed equally to this paper. JC and AFR contributed equally to this paper as well.
Funding Work in the LMMO laboratory was supported by Stichting tegen Kanker Translational & Clinical Research Grants 2018 #2092. IR is a recipient of an Odysseus I fellowship of the Research Foundation-Flanders (FWO). MVB was financially supported by the Award Cancer Research-Oncology Center Vrije Universiteit Brussel, funded by the bequests of late Ms Esther Desmedt and late Ms Irma Noëand and Wetenschappelijk Fonds Willy Gepts of the UZ Brussel. KC is a recipient of a PhD Fellowship of the FWO (Grant ID 1157221N). Work in the laboratory of FXR is supported, in part, by grant RTI2018-101071-B-I00 from Ministerio de Ciencia e Innovación (Madrid, Spain) (co-funded by the ERDF-EU). CNIO is supported by Ministerio de Ciencia, Innovación y Universidades as a Centro de Excelencia Severo Ochoa SEV-2015-0510. M.R, A.F and J.C reserach was supported by RYC-2017-21950 (AEI/EFS,UE) and SAF2015-73226-JIN (AEI/FEDER, UE). We thank CIBER-BBN and CERCA Programme / Generalitat de Catalunya for IDIBELL institutional support.
Competing interests None declared.
Provenance and peer review Not commissioned; externally peer reviewed.
Supplemental material This content has been supplied by the author(s). It has not been vetted by BMJ Publishing Group Limited (BMJ) and may not have been peer-reviewed. Any opinions or recommendations discussed are solely those of the author(s) and are not endorsed by BMJ. BMJ disclaims all liability and responsibility arising from any reliance placed on the content. Where the content includes any translated material, BMJ does not warrant the accuracy and reliability of the translations (including but not limited to local regulations, clinical guidelines, terminology, drug names and drug dosages), and is not responsible for any error and/or omissions arising from translation and adaptation or otherwise.