Article Text

Abstract
Objective To examine patterns of colorectal cancer (CRC) screening uptake over three biennial invitation rounds in the National Health Service (NHS) Bowel Cancer Screening Programme (BCSP) in England.
Methods We analysed data from the BCSP's Southern Hub for individuals (n=62 099) aged 60–64 years at the time of first invitation to screening with a follow-up period that allowed for two further biennial invitations. Data on sex, age and a neighbourhood-level measure of socioeconomic deprivation were used in the analysis. Outcomes included uptake of guaiac-based faecal occult blood (gFOB) test screening, inadequate gFOB screening (≥1 test kit(s) returned but failed to complete further gFOB tests needed to reach a conclusive test result), test positivity, compliance with follow-up examinations (usually colonoscopy) and diagnostic outcomes.
Results Overall gFOB uptake was 57.4% in the first, 60.9% in the second and 66.2% in third biennial invitation round. This resulted in 70.1% of the initial cohort having responded at least once, 60.7% at least twice and 44.4% three times. Participation in the first round was strongly predictive of participation in the second round (‘Previous Responders’: 86.6% vs ‘Previous Non-Responders’: 23.1%). Participation in the third round was highest among ‘Consistent Screeners’ (94.5%), followed by ‘Late Entrants’ (78.0%), ‘Dropouts’ (59.8%) and ‘Consistent Non-Responders’ (14.6%). Socioeconomic inequalities in uptake were observed across the three rounds, but sex inequalities decreased over rounds. Inadequate gFOB screening was influenced by screening history and socioeconomic deprivation. Screening history was the only significant predictor of follow-up compliance.
Conclusions Screening history is associated with overall gFOB uptake, inadequate gFOB screening and follow-up compliance. Socioeconomic deprivation is also consistently associated with lower gFOB uptake and inadequate gFOB screening. Improving regular screening among identified ‘at-risk’ groups is important for the effectiveness of CRC screening programmes.
- screening participation
- repeated invitations
- screening history
- health inequalities
This is an Open Access article distributed in accordance with the Creative Commons Attribution Non Commercial (CC BY-NC 3.0) license, which permits others to distribute, remix, adapt, build upon this work non-commercially, and license their derivative works on different terms, provided the original work is properly cited and the use is non-commercial. See: http://creativecommons.org/licenses/by-nc/3.0/
Statistics from Altmetric.com
Significance of this study
What is already known on this subject?
-
There are strong sex and socioeconomic inequalities in colorectal cancer (CRC) screening uptake.
-
Screening history is strongly associated with subsequent CRC uptake.
-
Repeated invitations to screening successfully engage previous non-responders.
-
While many respond to at least one screening invitation over multiple invitation rounds, a considerably smaller number respond consistently to all invitations.
What are the new findings?
-
Dropout in the second biennial invitation round following a screen in the first round is associated with lower uptake in the third round than delayed prevalence screening in the second round.
-
Socioeconomic inequalities in uptake persist, while sex inequalities decrease over three invitation rounds.
-
An irregular screening history and socioeconomic deprivation are associated with inadequate gFOB screening (failing to complete multiple gFOB test kits needed to reach a conclusive test result).
-
Screening history is predictive of compliance with follow-up examinations (usually colonoscopy).
How might it impact on clinical practice in the foreseeable future?
-
An irregular screening history and socioeconomic deprivation are risk factors of non-compliance at various stages in the CRC screening process.
-
Efforts to increase (continued) engagement among these ‘at-risk’ groups are important to optimise the long-term impact of organised screening programmes.
Introduction
Colorectal cancer (CRC) is the second highest cause of cancer deaths in developed countries.1 Trials have shown that CRC screening using a guaiac-based faecal occult blood (gFOB) test reduces CRC mortality by up to 25% among those who participate.2 ,3 In England, CRC screening is organised through the National Health Service (NHS) Bowel Cancer Screening Programme (BCSP), and all adults aged 60–74 years (inclusive) are invited to complete a gFOB test every 2 years. The programme was launched in 2006, and screening to the 60–69-year age group was available in all areas by 2010, and by March 2014 it was available to those aged up to and including 74 years in all but two areas. The average, overall uptake of screening has been around 54%.4 Socioeconomic deprivation is strongly associated with uptake, which ranges from 35% in the most deprived quintile to 61% in the most affluent quintile,4 and women are also more likely to take part than men.5
Invitations to screening are sent to all age-eligible adults every 2 years, irrespective of screening history (ie, previous screening participation). ‘Prevalence screening’ is the term commonly used to describe first-time screening, and ‘incidence screening’ for screening of subjects who have been screened on a previous occasion. Studies have shown that repeated invitations to screening can successfully engage a substantial number of previous non-responders. English and Scottish demonstration pilots achieved uptake of 14–15% at the second, and 10% at the third invitation to prevalence screening.5 ,6 However, only a minority of subjects in Scottish and Italian pilots consistently responded over multiple biennial invitations rounds.7 ,8
The English pilot data also suggest that socioeconomic inequalities in uptake of screening invitations persist over time, although sex differences decreased.5 The English pilot investigators combined data from prevalence and incidence screens however, and any association between uptake and screening history was not investigated. We also do not know whether some groups are less resilient in overcoming potential obstacles within a screening episode. The need to repeat gFOB tests, or to refer participants for follow-up investigations after an abnormal gFOB test result, can lead to incomplete screening and might have a disproportionately discouraging effect among the ‘hard-to-reach’ population, such as men and individuals from deprived backgrounds.
Screening history and known sociodemographic inequalities in uptake need to be considered in order to understand CRC screening uptake over time and over successive screening invitation rounds. This study examines the effects that screening history, socioeconomic deprivation, and sex might have on CRC screening uptake over three biennial invitation rounds in the BCSP in England.
Methods
Colorectal cancer screening in England
The NHS in England operates an organised CRC screening programme with a comprehensive call and recall system. All adults in England who are aged 60–74 years (inclusive) and are registered with a general practitioner (GP) are invited by the NHS BCSP to biennial CRC screening using a gFOB test kit. Primary care providers are not involved with the invitation process. A preinvitation letter including an information leaflet is first sent by one of five Screening Hubs. A test kit, spatula, instruction leaflet and freepost return envelope are sent about 8 days later, unless requested not to do so by the invited subject. Subjects who do not respond to the screening invitation are sent a reminder 28 days after mailing the test kit. The test kit used by the BCSP in England (hema-screen, Immunostics, USA) has three paired windows. Two faecal samples from three consecutive stools are applied to each of the six windows in turn. In the laboratory, each window is tested for the presence of blood. Participants with five or six positive windows (a strong positive or ‘abnormal’ result) are offered an appointment with a specialist screening practitioner (SSP) to discuss further investigation, usually colonoscopy. If a participant has only one, two, three or four positive windows (a weak positive or an ‘unclear’ result) the participant is asked to complete another test kit. If the second test kit is negative (no positive windows), a third test kit is requested and if the third test kit is negative, the subject is returned to routine biennial screening. If any windows on a second or third test kit are positive (‘abnormal’ result), an appointment with an SSP is arranged. When a test kit is designated ‘spoilt’ (ie, inadequate or undated sample collection) or ‘technically failed’ (ie, laboratory-based reading error) a further test kit is mailed to the subject within the same screening round.
Sample
This study used anonymised data from the Bowel Cancer Screening Southern Programme Hub. The Hub is responsible for the biennial screening of all 60–74-year-old subjects in southern England (excluding London), and invites approximately 1.1 million subjects annually.
Data were extracted from the Bowel Cancer Screening System (BCSS) for all subjects (n=62 099) who, at the time of their first screening invitation, were aged 60–64 years between September 2006 and February 2008. The specified age range ensured that, for the period of the study, all subjects were eligible for three biennial screening invitation rounds. The term ‘round’ describes a cohort of subjects invited to be screened, and ‘three biennial invitation rounds’ refers to a cohort of subjects who have received a third invitation to be screened having received two previous invitations (at two-yearly intervals) in which they may, or may not, have chosen to participate.
Screening activity was recorded until December 2012 to allow a minimum of 3 months for subject response, possible follow-up investigations and changes to invitation dates made by the Hub to minimise fluctuations in referred colonoscopy workload (‘invitation smoothing’).9
Within the identified population, some subjects did not receive three biennial screening invitations because of on-going surveillance for polyps/adenomas, a significant medical condition including cancer, relocation outside the catchment area of the Hub, a written request declining any further screening invitations or due to the death of the subject. Those who inform the Hub that they wish to ‘opt-out’ of their current biennial screening round are routinely reinvited in 2 years’ time, unless they complete an ‘Informed Dissent Ceasing’ form.
Measures
For each of the three biennial invitation rounds examined in this study, the following was recorded: if and when each subject was sent an invitation for gFOB test screening, whether they had been adequately screened (definitive gFOB test result), the screening test result if adequately screened (negative or positive), and the number of test kits completed by each participant within each screening round. The following were derived from the screening date: percentage of participants requiring only one test kit within one screening round (number adequately screened from 1 test kit/number completed ≥1 test kit(s), adequately or inadequately screened), the percentage of participants who required multiple test kits within one screening episode (100% -% requiring one test kit only), and the percentage of subjects who were inadequately screened due to failure to complete the number of test kits required to reach a definitive result (number completed ≥1 test kit and not adequately screened/number completed ≥1 test kit, adequately or inadequately screened).
For participants who had received a positive (abnormal) test result, attendance at the SSP appointment and compliance with follow-up (colonoscopy or another follow-up examination) was recorded. A single dichotomous variable for follow-up compliance was created and defined as failure to attend either SSP OR colonoscopy/other follow-up examination (0) and attendance of SSP AND colonoscopy/other follow-up examination (1). For those who had undergone follow-up examinations, the diagnostic outcome of the follow-up investigation was also recorded. Colonoscopy is the default follow-up investigation in the BCSP, but alternative investigations, such as CT colonography (CTC), flexible sigmoidoscopy or rarely, barium enema, are offered if colonoscopy is deemed unsuitable. Diagnostic outcome categories included CRC, high-risk or intermediate-risk adenomas (at least 3–4 adenomas of <1 cm or one >1 cm), low-risk adenomas (1–2 adenomas of <1 cm)10 and ‘other abnormal findings’ (eg, Crohn’s disease, ulcerative colitis and diverticulitis).
Sex and age at the time of invitation, and an area-level measure of socioeconomic deprivation (Index of Multiple Deprivation (IMD) score) were also recorded for each invited subject. The IMD score uses 2001 census-derived indicators of income, education, employment, environment, health and housing for each individual's residential postcode sector to create a scale from 0 (least deprived) to 80 (most deprived).11 The IMD score was used for regression analyses. For illustrative purposes, IMD quintiles were generated using the IMD scores of the total population included in the dataset. The average age was 61.8 years at the first, 64.0 at the second, and 66.0 at the third invitation round. Age was categorised into three groups for each invitation round. The first two age categories consist of a 2-year timespan, whereas, the third category comprises all older ages.
Late completion of test kits, delays due to follow-up investigations or Hub invitation smoothing practices, caused some subjects to receive invitations significantly longer than 2 years after a previous invitation.
We also coded a variable denoting uptake in previous invitation rounds. Table 1 describes the resulting subgroups by screening history in the second and third biennial invitation rounds.
Screening history of subgroups in the second and third biennial invitation rounds
Data analysis
gFOB uptake of screening invitations (ie, adequately screened), inadequate gFOB screening, test positivity, follow-up compliance and diagnostic outcomes are described for each invitation round. Multivariable logistic regression analysis was used to examine the effects of screening history and sociodemographics on uptake for each invitation round, inadequately screening and follow-up compliance. Multivariable logistic regression was also used to test for sociodemographic effects on uptake in each of the screening history subgroups in the second and third biennial invitation rounds. Two-sample tests of proportions were used to test for differences between invitation rounds or between screening history subgroups in uptake, inadequate screening, test positivity, follow-up compliance and diagnostic outcomes.
Results
gFOB uptake over three biennial invitation rounds
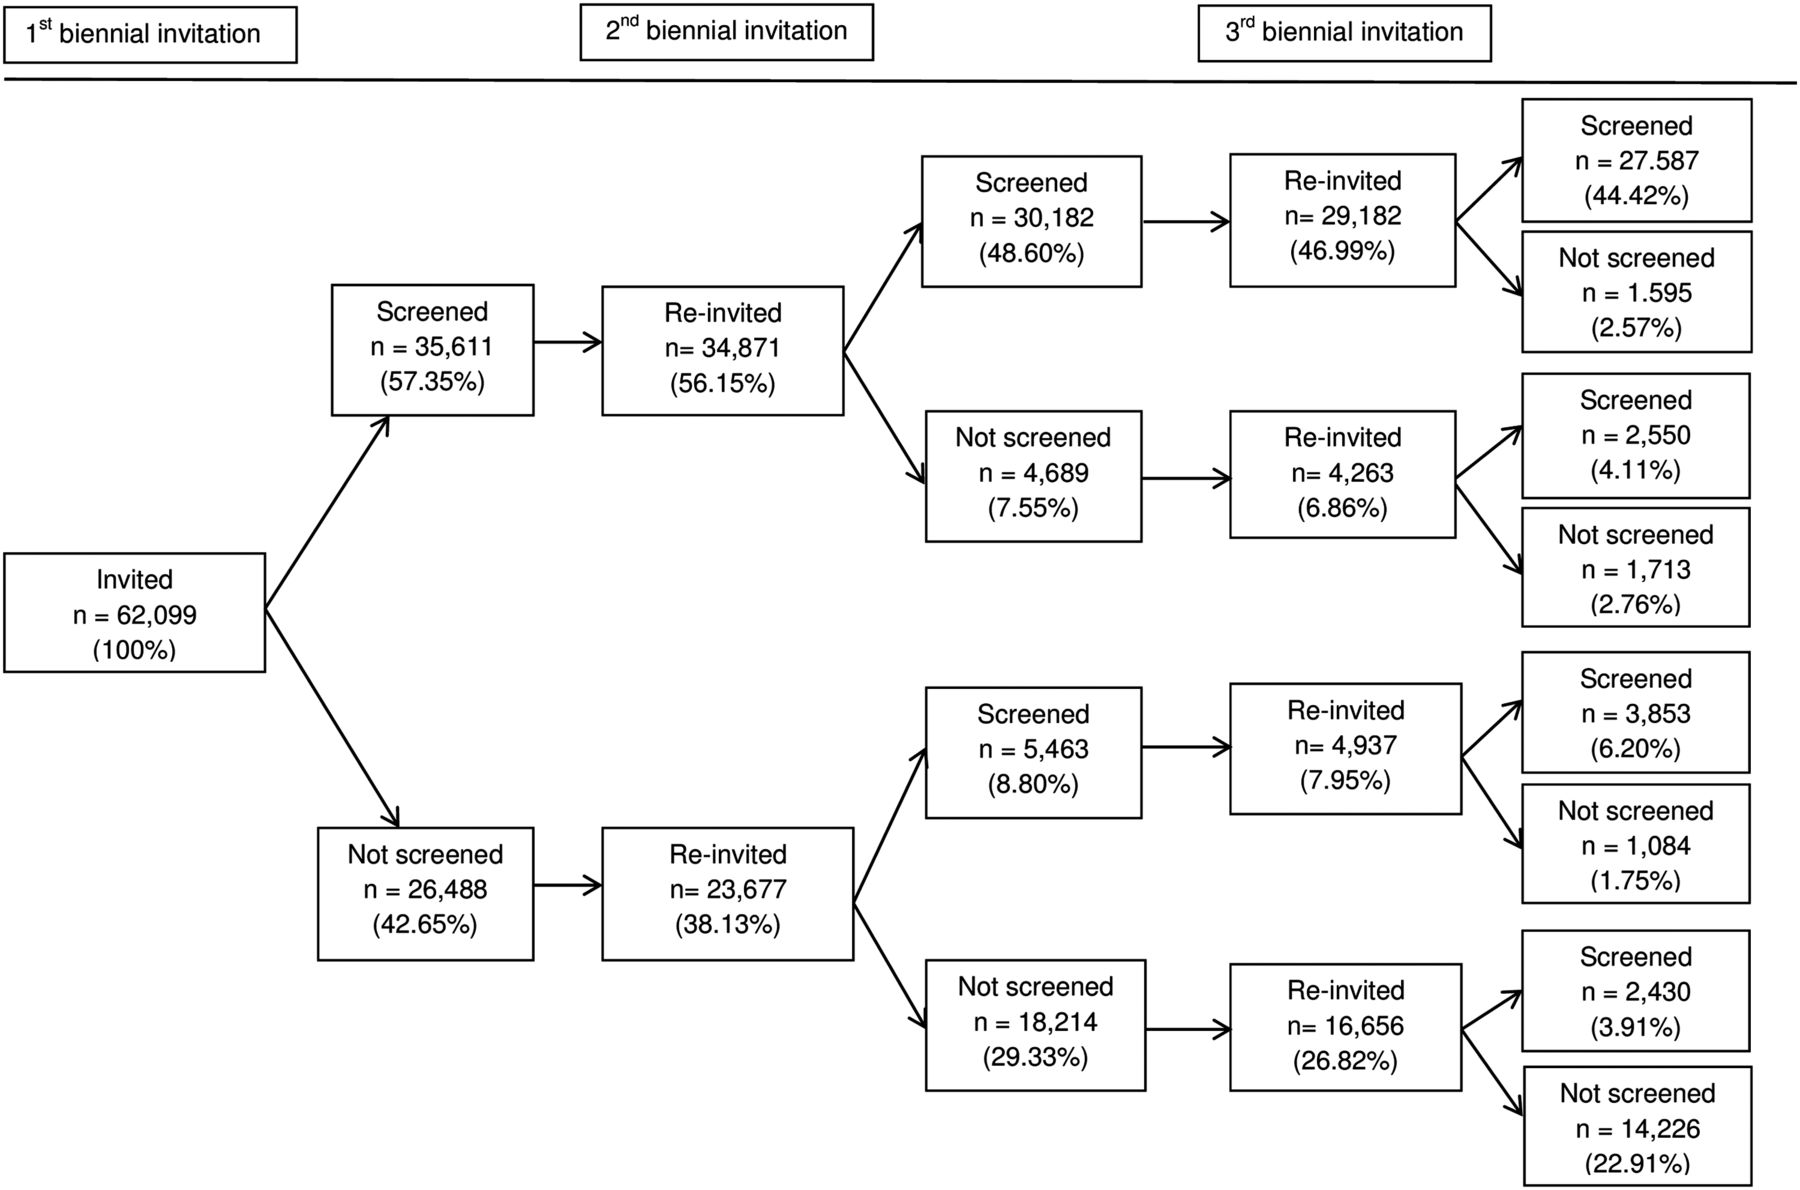
Of the subjects first invited between September 2006 and February 2008, overall gFOB uptake was 57.4% in the first, 60.9% in the second (p<0.001), and 66.2% in the third (p<0.001) biennial invitation rounds (table 2). This resulted in 43 511 (70.1%) subjects in the initial cohort having responded at least once, 37 667(60.7%) at least twice and 27 587 (44.4%) three times after three invitation rounds. The number of invitations and uptake over the three biennial invitation rounds by response to previous invitations are presented in figure 1. Screening history was strongly associated with subsequent uptake in the second and third biennial invitation rounds, and will be discussed for each invitation round below.
Uptake per biennial screening invitation round by sociodemographics and other outcomes in percentages with the denominator (n)

sample sizes in each biennial invitation round by previous uptake (in percentages of the total sample).
The difference in uptake between women and men was greatest in the first biennial invitation round (61.3% vs 53.3%, OR=0.72, 95% CI 0.70 to 0.74, p<0.001), and less in the second (63.7% vs 58.0%, OR=0.93, 95% CI 0.89 to 0.97, p<0.01) and third round (68.2% vs 64.1%, OR=1.05, 95% CI 0.99 to 1.10, ns.; table 3). A gradient in uptake by socioeconomic deprivation was observed in all three rounds (1st round: ∼14.2% difference between the lowest and highest quintile, OR=0.98, 95% CI 0.98 to 0.98, p<0.001; 2nd round: ∼16.0%, OR=0.98, 95% CI 0.98 to 0.99, p<0.001; 3rd round: ∼16.4%, OR=0.99, 95% CI 0.98 to 0.99, p<0.001). There was little difference in uptake between the age groups.
Multivariable logistic regression results of gFOB uptake by biennial screening invitation round
Second biennial invitation round gFOB uptake by screening history
As stated earlier, overall uptake was 60.9% in the second biennial invitation round (table 2). Of the ‘Previous Responders’ who were reinvited, 86.6% responded to the second invitation, whereas, only 23.1% of ‘Previous Non-Responders’ responded to a second invitation (p<0.001; table 4).
Uptake in the second biennial screening invitation round per subgroup by sociodemographics and other outcomes in percentages with the denominator (n)
Socioeconomic and sex effects were observed among ‘Previous Responders’ and ‘Previous Non-Responders’ alike, and were similar to the overall results for the second invitation round. The older age subjects showed significantly higher uptake among ‘Previous Non-Responders’ (62–63: 22.3%, ref; 64–65: 23.6%, OR=1.07, 95% CI 1.00 to 1.14, p<0.05; 66+: 25.2%, OR=1.18, 95% CI 1.05 to 1.32, p<0.01), but not among ‘Previous Responders’ (table 5).
Multivariable logistic regression results of gFOB uptake in the second biennial screening invitation round per subgroup
Third biennial invitation round gFOB uptake by screening history
Overall uptake was 70.1% in the third biennial invitation round, as discussed previously (table 2). An overwhelming 94.5% of those who had responded to the first two biennial invitations (‘Consistent Screeners’) also responded to a third invitation (table 6). Among those who had not responded in the first but had participated in the second round (‘Late Entrants’), 78.0% responded to the third invitation. Of those who had responded in the first but not in the second round (‘Dropouts’), 59.8% responded to the third invitation; 14.6% of those who had not responded to the two previous invitations (‘Consistent Non-Responders’) participated in the third round.
Uptake in the third biennial screening invitation round per subgroup by sociodemographics and other outcomes in percentages with the denominator (n)
Socioeconomic deprivation was associated with lower uptake in all four screening history subgroups in the third invitation round (table 7). Sex differences were not significant among ‘Consistent Screeners’, ‘Late Entrants’ and ‘Dropouts’. Age effects were also not significant in any subgroup. However, among ‘Consistent Non-Responders’, men were more likely than women to respond to a third prevalence screening invitation (13.8% vs 15.3%, OR=1.14, 95% CI 1.04 to 1.24, p<0.01), suggesting that repeated biennial prevalence screening invitations reduce sex inequalities in screening uptake. Additionally, older age was negatively associated with uptake among ‘Consistent Non-Responders’ (64–65: 15.3%, ref; 66–67: 14.1%, OR=0.91, 95% CI 0.83 to 1.00, p<0.05; 68+: 12.6%, OR=1.18, 95% CI 0.67 to 0.96, p<0.05). In conjunction with the positive effect of age on uptake among ‘Previous Non-Responders’ in the second invitation round, these findings imply a non-linear effect of age on prevalence screening uptake.
Multivariable logistic regression results of gFOB uptake in the third biennial screening invitation round per subgroup
Inadequate gFOB screening
The vast majority of participants were required to return only one test kit in order to reach a definitive test result. This proportion was slightly lower in the second (94.6%, p<0.001) and third (94.1%, p<0.001) biennial invitation round than in the first round (96.0%; table 2). Inadequate screening was rare (∼0.4%) and its occurrence did not differ significantly between the rounds.
Multivariable logistic regression analysis showed that socioeconomic deprivation was the only significant sociodemographic predictor of inadequate screening in the first invitation round (OR=1.03, 95% CI 1.02 to 1.05, p<0.001; table 8). This corresponded to 0.2% in the most affluent quintile being inadequately screened compared with 0.8% of those in the most deprived quintile (figures not shown in table). Multivariable logistic regression results for the second and third rounds were similar to those for the first round.
Multivariable logistic regression results of inadequate gFOB screening
Within the second invitation round, ‘Previous Responders’ were more likely to reach a definitive test result with only one test kit than ‘Previous Non-Responders’ (94.9% vs 92.5%, p<0.001; table 4). Inadequate screening was much higher among ‘Previous Non-Responders’ than ‘Previous Responders’ (1.3% vs 0.2%; OR=6.02, 95% CI 4.25 to 8.52, p<0.001; tables 4 and 8).
In the third invitation round, definitive test results from just one test kit were more likely among ‘Consistent Screeners’ (94.7%) than ‘Late Entrants’ (93.5%, p<0.01), ‘Dropouts’ (92.1%, p<0.001) and ‘Consistent Non-Responders’ (90.7%, p<0.001; table 6). Inadequate screening was more common among ‘Late Entrants’ (0.5%; OR=2.86, 95% CI 1.64 to 4.96, p<0.001), ‘Dropouts’ (0.7%; OR=4.38, 95% CI 2.52 to 7.60, p<0.001) and ‘Consistent Non-Responders’ (2.2%; OR=13.45, 95% CI 8.97 to 20.19, p<0.001) than among ‘Consistent Screeners’ (0.2%; ref.; tables 6 and 8). ‘Consistent Non-Responders’ (2.2%) were by far the group most at-risk of inadequate screening, as they were also significantly more likely to be inadequately screened than ‘Late Entrants’ (0.5%, p<0.001) and ‘Dropouts’ (0.7%, p<0.001).
Test positivity
Test positivity was 1.2% in the first, 1.7% (p<0.001) in the second, and 1.9% (p<0.001) in the third biennial invitation rounds (table 2). Within the second round, ‘Previous Responders’ (1.5%) were less likely to test positive than ‘Previous Non-Responders’ (2.6%, p<0.001; table 4). In the third round, ‘Consistent Screeners’ (1.7%) were less likely to test positive than ‘Late Entrants’ (2.4%, p<0.01), ‘Dropouts’ (2.4%, p<0.01) and ‘Consistent Non-Responders’ (3.3%, p<0.001; table 6).
Follow-up compliance
Compliance with follow-up examinations (colonoscopy or an alternative test) was 88.9% in the first, 88.9% in the second, and 87.5% in the third biennial invitation rounds; differences in compliance between rounds were not statistically significant (table 2).
Follow-up compliance in the second invitation round was not predicted by sex, socioeconomic deprivation, age or screening history (table 9). In the third round, screening history was the only significant predictor of follow-up compliance. ‘Dropouts’ (80.0%; OR=0.44, 95% CI 0.22 to 0.89, p<0.05) and ‘Consistent Non-Responders’ (79.8%, OR=0.43, 95% CI 0.23 to 0.81, p<0.01) were less likely to comply with follow-up than ‘Consistent Screeners’ (89.9%, ref; tables 6 and 9).
Multivariable logistic regression results of follow-up compliance
Diagnostic outcomes
CRC was detected among 10.9% of individuals who had undergone a follow-up examination in the first round, 8.4% in the second (ns.), and 7.1% the third (p<0.05) biennial invitation round (table 2). Detection of high-risk and intermediate-risk adenomas decreased from the first (34.1%), to the second (27.3%, p<0.05) and third (22.2%, p<0.001) rounds. By contrast, the proportion of other abnormal findings increased from the first round (8.2%) to the second (15.4%, p<0.01) and third (32.0%, p<0.001) rounds. The proportion of low-risk adenomas detected was similar (range: 16.3%–18.5%) across the three rounds.
In the second invitation round, there were no significant differences in most diagnostic outcomes between ‘Previous Responders’ and ‘Previous Non-Responders’ (table 4). A marginal exception were the other abnormal findings, which were more common among ‘Previous Non-Responders’ (22.7%) than among ‘Previous Responders’ (13.2%, p<0.05). Few significant differences in diagnostic outcomes were observed between screening history subgroups in the third round (table 6). The cancer detection rate was significantly higher among ‘Consistent Non-Responders’ (11.1%) than ‘Late Entrants’ (2.5%, p<0.05). Other abnormal findings were also detected more frequently among ‘Consistent Screeners’ (33.6%) than ‘Dropouts’ (18.8%, p<0.05). However, no firm conclusions should be drawn from these results as the sample sizes in screening history subgroups were often very small.
Discussion
Overall gFOB uptake in the NHS BCSP Southern Hub of subjects aged 60–64 years at the time of first invitation was 57.4% in the first, 60.9% in the second, and 66.2% in the third biennial invitation rounds. While these figures show increasing uptake among the cohort of subjects first invited between September 2006 and February 2008, this should not be interpreted as evidence of a general trend towards higher uptake in the overall population.
Previous uptake was strongly associated with subsequent uptake in the second and third invitation round. Uptake in the first invitation round was strongly predictive of subsequent uptake in the second round (‘Previous Responders’: 86.6% vs ‘Previous Non-Responders’: 23.1%). In the third round, uptake was highest among ‘Consistent Screeners’ (94.5%), followed by ‘Late Entrants’ (78.0%) and ‘Dropouts’ (59.8%), and lowest among ‘Consistent Non-Responders’ (14.6%). Socioeconomic inequalities remained consistent over the three invitation rounds. Sex inequalities decreased over time because previously non-responder males were more likely to respond to a second or third prevalence screening invitation than their female counterparts. Age differences in uptake were minimal across the three rounds.
These findings confirm screening history as a major predictor of subsequent response to screening invitations.5 The results also show that ‘dropouts’ in the second invitation round following participation in the first round is associated with lower subsequent uptake in the third round than ‘late entry’ in the second round following non-response in the first round. This suggests that the first experience with screening is pivotal to continued participation in the screening programme. There is, thus, potential for behavioural and health service interventions to promote repeat CRC screening by improving the experience at the time of the first invitation.
Consistent with previous findings,7 ,8 this study highlights the significance of ‘Dropouts’ and ‘Late Entrants’ in the screening programme, as only 44.4% of the initial sample responded to all three biennial screening invitations. Consistent participation in gFOB screening is necessary because cancers and adenomas can bleed intermittently.12 The best quality studies indicate that sensitivity of gFOB tests is only 30–34% for cancer and 11–19% for adenomas.13 Recent evidence suggests that non-responders have more advanced cancer staging at diagnosis than those who have participated in screening.7 ‘Consistent Screeners’ are also more likely to be diagnosed with a screen-detected cancer than those who participate irregularly.
The present study also confirmed that the majority of people invited to participate in CRC screening will eventually accept the offer.7 ,8 Consistent with previous NHS pilot studies, the results confirm that repeated invitations to biennial CRC screening are clinically important. The proportion of previous non-responders accepting a second or third prevalence screening invitation was even higher in our sample (23% and 15%, respectively) than in the Scottish (15% and 12%) and English (14% and 10%) pilot programmes.5 ,6
The frequently cited CRC screening uptake figures, therefore, depict a misleading picture of low enthusiasm for CRC screening in England. Publicity that focuses on low uptake might convey the message that non-participation in CRC screening is ‘normal’. Social norms research has shown that people are more likely to engage with health and environmentally desirable behaviours if they believe many other people are engaged with them as well.14–16 Communicating cumulative uptake in public health messages might prove more efficacious at increasing population-based screening than emphasising low uptake rates. The results also have implications for the planned introduction of a one-off flexible-sigmoidoscopy (FS) screen at age 55 years. Repeat invitations over a longer time interval could prove a valuable and practical strategy to boost uptake, in addition to reminders shortly after the first invitation.
Repeated biennial invitations are also shown to reduce sex inequalities in prevalence screening uptake. Further research should examine if this is due to men reaching retirement age. Unlike previous studies showing a simple positive effect of age on uptake,5 this analysis suggests prevalence screening uptake is lower for younger invitees, peaks around the middle of the screen-eligible age range (ie, age 64–66 years) and slightly decreases again with older age. By contrast with sex inequalities, socioeconomic inequalities persisted despite repeated invitations to screening. Socioeconomic inequalities in uptake were less stark than in the whole of England, likely reflecting the relative affluence of the Southern Hub's population.4 Considering that socioeconomic inequalities persist even in this relatively affluent area, it is likely that repeat invitations in and of themselves will not redress these health inequalities.
The present study shows that only a minority of subjects failed to complete further test kits after an invitation for a repeat gFOB test following a weak positive, spoilt test kit or a technical failure. However, inadequate screening was more common among those who had previously not (consistently) participated in screening, and among subjects from socioeconomically deprived areas. The negative impact of multiple kit testing on uptake in ‘hard-to-reach’ groups is important given the planned NHS assessment of Faecal Immunochemical Tests for haemoglobin (FIT), a test which typically uses a single stool sample. Higher overall uptake might confer greater overall benefit of FIT over gFOB testing. Recent figures from a population-based screening programme in The Netherlands using FIT showed higher overall uptake (61–65%) per invitation round.17
Overall, compliance with follow-up examinations (usually colonoscopy) was high and showed no significant sociodemographic differences. Previous research has also shown that sociodemographic differences in colonoscopy uptake are relatively small.18 However, this study demonstrated that an irregular gFOB screening history was associated with lower compliance with follow-up. Discrepancies in health outcomes between regular and irregular screening participants are, therefore, due to lower uptake at the stage of the gFOB test as well as lower compliance with recommended follow-up.
Test positivity increased from 1.2% in the first to 1.7% in the second, and 1.9% in the third biennial invitation round. Higher positivity could be partly attributed to the slightly older age of the cohort in the second and third rounds, and is similar to the figures from the Scottish pilot programme which suggests that the effect of age on uptake is around ∼0.4% between 60–64year-olds and 65–69-year-olds. Test positivity in the second and third rounds was higher (∼0.6–1.5%) among individuals who had declined at least one screening invitation than among those who had accepted all invitations. This is consistent with previously reported higher positivity among males and deprived groups who are over-represented in these ‘hard-to-reach’ groups.19 By contrast with this observation, cancer and high-risk and intermediate-risk adenoma detection rates among subjects who had undergone follow-up investigations decreased (slightly) across the three invitation rounds. Screening history was not consistently associated with diagnostic outcomes. In conjunction with the higher positivity rates among those who have declined at least one screening invitation, this indicates the possibility that irregular responders are more likely to be diagnosed with cancer in any given invitation round than those who are consistently screened. However, the sample size in the present study does not allow for firm conclusions to be drawn.
Interestingly, the proportion of ‘other abnormal findings’ (ie, non-cancer-related abnormalities, eg, Crohn’s disease, ulcerative colitis and diverticulitis) resulting from follow-up investigations, increased over the three biennial invitation rounds. The specific nature of these findings and the role that bowel symptoms might play in screening uptake, merits further investigation in a larger scale, national studies which can compare irregular responders with consistent responders and contrast subgroups of irregular responders. It also raises the question of whether the CRC screening programme should serve as a route to diagnosis of bowel abnormalities other than cancer, and if so, how this should be harmonised with other NHS services.
In conclusion, the present study shows that screening history is associated with participation in all stages of the CRC screening process, from overall gFOB screening uptake and inadequate gFOB screening to compliance with follow-up investigations. The first screening experience seems to play a pivotal role in influencing and, therefore, predicting incidence screening uptake, as ‘Dropout’ in the second biennial invitation round following a prevalence screen was associated with lower uptake in the third round than delayed prevalence screening in the second round. The results also show that repeated biennial screening invitations increase overall uptake and reduce sex inequalities. By contrast, socioeconomic deprivation was independently associated with low gFOB uptake and inadequate screening in all three invitation rounds. Further research on strategies to engage non-responders and irregular responders might help promote regular screening and reduce socioeconomic inequalities in uptake, thus maximising the protection provided by an organised screening programme.
References
Footnotes
-
Contributions CVW, SL and JW conceived of the study. SL and CVW carried out the analyses and wrote the first draft of the paper. All the authors contributed to the final version of the manuscript.
-
Funding This study was supported by a programme grant from Cancer Research UK to JW (C1418/A14134). HS was supported by the GUTS Charity (Guildford Undetected Tumour Screening).
-
Competing interests None.
-
Ethics approval We did not seek ethical approval as this study was an evaluation of routinely delivered services within the NHS Bowel Cancer Screening Programme using routinely collected data, with all personal identifiable information removed prior to analysis.
-
Provenance and peer review Not commissioned; externally peer reviewed.