Article Text

Abstract
Objective A comprehensive analysis of the immune landscape of pancreatic neuroendocrine tumours (PanNETs) was performed according to clinicopathological parameters and previously defined molecular subtypes to identify potential therapeutic vulnerabilities in this disease.
Design Differential expression analysis of 600 immune-related genes was performed on 207 PanNET samples, comprising a training cohort (n=72) and two validation cohorts (n=135) from multiple transcriptome profiling platforms. Different immune-related and subtype-related phenotypes, cell types and pathways were investigated using different in silico methods and were further validated using spatial multiplex immunofluorescence.
Results The study identified an immune signature of 132 genes segregating PanNETs (n=207) according to four previously defined molecular subtypes: metastasis-like primary (MLP)-1 and MLP-2, insulinoma-like and intermediate. The MLP-1 subtype (26%–31% samples across three cohorts) was strongly associated with elevated levels of immune-related genes, poor prognosis and a cascade of tumour evolutionary events: larger hypoxic and necroptotic tumours leading to increased damage-associated molecular patterns (viral mimicry), stimulator of interferon gene pathway, T cell-inflamed genes, immune checkpoint targets, and T cell-mediated and M1 macrophage-mediated immune escape mechanisms. Multiplex spatial profiling validated significantly increased macrophages in the MLP-1 subtype.
Conclusion This study provides novel data on the immune microenvironment of PanNETs and identifies MLP-1 subtype as an immune-high phenotype featuring a broad and robust activation of immune-related genes. This study, with further refinement, paves the way for future precision immunotherapy studies in PanNETs to potentially select a subset of MLP-1 patients who may be more likely to respond.
- neuroendocrine tumors
- pancreatic cancer
- immune response
- immunotherapy
- macrophages
Data availability statement
All data relevant to the study are included in the article or uploaded as supplementary information. Data are available in GEO Omnibus (GEO Omnibus with IDs GSE73338 and GSE73339): (1) the data include transcriptome profiles from patient samples; (2) GEO Omnibus is the repository; and (3) there are no reuse conditions. We have included the information and GEO Omnibus IDs in the Materials and methods and supplemental information.
This is an open access article distributed in accordance with the Creative Commons Attribution Non Commercial (CC BY-NC 4.0) license, which permits others to distribute, remix, adapt, build upon this work non-commercially, and license their derivative works on different terms, provided the original work is properly cited, appropriate credit is given, any changes made indicated, and the use is non-commercial. See: http://creativecommons.org/licenses/by-nc/4.0/.
Statistics from Altmetric.com
Significance of this study
What is already known on this subject?
Very little is known about the immune landscape of pancreatic neuroendocrine tumours (PanNETs). Early data from a small number of patients in immune checkpoint inhibitor trials have demonstrated some clinical activity in PanNET. However, no subgroup of patients has been identified that is more likely to respond.
What are the new findings?
The current study demonstrates differential immune-related gene expression in PanNETs and identified a molecular subtype, metastasis-like primary (MLP)-1, with enriched immune gene expression profiles (GEPs). Our data suggest this enrichment is related to MLP-1 subtype characteristics (poor prognosis and increased tumour size) and GEPs associated with increased hypoxia, necroptosis, viral mimicry and stimulator of interferon gene pathway, resulting in activation of immune suppressive microenvironment via the damage-associated molecular pattern pathway.
Significance of this study
How might it impact on clinical practice in the foreseeable future?
This study provides novel data regarding the immune microenvironment of PanNETs with potential therapeutic implications. The MLP-1 PanNET subtype identifies tumours with enriched immune suppressive GEPs. This study poses the basis for potential clinical trials according to PanNET molecular subtypes to aid the development of precision immunotherapy in this rare disease.
Background
Pancreatic neuroendocrine tumours (PanNETs) are rare tumours with widely varying clinical behaviours. Five-year survival ranges from 60% to 100% for the localised disease to 25% for metastatic disease.1 The WHO classifies PanNETs into three grades, with grade 3 disease having the worst prognosis.2 Treatment decisions are based on the grade and stage of the disease. However, due to significant heterogeneity in disease behaviour, particularly within grade 2 tumours, such distinctions are insufficient and novel approaches are required to provide more precise clinical management.
In recent years, there have been significant advances in our understanding of the molecular features of PanNETs.3–8 Four transcriptomic (gene and microRNA) PanNET subtypes were previously defined: metastasis-like primary (MLP)-1 (28%) and MLP-2 (15%), insulinoma-like (22%) and intermediate (35%).3 These were confirmed by next-generation transcriptomic sequencing analysis.4
Despite our improved understanding of the molecular nature of PanNETs,3–8 novel therapeutic approaches for patients remain elusive. One prominent area for exploration is immunotherapy, and multiple trials of immune checkpoint blockade are under way.9–14 However, these studies reported only modest to low clinical benefit of anti-PDL1 agents thus far.
Moreover, little is known about the immune landscape of PanNETs to date. The majority of studies have been small and retrospective, considering few biomarkers.15 16 Therefore, it is still impossible to identify patients with PanNET who may benefit from immunotherapy. Thus, in this study, we performed detailed profiling of immune genes to understand the landscape of immune cell types in PanNETs and its potential to aid immunotherapy choices. We analysed immune-related gene expression in PanNET samples according to clinical parameters, gene mutations, tumour stage and the previously described four molecular subtypes.3 As the PanNET MLP subtypes were already shown to be transcriptionally enriched in hypoxia-related genes,3 4 we also investigated the role of hypoxia/necroptosis-induced viral mimicry via damage-associated molecular pattern (DAMP) and stimulator of interferon gene (STING) pathways in inducing an enhanced immune-related gene expression. We further validated the enrichment of particular immune cell types in a subset of MLP subtype samples using multiplex immunofluorescence.
Materials and methods
PanNET patient samples and gene expression molecular subtypes
The sample set (n=207) consisted of three cohorts: one training and two validation cohorts (figure 1A). The training cohort (with subtype information) was our published gene expression microarray (18.5 K human oligo microarrays) dataset of 72 PanNETs (GSE73338) data,17 which was also used to develop the PanNET molecular subtypes.3 Tumour grade, gene mutations (MEN1, DAXX/ATRX and MTOR pathway genes), tumour volume and survival information for the training cohort were available. Validation cohort-1 of 109 PanNET patient samples were collected from Verona University Hospital (see Ethical approval Statement). Validation cohort 2 was a gene expression microarray (Affymetrix Human Gene V.1.0 ST Array) dataset of 26 PanNETs with molecular subtypes already published by us.3
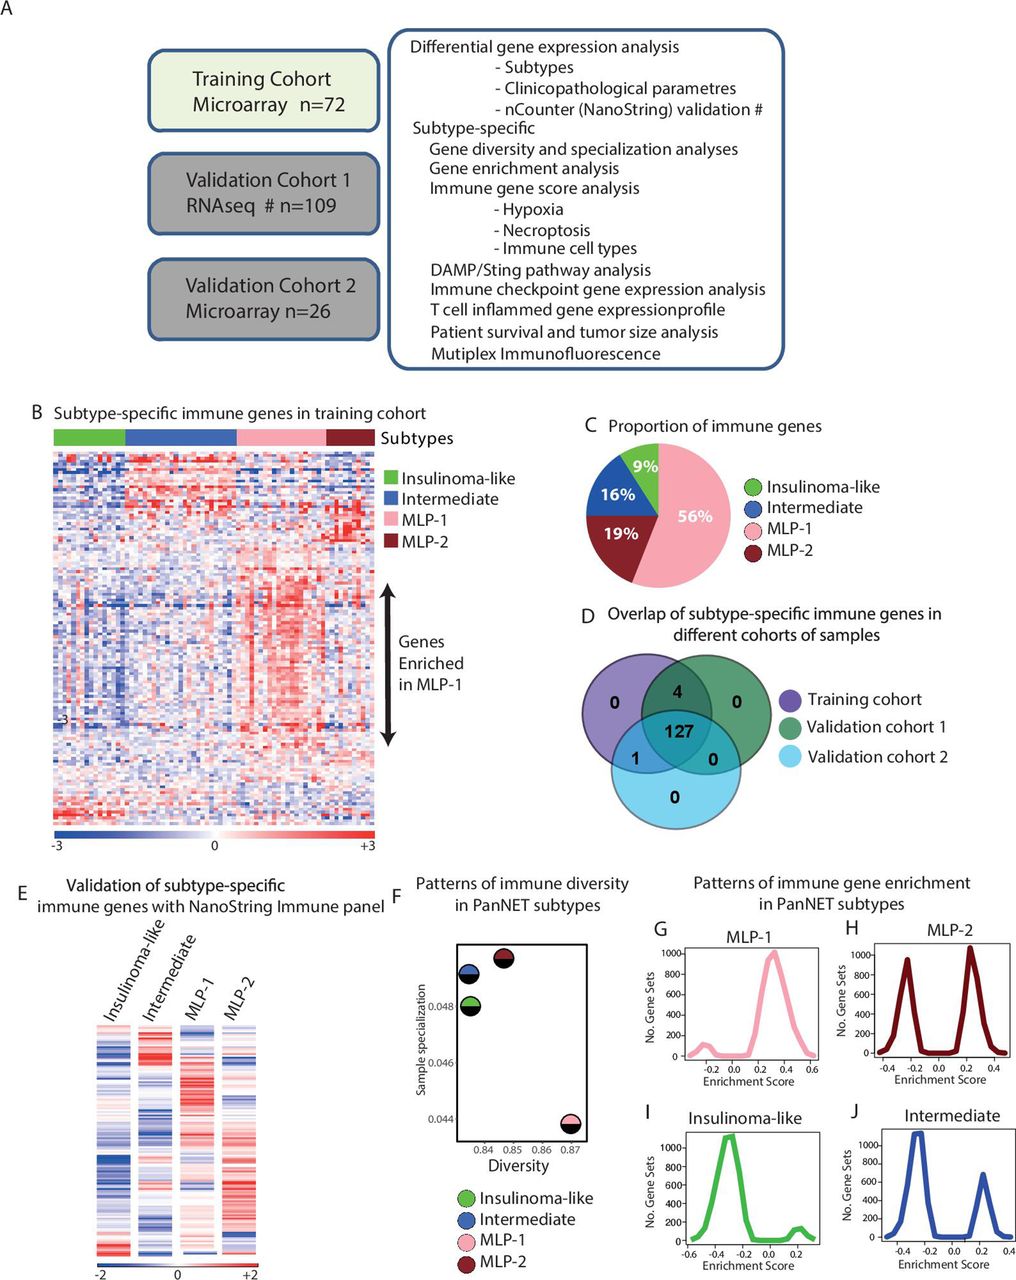
Differential immune gene expression and diversity associated with PanNET subtypes. (A) Schematic showing the complete cohort of 207 PanNET samples, platforms and computational approaches used in this study. The validation cohort 1 was profiled by RNAseq, and the training and the validation cohort 2 was profiled using microarrays. Samples for verification of subtype-specific immune genes were selected from validation cohort 1 and profiled using nCounter platform from NanoString Technologies. (B) Heatmap of 132 differentially expressed immune-related genes according to PanNET molecular subtypes (SAM, FDR<0.05). Top bar indicates subtypes. In the rainbow bar below the heatmap, red indicates elevated expression; blue indicates decreased expression; and white indicates no change. (C) Proportions of differentially expressed 132 immune-related genes in each PanNET molecular subtype. (D) Overlap of the 132 differentially expressed immune-related genes in PanNET subtypes between the training cohort and validation cohorts 1 and 2. (E) Heatmap showing the mean expression of the 132 immune-related genes according to PanNET subtype as detected by nCounter PanCancer immune profiling panel of genes from NanoString technologies in 38 samples selected from training cohort and validation cohort 1. (F) Shannon entropy analysis shows the measured diversity and sample specialisation of gene expression in each PanNET subtype. (G,J) GSEA analysis of the training cohort’s whole gene expression profiles against the C7-immunogenic gene sets from MSigDB database,25 performed according to PanNET subtypes: (G) MLP-1, (H) MLP-2, (I) insulinoma-like and (J) intermediate. DAMP, damage-associated molecular pattern; FDR, false discovery rate; GSEA, gene set enrichment analysis; MLP, metastasis-like primary; PanNET, pancreatic neuroendocrine tumour; RNAseq, RNA sequencing; SAM, significance analysis of microarrays.
RNA sequencing (RNAseq) was performed on validation cohort 1 using fresh frozen PanNET samples as described in online supplemental methods. PanNET molecular subtypes for validation cohort 1 was defined using non-negative matrix factorisation-based unsupervised clustering of 221 subtype-specific genes, as described previously3 (additional details in online supplemental methods).
Supplemental material
Significance analysis of microarrays (SAM)
SAM (supervised analysis) was used to identify differentially expressed immune-related genes between four PanNET subtypes in the training cohort. Six hundred immune-related genes (from 730 immune genes from NanoString Technologies’ curated list) were selected as input from the training cohort. When more than one probe represented a gene, the highest variable probe was selected for that gene. For SAM, false discovery rate (FDR) was set to <0.05 and false calls to <1 as described.3 18 19 The list of significant genes from the training cohort was validated by applying SAM to the four PanNET subtypes in the two validation cohorts.
Shannon entropy plots of diversity versus specialisation
Shannon entropy analysis was performed on the training cohort to measure diversity and sample specialisation of gene expression for each sample as previously described.20 Diversity and specialisation values were normalised between 0 and 1 as recommended in the R-based Bioconductor package BioQC.21 The average diversity and sample specialisation values for each subtype were then calculated.
Immune cell type genes
Expression of genes associated with various cell types across the innate and adaptive immune systems was analysed for all PanNET subtypes using a set of transcriptomic markers comprising cell types from Rooney et al.22
Probabilistic principal component analysis with covariates
A full description of the PPCCA method implemented in the exploBATCH tool is provided in online supplemental method. The PPCCA method23 24 was used to confirm the association between PanNET subtypes (primary factor), hypoxia (secondary factor) and DAMP gene expression data (subset of genes). The tool is available at https://github.com/syspremed/exploBATCH.
Results
The large cohorts of samples (n=207) and the design of the study, including different methods and analyses, are illustrated in figure 1A. The summary characteristics of the training cohort of 72 PanNETs classified into four subtypes are reported in online supplemental table 1A, those of 109 cases of validation cohort 1 in online supplemental table 1B and those of 26 cases of validation cohort 2 in online supplemental table 1C. The subtypes of validation cohort 1 (RNAseq) samples are in online supplemental table 1D.
Supplemental material
PanNET molecular subtypes have distinct profiles of immune-related gene expression
PanNET molecular subtype-based differentially expressed immune genes were identified using a supervised differential expression analysis of the training cohort (n=72) and 600 immune-related genes, where subtype information was already provided to the statistical method, SAM, to identify differential genes between subtypes as described.3 This analysis identified 132 (22% of 600) differentially expressed genes (FDR<0.05) between the four subtypes (online supplemental table 2A,B, with overview of expression levels shown in figure 1B). MLP-1 subtype was highly enriched for 74 of these 132 immune genes (56%), MLP-2 for 25 (19%) and intermediate for 21 (16%). Insulinoma-like samples had the lowest figure, with only 12 (9%) immune genes (figure 1C).
The differential enrichment of the 132 immune genes in PanNET subtypes detected in the training cohort was validated using two additional cohorts (n=135), profiled using different technologies: validation cohort 1 (n=109, RNA-seq) and validation cohort 2 (n=26, microarrays; figure 1A and online supplemental figures 1A,D). One hundred twenty-seven (96%) of 132 immune genes were found to be differentially expressed across PanNET subtypes in all three cohorts, highlighting the robustness of these genes in discriminating the immune landscape of PanNET subtypes (figure 1D and online supplemental table 2C). Moreover, this was further confirmed by performing the gene expression profiling and data analysis using the nCounter platform (NanoString Technologies) on a subset of 38 cases from validation cohort-1 (figure 1E and online supplemental figure 1E).
Supplemental material
Additionally, we quantified the immune-related gene enrichment in PanNET subtypes of the training cohort by measuring diversity and specialisation of gene expression, using Shannon Entropy statistical analysis20 (figure 1F). Shannon diversity index provides an overall measure of the enrichment and abundance of immune gene expression in each subtype. If a greater number of genes are highly expressed and enriched within a subtype, then the diversity of that subtype will be high and vice versa. In contrast, the Shannon sample specialisation index will be high if a subset of genes—even a small subset—is highly and specifically expressed in a particular subtype, thus representing a characteristic of that subtype. MLP-1 subtype had the highest diversity of immune gene expression (with 56% of the genes highly expressed) and the lowest specialisation. MLP-2 had the second highest diversity but was the most specialised, potentially due to enrichment for metastases3 (online supplemental table 1A). Both insulinoma-like and intermediate subtypes demonstrated lower diversity and high specialisation. The increased specialisation for insulinoma-like subtype was due to the high expression of β cell-related genes (highlighted in online supplemental figure 1F).
To establish whether the high diversity and low specialisation of MLP-1 translated into enhanced immune pathways and network activity, we performed gene set enrichment analysis (GSEA) on the whole gene expression profiles (GEPs) of the training cohort against the gene set ‘C7: immunologic signatures’ from the MSigDB.25 Positive GSEA (enrichment) scores of gene sets were markedly highest in the MLP-1 subtype compared with insulinoma and intermediate subtypes (figure 1G–J), confirming that MLP-1 is enriched in multiple immune pathways. Although MLP-2 showed positive enrichment scores of gene sets similar to MLP-1, there was also a negative enrichment score of gene sets representing that MLP-2, unlike MLP-1, contains a balance between high and low enrichments of immune gene sets.
Current stratification of PanNETs is based on clinicopathological and mutational parameters.1 To check whether PanNET subtype-based immune profiles may provide independent additional information, we performed differential gene expression analysis of the training cohort (n=72)3 17 for the 600 immune-related genes by grouping samples according to clinicopathological parameters and mutations. Analysis according to tumour grade identified only 12 (2%) differentially (FDR<0.05) expressed genes (online supplemental figure 1G and online supplemental table 2D). No association was detected between the expression of specific genes and presence of different mutations (MEN1, DAXX/ATRX or mTOR pathway gene mutations), tumour stage or size (online supplemental figure 1H–K and online supplemental table 2E–I), showing that clinicopathological parameters and immune profiles are independent features.
Enhanced immune-related gene expression in MLP-1 PanNETs is associated with hypoxia and necroptosis
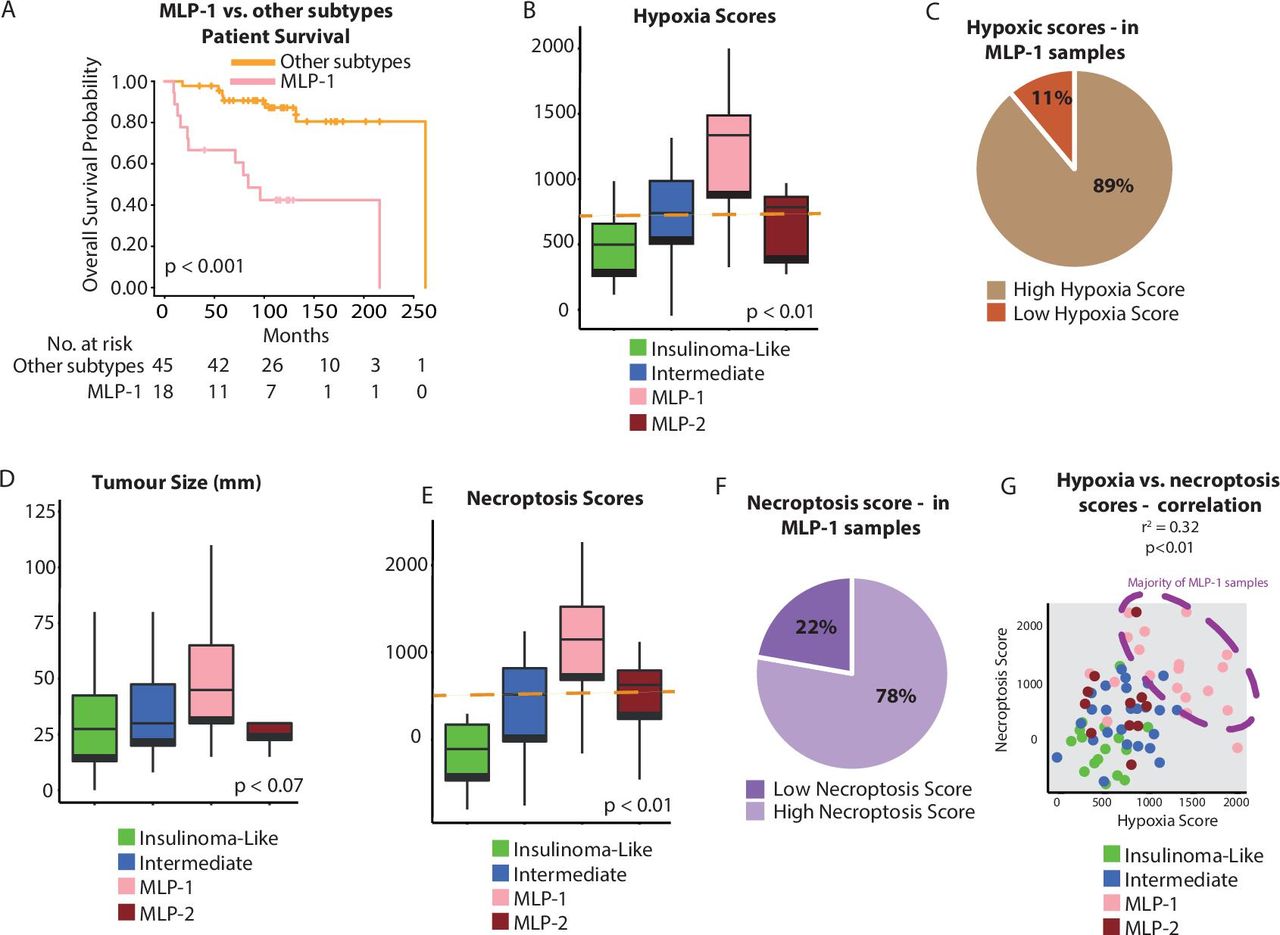
Previously, MLP-1 was described to be less vascularised than other subtypes and enriched for genes associated with hypoxia and Hypoxia-inducible Factors (HIF) signalling.3 4 Here we confirmed that MLP-1, which bears poorer prognosis, featured a higher hypoxia gene score (based on single-sample gene set enrichment analysis (ssGSEA)) and larger tumour size than the other subtypes (figure 2A–D, online supplemental figure 2A,B and online supplemental table 3A–C show hypoxic gene changes in the training cohort; and online supplemental figure 2C,D represents validation cohort 1). This is consistent with the fact that larger tumours are more prone to hypoxia.26
Supplemental material

Association of hypoxia and necroptosis with PanNET molecular subtypes. (A) Overall survival of MLP-1 versus other subtypes. (B) Hypoxia score as determined by ssGSEA using the MSigDB gene set25 across PanNET subtypes of the training cohort. The orange line represents the median score, used as a cut-off to categorise samples into high and low for hypoxia. (C) Proportion of MLP-1 samples with a high (89%) or low (11%) ssGSEA hypoxia score. (D) Tumour size across the PanNET subtypes. (E) Necroptosis score as determined by ssGSEA using the MSigDB gene set25 across PanNET subtypes of the training cohort. The orange line represents the median score, used as a cut-off to categorise samples into high and low for necroptosis. (F) Proportion of MLP-1 samples with a high (78%) or low (22%) necroptosis score. (G) Correlation of hypoxia and necroptosis scores in PanNET samples. Colours illustrate subtypes, and the dashed ellipse highlights samples with concurrent high necroptosis and hypoxia scores. MLP, metastasis-like primary; PanNET, pancreatic neuroendocrine tumour; ssGSEA, single-sample gene set enrichment analysis.
Both hypoxia and immune/inflammatory responses have been associated with necroptosis, a form of programmed cell death.27 28 Therefore, we investigated this association in PanNET subtypes. The MLP-1 subtype was primarily associated with a high (greater than the median value) necroptosis gene score, which in turn showed a trend (p=0.1) towards poorer survival (figure 2E,F and online supplemental table 3A and D for the training cohort; online supplemental figure 2E–H for the training cohort and validation cohort 1). Hypoxia and necroptosis scores were positively correlated (p<0.01, figure 2G). These results suggest a link between hypoxia, necroptosis and the enhanced immune-related gene expression characterising MLP-1 tumours.
Supplemental material
Necroptotic MLP-1 tumours influence immune phenotype through DAMP pathway and viral mimicry
Necroptosis results in an inflammatory phenotype through DAMP, such as cytosolic DNA or double-stranded (ds)RNA, which imitate viral infection and elicit immune responses (viral mimicry).29–32 To investigate this connection in MLP-1, we analysed the expression of 14 key DAMP genes (unbiasedly selected from the entire microarray gene set) in both the training cohort and validation cohort 1 (n=181). Twelve of 14 genes were significantly enriched in the MLP-1 subtype (figure 3A and online supplemental table 4A for the training cohort and online supplemental figure 3A–C for validation cohort 1). Furthermore, 12 of these DAMP genes were positively correlated and significant (p≤0.05) with the necroptosis score (figure 3B and online supplemental figure 3D and online supplemental table 4B). This suggests that the MLP-1 subtype, but not the other subtypes, may be associated with increased DAMP genes via changes in hypoxia and necroptosis.

Association of DAMP pathway with PanNET subtypes, hypoxia and necroptosis. (A) Heatmap of the 12 DAMP pathway genes across the PanNET subtype samples, demonstrating enrichment in the MLP-1 subtype. Red indicates elevated expression; blue indicates decreased expression; and white indicates no change. TRL3, TLR7 and CASP1 (black rectangles) are most significantly enriched in MLP-1 subtype (FDR≤0.0001). Kruskal-Wallis test with correction for multiple testing was used. (B) Correlation (Pearson) of DAMP pathway genes with necroptosis score across all samples. (C) Heatmap of 12 DAMP pathway genes (median expression across samples from each subtype) demonstrating enrichment in the MLP-1 subtype before and after MLP-1 subtype normalisation using PPCCA method. (D) Heatmap of 12 DAMP pathway genes (median expression across samples from each subtype) demonstrating enrichment in the hypoxia high group before and after MLP-1 subtype normalisation using PPCCA method. Red indicates elevated expression; blue indicates decreased expression; and white indicates no change. (C,D) P values represent association analysis using regression-based p values from PPCCA. (E) Kaplan-Meier survival plot and number of patients at risk according to low and high TLR3 expression. Log-rank test p value is reported. (F) Proportion of MLP-1 cases with high (83%) or low (17%) TLR3 expression. (E,F) Median score of TLR3 was used as a cut-off to categorise samples into high and low expressions. (G) DC score as determined by ssGSEA using MSigDB gene set25 across PanNET subtypes. The orange line represents the median ssGSEA score. (H) Correlation (Pearson) of DAMP pathway genes with DC score in the MLP-1 samples of the training cohort. (I) Heatmap showing median expression of genes associated with T-cell functioning, the STING pathway, macrophage/DC functioning and antigen processing/presentation across PanNET subtypes. Red indicates elevated expression; blue indicates decreased expression; and white indicates no change. (J) Top 10 significant enrichment analysis for genes highly expressed in MLP-1 subtype from the training cohort using MSigDB’s25 ‘investigational analysis’ tool and C7 gene sets. DAMP, damage-associated molecular pattern; DC, dendritic cell; FDR, false discovery rate; MLP, metastasis-like primary; PanNET, pancreatic neuroendocrine tumour; PPCCA, probabilistic principal component analysis with covariates; ssGSEA, single-sample gene set enrichment analysis; STING, stimulator of interferon gene.
To further validate if this enrichment of DAMP genes is specific to the MLP-1 subtype and to evaluate if this is linked to hypoxic changes, we performed a machine learning-based statistical association analysis on the training cohort. As this is not possible using simple correlation analysis, we used our published PPCCA method (see Methods section of online supplemental information). This method exploits a combination of principal component and multivariate regression analyses, which was used to model 12 DAMP GEPs as a function of both PanNET subtype (MLP1 vs non-MLP1) and hypoxia (high vs low) and test their mutual association in samples from the training cohort. This analysis showed that the MLP-1 subtype and hypoxia are statistically associated with DAMP gene (n=12) expression profiles (p<0.001; figure 3C, before; online supplemental figure 3E). Thus, PanNET samples and DAMP GEPs were statistically normalised to account for differences between MLP-1 and other subtypes using the same method (p not significant; figure 3C, after). Consequently, the association between DAMP gene expression and hypoxia also lost significance (p>0.05, figure 3D). Overall, DAMP gene expression changes are significantly associated with both MLP-1 subtype and hypoxia gene programme.
Among the DAMP genes, TLR3 (toll-like receptor-3) was the most significantly enriched in MLP-1 (FDR<0.001). High TLR3 expression (greater than the median value) was associated with poorer overall survival and featured in 83% of MLP-1 samples (figure 3E,F, online supplemental figure 3F and online supplemental table 4C). This receptor is expressed by dendritic cells (DCs) which are antigen-presenting cells that activate T cell-based adaptive immune response.33 34 Accordingly, the MLP-1 subtype was also found to be enriched for genes related to DCs with high DC score, which was also positively correlated with most of the DAMP genes (p<=0.05 for 9 of 12 genes) (figure 3G,H and online supplemental figure 3G and online supplemental table 3A). These results suggest that DAMP via TLR3 may affect immune-related gene expression and immune escape in the MLP-1 subtype.
MLP-1 subtype is enriched for T cell-mediated adaptive immunity and monocytes
Investigation on the function of the 74 MLP-1-specific immune genes (figure 1B and online supplemental table 4D) showed 19 genes (figure 3I) that coded for proteins that play a major role in T-cell functioning and immune checkpoints (including CD274/PD-L1, PDCD1LG2/PD-L2 and LAG3) and interferon signalling/STING pathway (IFNAR1, IFIT2, IFI16, SPP1, IL18 and ISG15). The second group of genes coding for proteins are important in macrophage/monocyte and DC functioning (CCRL2, TREM1/2, ANXA1 and MSR1) and antigen processing and presentation (PSMB8, PSMB10, PSMB9, HLA-DPA1 and CTSS). Other toll-like receptors that are involved in monocyte functioning in MLP-1 are also listed in online supplemental table 4D. We formally confirmed these observations by using enrichment analysis to identify overlaps between genes with increased expression in the MLP-1 subtype and the C7: immunologic signatures MSigDB gene sets. Among the top 100 gene sets with FDR<0.01, >75% were involved in Tcell functioning, myeloid cell functioning or interferon signalling (online supplemental table 4E and the top 10 significant gene sets are shown in figure 3J).
In addition, we assessed PanNET subtypes for the enrichment of immune cell types using the specific gene sets published by Rooney et al.22 Differential expression analysis showed that 14 of the 80 genes from Rooney et al had increased expression (fold change ≥1.5, FDR<0.05) in the MLP-1 subtype compared with the other PanNET subtypes in the training cohort (figure 4A,B and online supplemental table 5A). These included T-cell and macrophage-specific genes mainly involved in adaptive immunity. Accordingly, ssGSEA35 analysis for the immune cell type-specific genes sets confirmed the significant (FDR<0.05) enrichment of MLP-1 subtype for coinhibition of T cells, MHC class I and macrophages (figure 4C–E and online supplemental table 5B). We obtained similar results in the two validation cohorts (online supplemental figure 4A–F and online supplemental table 5D–E). Furthermore, there was an increase in M1 macrophage (proinflammatory)-specific gene expression in the MLP-1 subtype and a reduction in M2 macrophage (anti-inflammatory) genes (figure 4F,G and online supplemental table 5C). These results suggest the costimulation of T cells through M1 macrophages in the MLP-1 subtype. Overall, these data suggest that the MLP-1 subtype features immune modulation via T cells, M1 macrophages and the DAMP pathway, resulting primarily in an immune suppressive gene expression phenotype.
Supplemental material

Immune cell type landscape in PanNET subtypes. (A) Differential expression of immune cell type-specific genes in MLP-1 versus other subtypes. FDR values were computed on the training cohort based on t-test. Pink dots highlight 14 overexpressed genes in MLP-1 subtype (fold change≥1, FDR<0.05). (B) Heatmap of the 14 overexpressed immune cell type-specific genes across the four PanNET subtypes. Genes with a fold change >2 are highlighted (*). The immune cell types associated with the specific genes are displayed on the right. Top bar represents PanNET subtypes. In the rainbow bar below the heatmap, red indicates elevated expression; blue indicates decreased; and white indicates no change. (C–E) Enrichment scores (ssGSEA) of immune cell type-specific gene sets, namely,(C) macrophages, (D) coinhibition T cells,and (E) MHC class I across PanNET subtypes (FDR<0.05 based on Kruskal-Wallis test). (F,G) Heatmaps showing median expression of genes associated with (F) M1 and (G) M2 macrophages across PanNET subtypes in the training cohort. Red indicates elevated expression; green indicates decreased expression; and black indicates no change. FDR, false discovery rate; IFN, interferon; MHC, major histocompatibility complex; MLP, metastasis-like primary; PanNET, pancreatic neuroendocrine tumour; ssGSEA, single-sample gene set enrichment analysis.
Multiplex spatial immune profiling validates immune changes in subtypes
To validate the patterns of immune-related gene expression demonstrated in the PanNET subtypes, we performed multiplex immunofluorescence using available samples and gene expression data (n=28, no insulinoma-like samples). The number of cells positive for CD68 (macrophage marker), CD8 (cytotoxic T cell marker), FOXP3 (T-regulatory cell marker) and CD20 (B cell marker), per megapixel of tumour tissue, were counted (figure 5A).

Multiplex immunofluorescence validates cell type differences across PanNET subtypes. (A) Representative multiple immunofluorescence images demonstrating protein expression of CD68 (macrophages), FOXP3 (Tregs), CD8 (cytotoxic T cells), CD20 (B cells) and pan-CK (cancer cells) in MLP-1 (left) and intermediate (right) samples. Nuclei are stained with DAPI. Bars represent ×20 magnification. (B) The median score of CD68 immunofluorescence staining (cell type/megapixel) computed from multiple regions of multiple slides for 30 PanNET samples and plotted for subtypes. (C) Gene expression levels of CD68 across PanNET subtypes in validation cohort 1. CK, cytokeratin; DAPI, 4′,6-diamidino-2-phenylindole; FDR computed by Kruskal-Wallis test after multiple testing corrections. FDR, false discovery rate; MLP, metastasis-like primary; Treg, T-regulatory cell.
The MLP-1 subtype demonstrated a higher count of CD68 positive cells compared with Intermediate and MLP-2 subtypes (FDR<0.05) (figure 5B), consistent with increased expression of CD68 gene in MLP-1 subtype in validation cohort-1 (figure 5C). There was no significant difference in CD8 or FOXP3 staining across the three subtypes in keeping with the lack of specific enrichment in gene expression data (online supplemental table 6). These immunofluorescence spatial and protein expression findings are consistent with gene expression data.
Potential immunotherapeutic opportunities using patients with PanNET with MLP-1 subtype
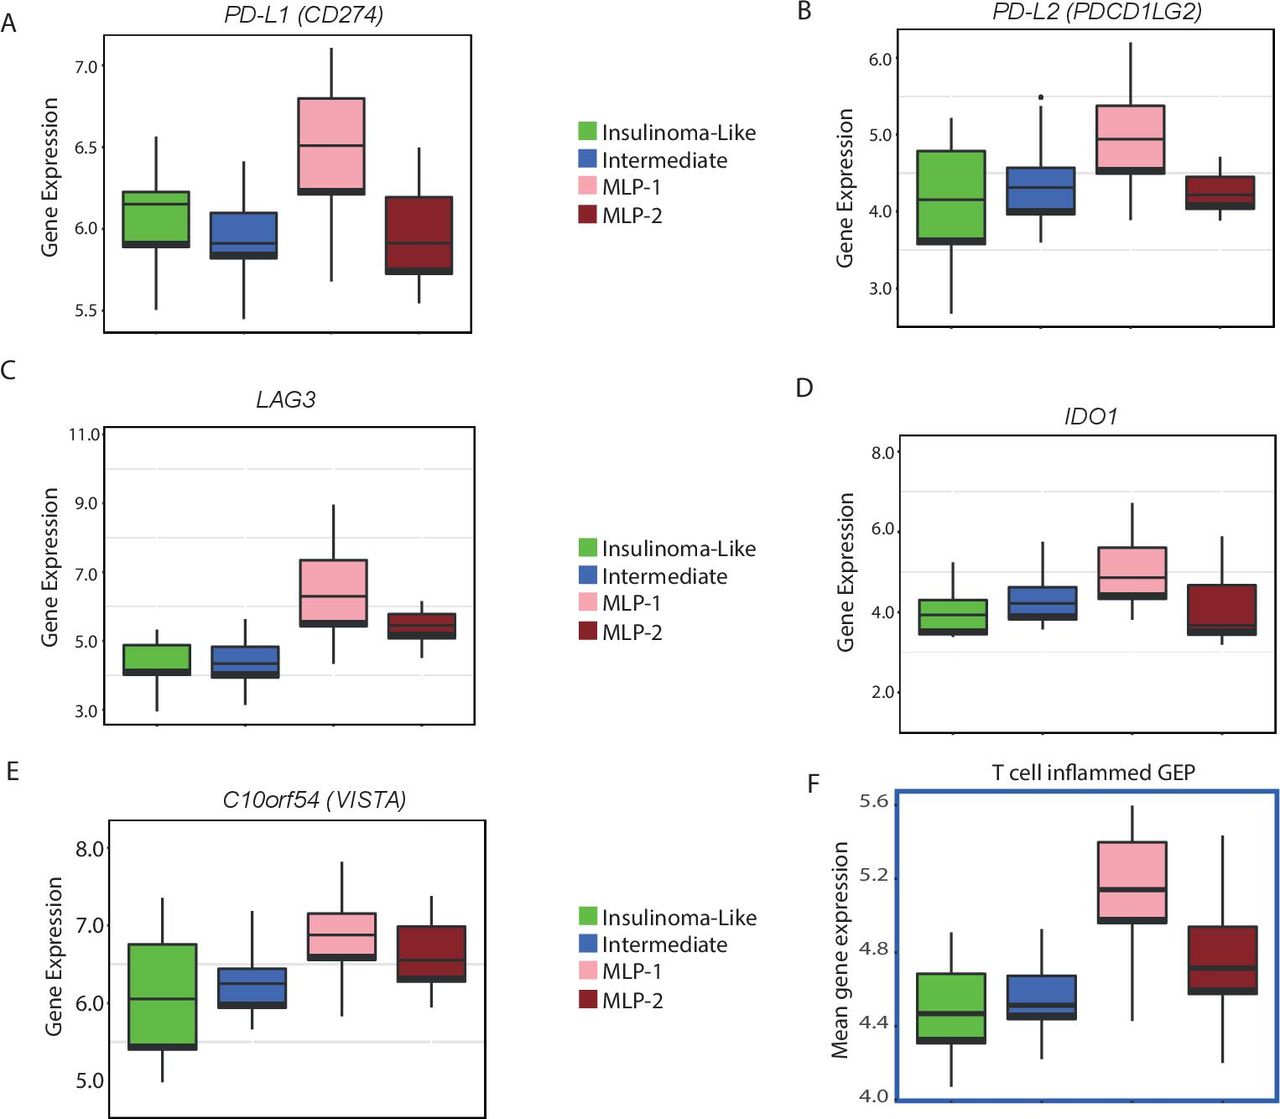
To assess the potential immunotherapeutic significance of the MLP-1 subtype, we verified the expression of known and potential immunotherapy targets across the PanNET subtypes, including PD-L1 expression, which has already been used as an inclusion criterion for immunotherapy clinical trials in PanNETs.10 PD-L1 (CD274) and PD-L2 were significantly (FDR<0.2) highly expressed in MLP-1 (figure 6A,B). Additional inhibitory immune checkpoints, which resulted to be enriched in the MLP-1 subtype, included LAG3, IDO1, and C10orf54 (V-domain Ig suppressor of T-cell activation, figure 6C–E).

Key immunotherapy target genes overexpressed in the MLP-1 subtype. (A–E) Expression (log2) levels of inhibitory checkpoint (PDL1, PD-L2, LAG3, IDO1 and C10orf54) genes in the training cohort. (F). T cell-inflamed GEP (to predict potential response to anti-PD1 treatment) for the training cohort. Expression (mean) data for 14 of the 18 relevant genes were available. FDR (after multiple testing correction) or p value computed by Kruskal-Wallis test. FDR, false discovery rate; GEP, gene expression profile; MLP, metastasis-like primary.
The T cell-inflamed GEP is a set of 18 genes whose enrichment has been reported to predict response to PD-1 blockade in several tumour types.36 We thus analysed this as a signature (T-cell GEP) score, and there were increased scores in MLP-1 versus the other subtypes in all the three cohorts (figure 6F and online supplemental figure 4G,H).
To further validate these results, we compared our data to melanoma, where immune therapy is known to be successful. We used a publicly available dataset—GSE1560537—and combined the two datasets after batch correcting the differences between profiling platforms. There was a significantly high expression of PDL-1 and PDL-2 genes and T-cell GEP scores in metastatic melanoma compared with primary melanoma and normal skin. Similarly, there was a significant increase in the expression of these genes in MLP-1 compared with the other subtypes of PanNET. Thus, PDL1, PDL2 and T-cell GEP scores in the MLP-1 subtype were similar to metastatic and primary melanoma samples (online supplemental figure 5A–C).
Supplemental material
Discussion
To our knowledge, this report describes, for the first time, the global immune-related gene expression of PanNETs in one of the largest sets of patients. Four molecular PanNET subtypes based on gene expression had previously been defined: MLP-1, MLP-2, insulinoma-like and intermediate.3 These subtypes were used as a starting point to explore immune-related gene expression.
Our results, consistent in both the training cohort (n=72) and two validation cohorts (n=135), can be summarised as follows: (1) the four PanNET molecular subtypes3 identified groups of tumours with different immune gene expression, and ~20% of cases exhibited the MLP-1 subtype, which featured the highest and more diverse immune-related gene expression; (2) PanNETs clinical parameters, including grade, tumour stage and size, or specific genetic mutations, did not associate with immune gene expression, suggesting that molecular subtype-based immune profiles may provide independent and additional information; (3) the MLP-1 phenotype (demonstrated robustly using the machine learning approach) featured a close association between its known hypoxic phenotype,3 4 necroptosis and signalling through DAMP and the STING pathway, promoting an immune enhanced expression profile; (4) accordingly, immune cell type-specific gene expression analysis showed an enrichment in M1 pro-inflammatory macrophages and DCs, mirrored by enhanced expression of TLRs and MHC class I; (5) this increased macrophages was confirmed using spatial profiling and pan-macrophage marker CD68; and (6) as expected from its enhanced immune gene expression, the MLP-1 subtype showed overexpression of PD-L1, PD-L2 and other markers of sensitivity to immunotherapy, including the T cell GEP signature.36 Overall, our study provides insights into the heterogeneity of the immune microenvironment in PanNETs and highlights various potential immunotherapeutic targets.
The MLP-1 subtype is enriched for genes involved in hypoxia and HIF signalling.3 4 These have been linked to many aspects of immunity in the tumour microenvironment, including the upregulation of checkpoints such as PD-L1.38 Hypoxic cell damage was associated with necroptosis and signalling through DAMP and the STING pathways. These signalling avenues reportedly lead to the production of type I or II interferons and recruitment/induction of M1 when combined with TLR stimulation30 31 39 40; all demonstrated to be enriched in the MLP-1 subtype. DAMP pathways provide links between cell damage, danger signals such as cytosolic DNA or dsRNA (sensed by TLR3) and adaptive immune response.30 31 While much remains to be learnt about these pathways and their potential to either promote or inhibit tumour progression, our data suggest that the intrinsic MLP-1 characteristics (including progenitor origin, prometastatic, stroma-rich and/or epithelial–mesenchymal transition phenotypes) in association hypoxia drive enhanced expression of DAMP genes. The latter in turn affects the immune landscape in this subtype. Conversely, a consistent fraction of intermediate subtype PanNETs featured enhanced hypoxia and necroptosis signalling without DAMP activation and with poor enrichment of immune cell-specific hallmarks. On the other hand, insulinoma-like samples showed low hypoxia and necroptosis, with increased expression of β cell-specific genes and a small number of immune genes. While this potentially relates insulin signalling and immune response in insulinoma, it is beyond the scope of the present study.
Moreover, DCs, neutrophils and TLRs were also enriched in the MLP-1 subtype. Tumor-associated DCs have been described as dysfunctional, causing upregulation of immune checkpoints, an increase in regulatory T cells and decreased overall survival in various tumors.41 As both DC-targeted and TLR targeting treatment strategies are in development,42 this is another area which warrants consideration in MLP-1 patients.
The enrichment of genes involved in the above immune-related pathways and the reported induction of PD-L1 by M1 macrophages in other tumors43 provided a rationale to investigate whether MLP-1 subtype patients are more likely to benefit from checkpoint inhibitor therapies than other patients.
Recent clinical trials in patients with neuroendocrine tumour (NET) have used PD-L1 positivity as an inclusion criterion for immunotherapy,10 as PD-L1 (CD274) expression in gastro-oesophageal NETs was associated with tumour grade and survival.16 44 45 In our study, PD-L1 was differentially expressed across PanNET subtypes, with the MLP-1 subtype demonstrating the highest expression, again suggesting that checkpoint inhibitor therapy may be appealing in this subtype. That said, PD-L1 alone has been shown to be an insufficient biomarker of response to checkpoint blockade, highlighting the need for more refined and reliable predictive biomarkers for personalised immunotherapy treatments.46
These observations led us to consider other putative predictive biomarkers according to the immune profiles of our PanNET subtypes, including PD-L2 and T-cell GEP. The latter is based on 18 genes coexpressed with interferon-γ and has been reported to predict response to PD-1 blockade in a number of different solid tumors.36 47 Again, the MLP-1 subtype showed enhanced expression of these markers. We also evaluated the adverse prognostic factor FOXP3 and did not find any change in T-regulatory cell marker FOXP3 by either immunofluorescence or gene expression (figure 5A and online supplemental figure 5D), which corroborates with a published report that FOXP3 is low expressed in PanNETs.48
Clinical trial data are still relatively limited regarding immunotherapy for PanNETs, but recent reports suggest only a fraction of PDL-1-positive tumours may actually respond to immunotherapy.49 While this can be partially overcome by additional markers such as GEP or PDL-2,47 other unknown factors may be involved as predictors of response to immunotherapy. Therefore, our MLP-1 subtype, while correlating with the aforementioned described predictors, also included other characteristics, such as a broad activation of immune related genes, higher tumour stage and grade and an overall more aggressive phenotype. Hence, the selection of patients bearing the MLP-1 subtype may be a promising way to increase the success rate.
Despite PanNET being a rare tumour type, we have analysed 207 cases. We acknowledge that our study used only resected cases and note the importance of studying dynamic immune changes in PanNETs. That said, our study poses the basis for further prospective analysis of primary and metastatic disease at different time points in patients undergoing immunotherapy.
Conclusion
We demonstrate that the MLP-1 subtype of patients with PanNET has an enhanced immune phenotype, associated with increased tumour size, hypoxia, necroptosis and DAMP/STING/TLR pathway activation. There is a complex interplay between tumour and immune cells in MLP-1 PanNETs. The data we present here may serve as the springboard for further investigation of this interplay. In the meantime, our data suggest that immunotherapy (alone or in combination with other treatments) in selected PanNET (MLP-1) patients may be clinically beneficial.
Data availability statement
All data relevant to the study are included in the article or uploaded as supplementary information. Data are available in GEO Omnibus (GEO Omnibus with IDs GSE73338 and GSE73339): (1) the data include transcriptome profiles from patient samples; (2) GEO Omnibus is the repository; and (3) there are no reuse conditions. We have included the information and GEO Omnibus IDs in the Materials and methods and supplemental information.
Ethics statements
References
Footnotes
NS, AS and AS are joint senior authors.
KY, RTL and ASa are joint first authors.
Twitter @antonio pea
Presented at This work was previously presented partly at European Society for Medical Oncology (ESMO) Congress 2017 and partly at European NeuroEndocrine Tumor Society (ENETS) Conference 2019.
Correction notice This article has been corrected since it published Online First. A second corresonding author has been added.
Contributors ASa conceived the idea. ASa, KY, RTL, ASc and NS developed the idea. RTL and ASc organised the entire patient study protocol, collected the samples, and curated the clinical data for training and validation cohort 2 samples, and profiled gene expression for training cohort. YP and ASa performed all the bioinformatics analysis. GN modified certain bioinformatics tools for custom use and wrote the methods description for the same. KY assisted with enrichment analysis and multiplex spatial profile quantitation, and coordinated the data analysis. RTL, KY, NK and CR assisted with RNAseq experiments. KY and CR performed NanoString experiments and analysis. AM, SC, DA, SC, LL, AP, CL, LP and MM assisted in collecting samples, pathology analysis and/or RNA isolation. DM performed multiplex spatial profiling and quantitation, and AM supervised these experiments. BW provided validation cohort 2 samples’ RNA and critically read the manuscript. DM, IC, DC and NS assisted with the manuscript writing and coordination of the study. ASa, KY, RL and ASc interpreted the data. KY, ASa, RTL, AM and ASc wrote the manuscript. ASa, RTL, ASc and NS supervised the project. All the authors have read the manuscript.
Funding This study was supported by Associazione Italiana Ricerca Cancro (5×1000 grant 12 182) Fondazione Italiana Malattie Pancreas (FIMP, Ministero Salute, CUP_J33G13000210001); Fondazione Cariverona, Oncology Biobank Project 'Antonio Schiavi' (prot. 2 03 885–2017) for ASc and RTL. This paper represents independent research partly funded (BRC Reference #A144) by the National Institute for Health Research Biomedical Research Centre at The Royal Marsden NHS Foundation Trust and the Institute of Cancer Research for ASa and NS.
Disclaimer The views expressed are those of the authors and not necessarily those of the National Health Service England, the National Institute for Health Research or the Department of Health and Social Care.
Competing interests ASa, ASc, CR, GN and KY have ownership interest as patent inventors for a patent entitled 'Patient classification and prognostic method' (international patent application number PCT/EP2019/053845). DC have research funding, 4SC (Inst), Amgen (Inst), AstraZeneca (Inst), Bayer (Inst), Celgene (Inst), Clovis Oncology (Inst), Janssen (Inst), Lilly (Inst), MedImmune (Inst), Merck (Inst), Merrimack (Inst) and Sanofi (Inst). NS has research funding: AstraZeneca, Bristol-Myers-Squibb, Merck Serono and Pfizer. ASa - research funding: Bristol-Myers Squibb, Merck KGaA and Pierre Fabre. Patents: (1) ‘Colorectal cancer classification with differential prognosis and personalized therapeutic responses’ (patent number PCT/IB2013/060416) and (2) ‘Prognostic and treatment response predictive method’ (European (EP) patent application number 18792565.6).
Patient and public involvement Patients and/or the public were not involved in the design, conduct, reporting or dissemination plans of this research.
Provenance and peer review Not commissioned; externally peer reviewed.