Article Text

Abstract
Objective Pancreatic ductal adenocarcinoma (PDAC) has the characteristics of high-density desmoplastic stroma, a distinctive immunosuppressive microenvironment and is profoundly resistant to all forms of chemotherapy and immunotherapy, leading to a 5-year survival rate of 9%. Our study aims to add novel small molecule therapeutics for the treatment of PDAC.
Design We have studied whether TAK-981, a novel highly selective and potent small molecule inhibitor of the small ubiquitin like modifier (SUMO) activating enzyme E1 could be used to treat a preclinical syngeneic PDAC mouse model and we have studied the mode of action of TAK-981.
Results We found that SUMOylation, a reversible post-translational modification required for cell cycle progression, is increased in PDAC patient samples compared with normal pancreatic tissue. TAK-981 decreased SUMOylation in PDAC cells at the nanomolar range, thereby causing a G2/M cell cycle arrest, mitotic failure and chromosomal segregation defects. TAK-981 efficiently limited tumour burden in the KPC3 syngeneic mouse model without evidence of systemic toxicity. In vivo treatment with TAK-981 enhanced the proportions of activated CD8 T cells and natural killer (NK) cells but transiently decreased B cell numbers in tumour, peripheral blood, spleen and lymph nodes. Single cell RNA sequencing revealed activation of the interferon response on TAK-981 treatment in lymphocytes including T, B and NK cells. TAK-981 treatment of CD8 T cells ex vivo induced activation of STAT1 and interferon target genes.
Conclusion Our findings indicate that pharmacological inhibition of the SUMO pathway represents a potential strategy to target PDAC via a dual mechanism: inhibiting cancer cell cycle progression and activating anti-tumour immunity by inducing interferon signalling.
- pancreatic cancer
- signal transduction
- immune response
- T lymphocytes
- interferon
Data availability statement
Data are available in a public, open access repository. Data are available on reasonable request. The mass spectrometry proteomics data have been deposited to the ProteomeXchange Consortium via the PRIDE partner repository with the dataset identifier PXD024521.77 The scRNA data have been deposited in NCBI’s Gene Expression Omnibus and are accessible through GEO Series accession number GSE189576.
This is an open access article distributed in accordance with the Creative Commons Attribution 4.0 Unported (CC BY 4.0) license, which permits others to copy, redistribute, remix, transform and build upon this work for any purpose, provided the original work is properly cited, a link to the licence is given, and indication of whether changes were made. See: https://creativecommons.org/licenses/by/4.0/.
Statistics from Altmetric.com
Significance of this study
What is already known on this subject?
The key role of small ubiquitin like modifier (SUMO) signalling in mitosis is well known.
The SUMOylation inhibitor ML-93 showed potential in preclinical models to treat an aggressive subtype of pancreatic cancer.
What are the new findings?
We uncover a surprising new role for SUMO in activating antitumour immunity.
Our work sets the stage for SUMO research in tumour immunology.
How might it impact on clinical practice in the foreseeable future?
Our work bridges the gap to the clinic by demonstrating strong preclinical potential for the new SUMO E1 inhibitor TAK-981 to treat pancreatic cancer, the second most lethal type of cancer that has thus far been resistant to chemotherapy and immunotherapy.
Introduction
Pancreatic ductal adenocarcinoma (PDAC) is one of the deadliest cancer types, responsible for the death of more than 430 000 patients worldwide yearly.1 PDAC has a 5-year overall survival of 9% and is the third most frequent cause of cancer-related deaths worldwide.2 Poor survival from PDAC is attributed to its high aggressiveness, intrinsic chemotherapeutic resistance and lack of targetable oncogenic pathways. The vast majority of PDAC cases are driven by activating mutations in the KRAS oncogene and inactivation of TP53, CDKN2A and SMAD4 tumour suppressor genes.3 4 It has been reported that KRAS mutations occur in more than 90% of human PDAC cases. In mouse models, oncogenic Kras activation has been related with initiating tumourigenesis and with the stromal changes that enable disease advancement.5 6
PDAC is an immune desert and the immunosuppressive environment and associated reduced T-cell infiltration is a major and particular challenge in PDAC.7–10 PDAC is highly resilient to immunotherapy including blockade of immune checkpoints like CTLA-4 and PD-1.11–13 The main reason for failure of immunotherapy has been ascribed to reduced antigenicity of the tumour itself, the presence of profound immunosuppression in the PDAC microenvironment due to the presence of profound desmoplastic stroma, which contains a high number of cancer associated fibroblasts of which subsets display immunosuppressive capacities.10 14 15 The dominance of immunosuppressive cells such as TAMs, Treg and MDSCs in the tumour microenvironment and poor infiltration of PDAC tumours by effector T cells forms a blockade for the effectiveness of immunotherapy.13 Therefore, development of targeted therapies that enable immunotherapy could provide a great opportunity for treating PDAC.
SUMOylation is a dynamic reversible post-translational modification (PTM) that comprises covalent conjugation of small ubiquitin like modifiers (SUMOs) to substrate lysine residues.16 17 SUMO proteins are ∼11 kDa in size and resemble the three-dimensional structure of ubiquitin.18 Despite their high structural similarity, SUMOs and ubiquitin are functionally divergent. The mammalian SUMO family consists of at least four proteins: SUMO1-SUMO4. Mature SUMO2 and SUMO3 are 97% identical in amino-acid sequence and ∼50% identical to SUMO-1. Since no functional difference between SUMO2 and SUMO3 has been identified, they are collectively called SUMO2/3. SUMOylation is catalysed by a cascade of enzymes that are similar to enzymes regulating protein ubiquitination. The start of the SUMOylation cascade is catalysed by the SUMO-activating enzyme (SAE), formed by the SAE1 and SAE2/UBA2 heterodimer and involves thioester-bond formation between SUMO and SAE2 in an ATP-dependent manner. Next, SUMO is transferred to the sole E2 enzyme, UBC9/UBE2I. In the last step, SUMO E3 ligases catalyse formation of the isopeptide-bond between SUMO and the ε-amino group of a substrate lysine residue. SUMOylation of most proteins can be rapidly reversed by a group of sentrin/SUMO-specific proteases. SUMOylation can change the molecular interactions of modified substrates by masking or providing interaction surfaces and regulates the localisation, activity and stability of target proteins.
SUMOylation plays crucial roles in cell cycle regulation, DNA-damage repair, nuclear transport, chromosomal structure and segregation.19–27 In the last decade thousands of SUMOylated proteins have been identified, which include a large variety of tumour suppressors, (proto)-oncogenes, transcription factors and DNA damage and repair proteins.26 Given the role of SUMOylation in regulating cell proliferation and maintaining genome integrity, proof is accumulating for a crucial role of SUMOylation in cancer. SUMO machinery components are highly overexpressed in many cancer types and associated with poor patient outcomes.28 29 Interestingly, knockdown of the SUMO E1 subunit SAE2 or UBC9 profoundly reduced tumour growth in mouse models.30 31 In addition to this, it has been reported32 that knocking down the SUMO E1 or E2 confers synthetic lethality in tumours with high MYC, NOTCH1 activity or KRAS activating mutations.33–36 These findings suggest that targeting SUMOylation enzymes can be exploited as a potential anticancer therapy.
Recently, an overview of the roles of SUMO in PDAC has been published.37 It has been shown that the SUMO E3-ligase PIAS4 is overexpressed in PDAC tumours and cell lines and that knocking down PIAS4 by RNAi reduced PDAC cell growth.32 Another study has shown potential for the SUMO E1 inhibitor ML-93 in models of an aggressive subtype of PDAC overexpressing MYC.38
In this study, we used TAK-981, a highly selective and potent novel small molecule inhibitor of SAE.39 We demonstrate that TAK-981 selectively decreased SUMOylation, thereby blocking cell proliferation, causing mitotic failure and chromosomal segregation defects in pancreatic cancer cells. In vivo TAK-981 reduced the tumour burden in the KPC3 syngeneic mouse model, without evidence of toxicity. Finally, we show that TAK-981 induced a reversible increase of CD8 T cells and a strong relative decrease of B cells in peripheral blood. Single cell RNA (scRNA) sequencing revealed activation of the interferon response on TAK-981 treatment in lymphocytes including T cells, B cells and natural killer (NK) cells. TAK-981 treatment of lymphocytes ex vivo activated STAT1 and induced interferon target genes. Overall, our results indicate that inhibition of SUMOylation represents a potential clinical strategy to treat PDAC via a dual mode of action.
Results
High expression of SUMO pathway components negatively correlates with pancreatic cancer progression
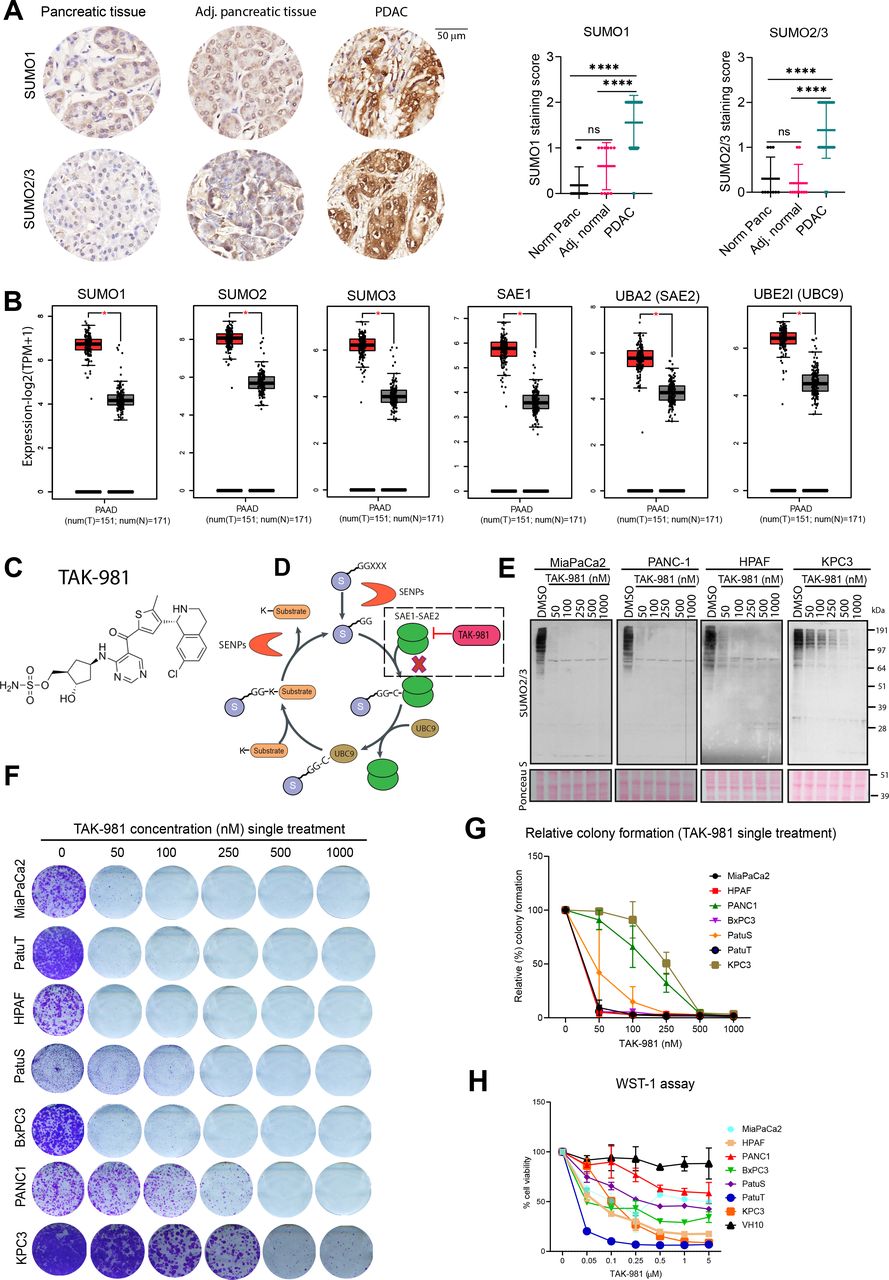
We evaluated potential roles of SUMOylation in pancreatic cancer tissues and found that the vast majority of cancer samples demonstrated high expression levels of both SUMO1 and SUMO2/3 compared with adjacent normal tissue and primary pancreatic tissue (figure 1A). Significantly increased expression levels of SUMO pathway components were observed in PDAC samples, compared with normal pancreatic tissue (figure 1B). Interestingly, higher expression of SUMO1, SUMO2, SUMO3, SAE1, UBE2I in PDAC patients correlated with significantly lower overall survival (online supplemental figure S1A). These results prompted us to investigate the relevance of SUMOylation for proliferation of pancreatic cancer cells.
Supplemental material

SUMO pathway components are overexpressed in PDAC and required for tumour cell proliferation. (A) Immunohistochemical analysis of SUMO1 and SUMO2/3 in PDAC, adjacent normal and normal pancreatic tissue from tissue microarray of PDAC. Dot plots represent the quantification of SUMO1 and SUMO2/3 immunodetection. P values were calculated using one-way ANOVA with Tukey’s multiple comparison test. ****p<0.0001; n.s. indicates non-significant p value. (B) SUMO pathway genes mRNA expression in PDAC (red) and normal pancreas (grey) based on the TCGA and GTEx data analysed by GEPIA2. *p<0.05. (C) chemical structure of TAK-981. (D) SUMOylation cycle and the inhibition of SUMO-activating enzyme (SAE) by TAK-981. (E) Western blot analysis of SUMO2/3 levels of the human pancreatic cancer cell lines MiaPaCa2, PANC1, HPAF and mouse pancreatic cancer cell line KPC3, treated for 4 hours with the indicated concentrations of TAK-981. Ponceau S staining was used as loading control (n=2). (F) Multiple human pancreatic cancer cell lines MiaPaCa2, PANC1, HPAF, BxPC3, PatuS, PatuT and mouse pancreatic cell line KPC3 were treated with the indicated concentrations of TAK-981 for 4 days and colony formation was determined by crystal violet staining. (G) Line graphs represent the absorbance of solubilised crystal violet as mean with standard deviation (n=3). (H) Cell viability of human pancreatic cells and foreskin fibroblast primary cells was measured with the WST-1 assay. Cells were treated with the indicated concentrations of TAK-981 for 4 days. Relative cell viability is represented as mean with SD. The experiment was carried out twice in triplicate (n=6). ANOVA, analysis of variance; GTEx, genotype-tissue expression; PDAC, pancreatic ductal adenocarcinoma; SUMO, small ubiquitin like modifiers; TCGA, The Cancer Genome Atlas.
TAK-981, a small molecular SUMO E1 inhibitor inhibits proliferation of pancreatic cancer cells by inducing mitotic defects
SUMOylation is a key mediator of cancer cell cycle progression.40 Recently, Takeda Development Center Americas (Lexington, Massachusetts, USA) identified a novel, highly selective small molecule SUMO E1 inhibitor TAK-98139 (figure 1C). TAK-981 inhibits SUMOylation in a manner similar to its analogue ML-79241 (figure 1D). We first evaluated the effect of SAE inhibition by TAK-981 on SUMO-conjugation in three different human pancreatic cancer cell lines, MiaPaCa2, PANC1 and HPAF and in one mouse pancreatic cancer cell line, KPC3. Treatment with TAK-981 for 4 hours strongly decreased the SUMO2/3 and SUMO1-conjugate levels in a concentration dependent manner (figure 1E, online supplemental figure S1B). TAK-981 did not inhibit the related PTM ubiquitination at applied doses (online supplemental figure S1B), demonstrating the specificity of this inhibitor. Furthermore knockdown of the SUMO1 E1 subunit SAE2 significantly decreased colony formation of MiaPaCa2, HPAF and PANC1 PDAC cell lines, whereas knockdown of the SUMO E1 subunit SAE1 had a modest effect on colony growth formation in PANC1 cells due to residual SUMOylation (online supplemental figure S1E–G).
To systematically compare the TAK-981 sensitivity, seven PDAC cell lines were analysed in long-term colony assay formation using TAK-981 titration series. Cells either received a single treatment for 4 days or continuous treatment for 10 days. Inhibition of the SUMO E1 enzyme by TAK-981 significantly decreased colony formation at the nanomolar range in all tested pancreatic cell lines with MiaPaCa2, PatuT and HPAF as most sensitive cell lines (figure 1F,G, online supplemental figure S1C,D). Furthermore, TAK-981 decreased the viability of pancreatic cell lines in a concentration-dependent manner (figure 1H). In contrast, SAE inhibition by TAK-981 showed weak effects on the viability of VH10 normal human foreskin fibroblast at tested concentrations, signifying that a therapeutic window could exist for TAK-981 therapy (figure 1H). These results provide evidence that SUMO signalling is essential for pancreatic cancer cell proliferation in vitro.
MiaPaCa2, HPAF and BxPC3, PatuS and PatuT cells exhibited a significant increase in the fraction of cells in the G2/M phase after 24 hours and 48 hours and MiaPaCa2, PatuS and PatuT also in cells with a>4 n DNA content after 48 hours of TAK-981 treatment (figure 2A, online supplemental figure S2B–G). All the cell lines except PANC1 showed significant increases in the fraction of cells in sub-G1 in response to TAK-981, indicating that TAK-981 induces apoptosis.

TAK-981 leads to cell cycle arrest and DNA bridges. (A) Cell cycle analysis of MiaPaCa2 treated with 0.5 µM TAK-981 or 0.1% DMSO for 24 hours and 48 hours. Cellular DNA content was determined by propidium iodide staining and flowcytometry. Bar graphs show the percentage of cells in each cell cycle phase (SubG1, G1, S, G2/M and >4 n) of three biological replicates (n=3). Error bars represent SEM and p values are derived from two-sided two sample t-tests. *p<0.05; **p<0.01; ***p<0.001; ****p<0.0001. (B) Untreated or 0.5 µM TAK-981 treated cells were fixed and stained with DAPI to view the nuclear morphology. White arrows indicate the location of DNA bridges. (C) The percentage of DNA bridge formation in MiaPaCa2 cells after 24 hours of 0.5 µM TAK-981 treatment. The bar graph shows the percentage of cells that have DNA bridges. Error bars represent SD and the p value is derived from a two-sided two-sample t-test with n=2 independent experiments. *p<0.05; **p<0.01; ***p<0.001; ****p<0.0001. (D) Experimental overview for the identification of SUMO2 target proteins in pancreatic cancer cell lines. MiaPaCa2 and PANC1 cells stably expressing His10-SUMO2. Cells were treated with 0.1% DMSO or 10 µM MG132 for 7 hours. Cells were lysed and sumoylated proteins were enriched by means of Ni-NTA pull down under denaturing conditions. Enriched proteins were trypsin digested and prepared for label-free quantitative mass spectrometry. Peptides were identified by nano flow LC- tandem MS approach (nano LC-MS/MS). The three experimental conditions of three replicates were analysed in two technical repeats per samples, resulting in a total of 18 MS runs. (E) Venn diagram showing the numbers of SUMO2 target proteins preferentially sumoylated (Log2 fold change ≥1) in MiaPaCa2, PANC1 or common to both cell types. (F-G) Volcano plots showing all identified proteins in DMSO or MG132 treated His10-SUMO2 MiaPaCa2 samples compared with wild type MiaPaCa2 cells. Dashed lines indicate a cut-off at twofold change (Log2=1) and a p value of 0.05 (-log10=1.3). Sumoylated proteins are represented as blue dots. (F) shows identified cell cycle related proteins and oncogenes without MG132 treatment highlighted in red. (G) shows cell cycle related proteins and oncogenes which are enriched after MG132 treatment, highlighted in red. (H–I) String analysis of highly interconnected clusters of SUMO2/3 target proteins. Orange colour intensity represents the average enrichment compared with control beads. (H) Cluster showing proteins that are involved in DNA replication and repair. (I) Cluster showing proteins that are involved in mitotic cell cycle phase transition. SUMO, small ubiquitin like modifiers.
Using live-cell microscopy, TAK-981 treated MiaPaCa2 cells showed a multinucleated phenotype with fragmented, flattened and enlarged morphology in a time dependent manner. Furthermore we also observed that DMSO-treated cells underwent normal cell cycle division, whereas the TAK-981 treated cells showed abnormal mitosis with mitotic arrest. After 24 hours or 48 hours of TAK-981 treatment, we observed anaphase bridges and DNA bridges connecting daughter cells in four different pancreatic cell lines (figure 2B). We analysed MiaPaCa2 cells in more detail for DNA bridges and found that 0.2% of MiaPaCa2 control cells displayed DNA bridges. The formation of these DNA bridges was significantly augmented to 6% on TAK-981 treatment (figure 2C). Furthermore, we also observed that TAK-981 treatment increased the number of micronuclei after 24 hours treatment, which are a hallmark of lagging acentric chromosomes during anaphase, due to defective mitotic processes (online supplemental figure S2H).42 These results imply that SUMO E1 inhibition by TAK-981 leads to defects in cell cycle progression, including impaired chromosomal segregation as expected.33 43–47
Identification of SUMO2 target proteins in pancreatic cancer cells by mass spectrometry
To identify target proteins modified by SUMO in pancreatic cancer cell lines, we used our SUMO2 purification methodology.48 SUMO2 conjugated proteins were purified by Ni-NTA pulldown, identified by mass spectrometry and quantified using MaxQuant and Perseus software.49 50 Overall we identified 374 SUMO2 targets in MiaPaCa2 and 264 in PANC1 cells in the absence of MG132 treatment, including 183 shared SUMO targets (figure 2D,E) (online supplemental dataset 1). We identified SUMOylation of key mitotic regulators including TOPIIα, TOPIIβ, CENP-C, KIF4A, KIF23, CDK11A and CDK11B and DNA damage response proteins including XRCC4, XRCC6, PARP1 without proteasome inhibition (figure 2F). On MG132 treatment, we observed a striking increase in SUMO target proteins and we identified 1721 SUMO2 targets in MiaPaCa2 and 1289 in PANC1, including 1036 shared SUMO targets (figure 2E). We observed SUMOylation of a larger set of cell cycle regulators and DNA damage response proteins after proteasome inhibition including CDK1, PLK2, ANAPC4, MIS18BP1, FOXM1, CDC20, SMC4, MCM7, MCM10, BLM, XRCC5, BRCA1 and BARD1 (figure 2G). STRING interaction network analysis51 revealed a large interconnected set of nuclear SUMOylated proteins. The most interconnected clusters consisted of proteins that are involved in DNA replication and repair, mitotic cell cycle, RNA splicing and ribonucleoprotein complex biogenesis (figure 2H,I, online supplemental figure S3B,C). Taken together these results indicate that a very large set of SUMO2 targets is degraded by the proteasome in these cells and that SUMO2 co-regulates large groups of mitotic factors and DNA damage response proteins.
Supplemental material
TAK-981 reduces tumour growth in a mouse model of PDAC
To investigate the antitumour activity of TAK-981 in vivo, we used the KPC syngeneic mouse model for pancreatic cancer.52 The KPC mouse is an established and clinically relevant genetically engineered PDAC model with knock-in alleles of both KrasG12D and p53R172H mutants, which exhibits a multi-stage tumourigenesis that progresses from normal, through pancreatic intraepithelial neoplasia lesions, to invasive and metastatic PDAC. From these tumours various cell lines were established, including the KPC3 cells. KPC3 cells are sensitive to SUMO E1 inhibition by TAK-981 in vitro, although they were not as sensitive as the human PDAC cell lines (figure 1E,F).
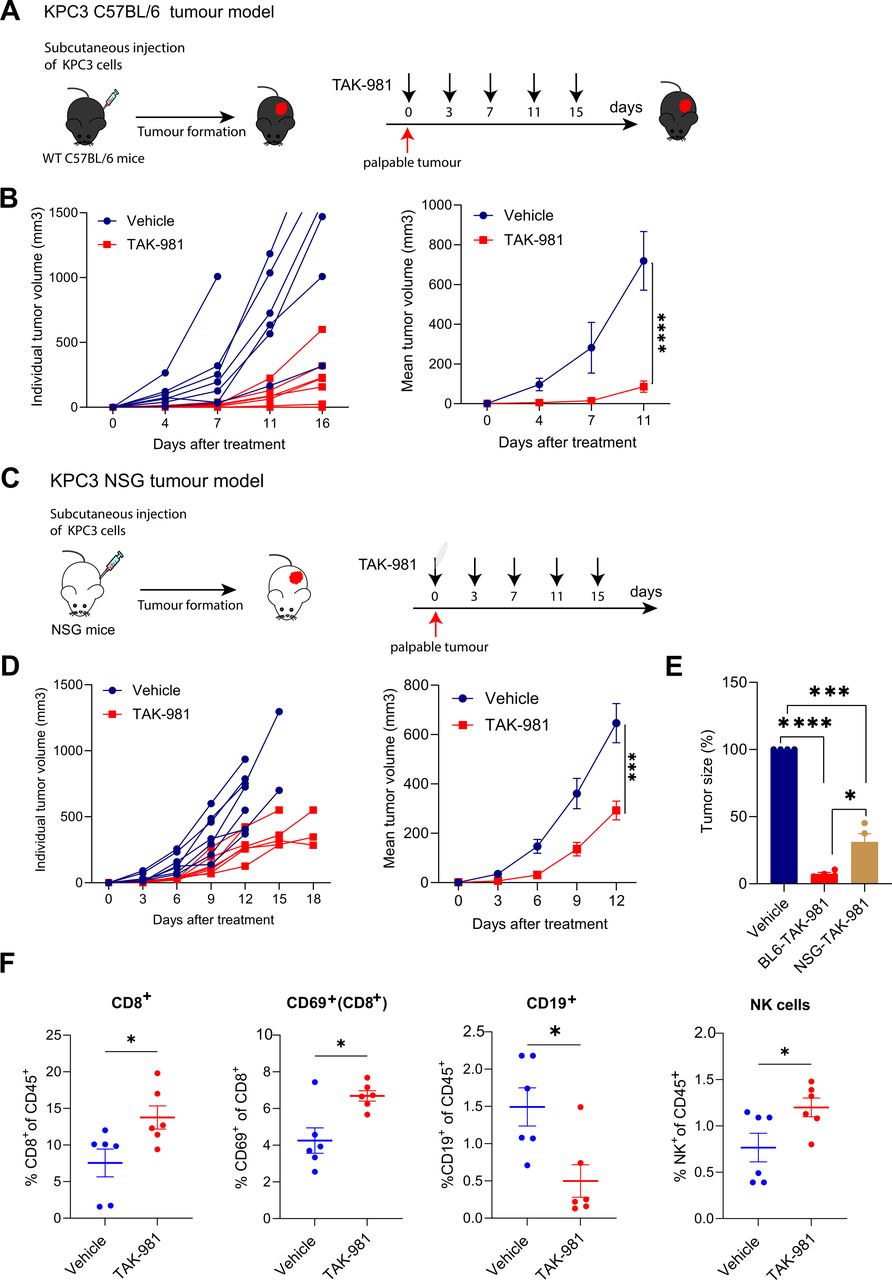
To evaluate the efficacy of TAK-981 in vivo, KPC3 cells were injected subcutaneously into syngeneic C57BL/6 mice (figure 3A). When tumours were palpable (2 weeks after injection), mice were treated by retroorbital injection for 15 days with TAK-981 (7.5 mg/kg) or vehicle control, twice weekly, and tumour growth and animal body weight were monitored. TAK-981 treated mice showed a significantly suppressed tumour growth compared with vehicle treated mice (figure 3B). TAK-981 was well tolerated during short term treatment, as shown by average body weight gain observed during the course of dosing (online supplemental figure S4). The data demonstrate that treatment with TAK-981 efficiently inhibits tumour growth in the KPC PDAC model.

TAK-981 treatment reduces the tumour growth of the subcutaneous KPC pancreatic cancer model. (A) Experimental treatment strategy for tumour growth inhibition in the KPC syngeneic C57BL/6 mouse tumour model. Tumours were subcutaneously transplanted in C57BL/6 mice (n=7 mice per group) and mice were randomised in two groups. When tumours were palpable, mice were treated with vehicle or 7.5 mg/kg TAK-981 twice weekly (days 0, 3, 7, 11, 15). (B) Both individual and mean tumour growth of mice bearing KPC tumours treated with vehicle or 7.5 mg/kg TAK-981 are shown as mean±SEM. (C) Experimental treatment strategy for tumour growth inhibition in the KPC NSG mouse tumour model. Tumours were subcutaneously transplanted in NSG mice (n=7 mice per group). When tumours were palpable, mice were treated with vehicle or 7.5 mg/kg TAK-981 twice weekly (days 0, 3, 7, 11, 15). (D) Both individual and mean tumour growth of NSG mice bearing KPC tumour treated with vehicle or 7.5 mg/kg TAK-981 are shown as mean±SEM, n=7 mice per group. Tumour growth was compared using repeated measure two-way ANOVA (*p<0.05; **p<0.01; ***p<0.001; ****p<0.0001) with Tukey multiple comparisons of means to evaluate the difference between two groups. (E) Tumour growth inhibition comparison between C57BL/6 and NSG mice after inhibitor treatment. Tumour growth was compared using repeated measure two-way ANOVA (*p<0.05; **p<0.01; ***p<0.001; ****p<0.0001) with Tukey multiple comparisons of means to evaluate the difference between two groups at the different timepoints. (F) Flow cytometric analysis of infiltrating immune cells in subcutaneous KPC3 tumours from C57BL/6 mouse treated with TAK-981 or vehicle. percentages of infiltrating CD8 T cells, CD69+ and NK cells were increased in TAK-981 treatment mice compared with vehicle control. Percentage of B cells were decreased in TAK-981 treated animals. Statistical testing was performed using unpaired two-tailed Welch’s t-test. *p<0.05. ANOVA, analysis of variance; NK, natural killer.

TAK-981 promotes activation of CD8 T cells and NK cells in lymphatic organs and peripheral blood. C57BL/6 mice were treated with vehicle or 7.5 mg/kg TAK-981 on days 0, 3, 7, 10. Mice were split into two groups: before SUMO inhibition recovery group (n=3) at day 11 and after SUMO inhibition recovery group at day 15 (n=4), blood, lymph nodes, spleen and bone marrow were harvested at day 11 and day 15. The indicated panels of lymphocytes were monitored using flow cytometry after TAK-981 treatment. (A–D) Pie charts and graphs representing the frequencies of lymphocytes and myeloid cells in blood, lymph nodes, spleen and bone marrow respectively pre and post TAK-981 treatment. Statistical testing was performed using unpaired two-tailed Welch’s t-test. *p<0.05; **p<0.01; ***p<0.001; ****p<0.0001. NK, natural killer; SUMO, small ubiquitin like modifier.
We next determined the antitumour activity of TAK-981 in an immune-compromised NSG mouse53 using the KPC3 cells. When tumours became palpable, mice were treated with either TAK-981 (7.5 mg/kg) or vehicle intravenously twice-weekly for 15 days (figure 3C). KPC3 tumour growth in vehicle-treated NSG mice was overall comparable to KPC3 tumour growth in vehicle-treated immune-competent C57BL/6 mice, indicating lack of immunogenicity of KPC3. Systemic administration of TAK-981 delayed tumour growth rate in treated mice as compared with vehicle control (figure 3D). However, tumour growth inhibition in immune-compromised mice was considerably less compared with tumour growth inhibition achieved in the immune-competent C57/BL6 mice (figure 3E). Infiltrating immune cells were isolated from tumours and studied by flow cytometry in an independent experiment (figure 3F). We found that TAK-981 treatment induced the infiltration of tumours with lymphocytes, particularly CD69+ cytotoxic T cells and NK cells. Moreover, TAK-981 treatment reduced the frequency of B cells in tumours (figure 3F, online supplemental figure S5A). Taken together, these results suggest that TAK-981 has a potential dual mode of action by modulating the immune system and blocking cancer cell proliferation.
Immunomodulatory effect of TAK-981 in blood
Next, we investigated potential immune modulatory effects of TAK-981 in detail, by determining the effect of TAK-981 on circulating lymphocytes and myeloid cells. We treated naïve C57BL/6 mice on days 0, 3, 7 and 10 with 7.5 mg/kg TAK-981 or solvent and blood was harvested at days 1, 4, 8, 11 and 15 after the start of the treatment (figure 4A). We implemented multicolour flow cytometry to assess the abundance of immune cell subsets in peripheral blood. The gating strategy for lymphocyte and myeloid cell identification is provided in online supplemental figure S5B,C. Our flow cytometry analysis of blood from the TAK-981 treated mice demonstrated an increase in frequencies of CD8 T cells and natural killer (NK) cells and a more modest increase in neutrophils (Ly6G+) and a strong decrease of B cells (CD19+) (figure 4A). In contrast, CD4 T cells, macrophages (F4/80+) and associated lineages were hardly affected. The noted relative increases in frequencies of these cells were due to the strong transient decrease in absolute numbers of B cells and do not represent absolute increases in lymphocyte populations in blood as shown in tumour-bearing mice (online supplemental figure S6A).

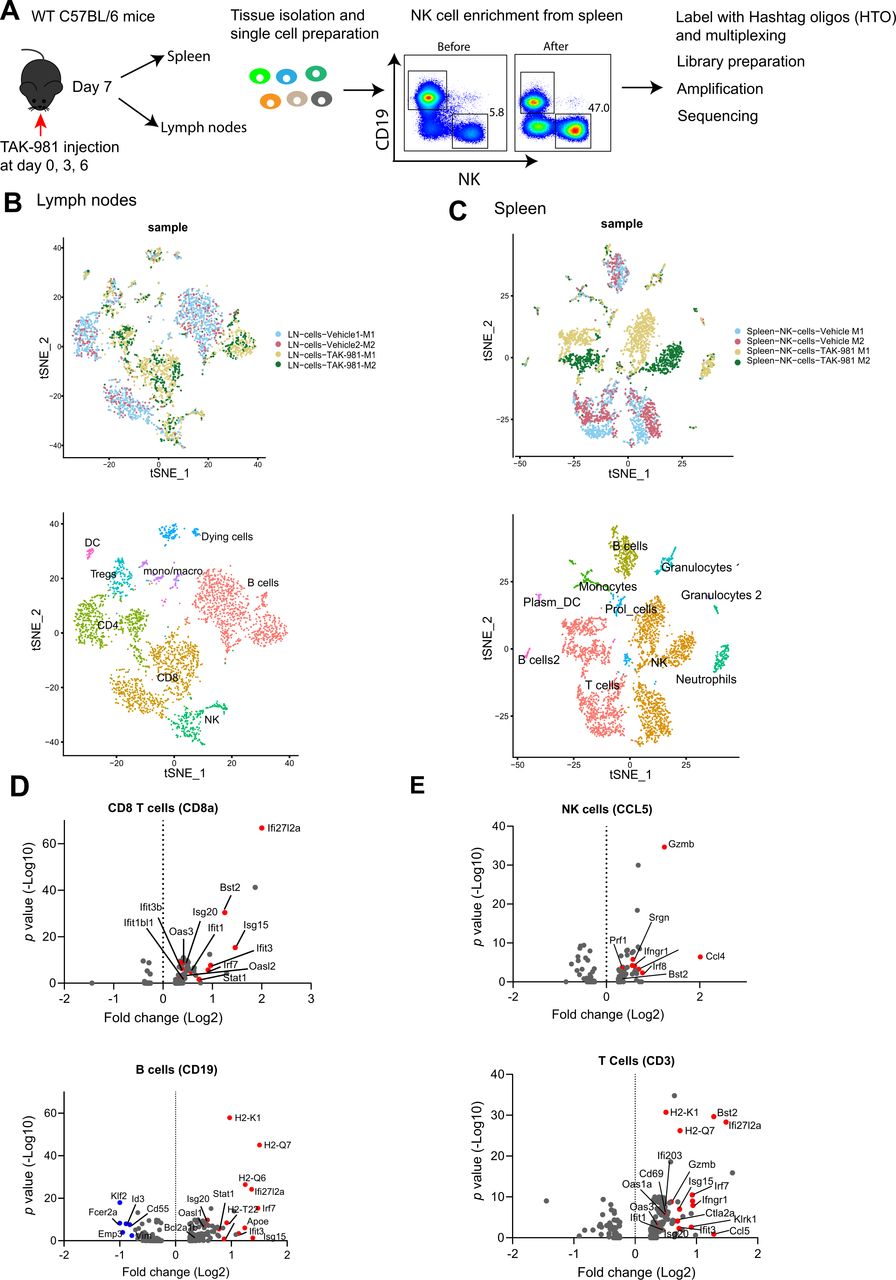
TAK-981 activates the interferon pathway in lymphocytes and NK cells. (A) Experimental setup showing the overview of single cell sequencing. Naïve C57BL/6 mice (n=2) were treated with vehicle or 7.5 mg/kg TAK-981 at days 0, 3 and 6. Lymph nodes and spleens were harvested at day 7. NK cells were enriched from spleen samples. Single cells from lymph node and NK enriched cells from spleen were labelled with eight different Hashtag oligos. After pooling, samples were run on 10 x genomics chromium platform and libraries were sequenced. (B) t-SNE visualisation of principal component analysis (PCA) and unsupervised cluster analysis of cells from lymph nodes, harvested from TAK-981 or vehicle control treated mice. Different clusters of identified immune cells are marked as well as clusters corresponding to TAK-981 responsive cells. (C) t-SNE visualisation of PCA and unsupervised cluster analysis of NK enriched samples from spleen, harvested from with TAK-981 or vehicle control treated mice. Different clusters of identified immune cells are marked. (D) Volcano plots showing the relationship between the significance and the magnitude of the differences in gene expression in CD8 T cells or B cells obtained from lymph nodes of TAK-981 or vehicle treated mice. statistical significance (log10 adjusted p value) was plotted against log2 fold change of gene expression levels. Red dots represent interferon responsive genes. (E) Volcano plots showing the relationship between the significance and the magnitude of the differences in gene expression in enriched NK cells or T cells obtained from spleens of TAK-981 or vehicle treated mice. statistical significance (log10 adjusted p value) was plotted against log2 fold change of gene expression levels. red dots represent interferon responsive genes. NK, natural killer.
Immunomodulatory effect of TAK-981 in lymphatic organs and bone marrow
Analysis of blood from naïve mice treated with TAK-981 revealed modulation of subsets of lymphocytes and myeloid cells. We investigated the effect of TAK-981 on immune cells in naïve C57BL/6 mice in more detail to assess the abundance of key lymphocyte populations in peripheral blood, spleen, lymph nodes and bone marrow pre-TAK-981 and post-TAK-981 treatment. The gating strategy for lymphocyte and myeloid cell identification is described in online supplemental figure S5B,C.
We treated C57BL/6 naïve mice twice weekly with TAK-981 and blood was harvested at the indicated timepoints after the start of the treatment (figure 4A). Spleen, lymph nodes and bone marrow from 3 mice per group were harvested at day 11. We paused the TAK-981 treatment at day 10 and let the mice recover from SUMO inhibition for the next 4 days followed by harvesting of blood, spleen, lymph nodes and bone marrow. We observed a general increase in the frequencies of CD8 T cells and NK cells in peripheral blood, lymph nodes and spleen, but not in bone marrow, (figure 4 and online supplemental figure S7). The higher proportions of these cytotoxic lymphocytes and NK cells were maintained even 4 days after removal of TAK-981. We also observed increases in the proportion of neutrophils in blood and spleen but not in lymph nodes and bone marrow at day 11 after the start of the treatment. After 4 days of recovery from SUMO inhibition, the proportion of neutrophils was reduced in blood but not in spleen, and B cells recovered in blood, spleen and bone marrow, but not in lymph nodes (figure 4). Interestingly, we also observed activation of CD11C+ DCs specifically in spleen before and after recovery from SUMO inhibition (online supplemental figure S8B). We detected increases in monocyte-derived DCs and type 2 conventional DCs (cDC2) post TAK-981 treatment particularly in spleen and activation of cDC1 (online supplemental figure S8B).
The frequencies of CD4 T cells mostly remained unaffected and likewise the percentages of Fox3P+ CD4+ regulatory T cells largely remained unaffected except in spleen (figure 4A–D). However, in tumour-bearing mice, both lymph node and spleen show an increased trend in Fox3P+ CD4+ cells (online supplemental figure S6B,C). We further analysed the expression of activation marker CD69 and granzyme B, a key serine protease produced by activated CD8 T cells and NK cells to induce apoptosis in target cells. TAK-981 treatment increased the percentage of granzyme B positive CD8 T cells, but not the percentage of CD69 positive CD8 T cells in blood and lymph nodes (figure 4A,B).
We then investigated T cell differentiation markers CD44 and CD62L, since it has been described previously that immunostimulatory therapies for cancer induce potent proliferation of memory CD4 and CD8 T cells.54 In mice, the CD44-CD62L+ T cell subset is considered naïve, the CD44+CD62L+ population is considered central memory (CM) and CD44+CD62L- population is considered effector and/or effector memory (EM). We observed a moderate increase in the frequency of CD8 T cells with a CM phenotype on TAK-981 treatment in blood, lymph nodes, bone marrow and spleen (figure 4A–D). Interestingly we also observed an increase in the frequency of both CD4 T and CD8 T cells with an EM phenotype (figure 4A–D). We observed similar effects on different lymphocyte populations from spleen and lymph nodes in KPC3-tumour-bearing mice after TAK-981 treatment (online supplemental figure S6B,C).
Interestingly, we observed a dramatic decline in the frequencies of B cells (CD19+) also in lymphatic organs and bone marrow (figure 4A–D, online supplemental figure S7A–D). Cessation of TAK-981 administration resulted in a partial recovery of B cells in blood and spleen (figure 4A,C, online supplemental figure S7A,C) and importantly, B cell frequencies normalised 4 days after TAK-981 withdrawal in bone marrow, indicating a recovery of B cell numbers in this haematopoietic organ (figure 4D, online supplemental figure S7D). Kinetic studies (figure 5A) revealed that TAK-981 reduced B cells in blood as early as 6 hours after the start of the treatment (figure 5B). Detailed analysis showed that all different types of B cells were reduced on treatment with TAK-981, except for plasma cells (figure 5D,E and online supplemental figure S9). Evaluation of Annexin V expression in treated samples indicated that B cells die from apoptosis (figure 5C).
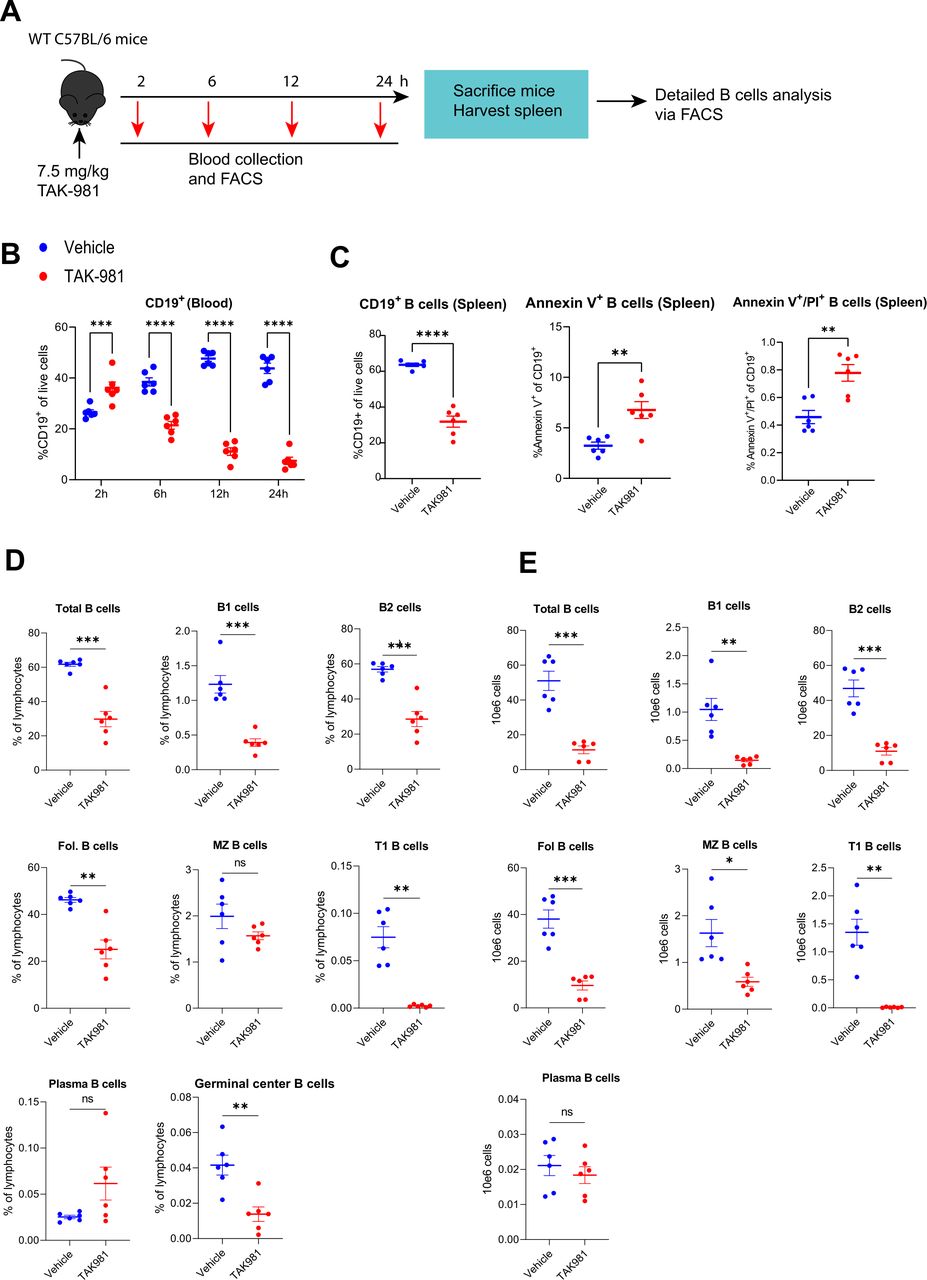
TAK-981 affects major subset of B lymphocytes and induces apoptosis. (A) Experimental setup showing treatment of mice and harvesting of blood and organs. Naïve C57BL/6 mice (n=6) were treated with vehicle or 7.5 mg/kg TAK-981. Peripheral blood was collected at 2, 6, 12, 24 hours after start of the treatment. Spleens were harvested 24 hours after the start of the TAK-981 treatment or vehicle control treatment and different sub-sets of B cells and the apoptosis marker annexin V were analysed by flow cytometry. (B) Flow cytometry analysis of B cells (CD19) from blood, harvested at the indicated timepoints after the start of the TAK-981 treatment or vehicle control treatment. Graphs show the frequencies of circulating B cell subsets. (C) Graphs show the frequencies of splenic B cells and annexin V/PI staining after 24 hours of TAK-981 treatment or vehicle control treatment. (D) Graphs show the frequencies of B cell subsets in spleen after 24 hours of TAK-981 treatment or vehicle control treatment. (E) Graphs show the absolute numbers of B cell subsets in spleen. Statistical testing was performed using unpaired two-tailed Welch’s t-test. *p<0.05; **p<0.01; ***p<0.001; ****p<0.0001.
TAK-981 activates the interferon pathway in lymphocytes and NK cells
Subsequently, we carried out scRNA sequencing (scRNA) in search of a potential mechanistic explanation for the immunomodulatory role of SUMO (figure 6A). C57BL/6 mice were treated with TAK-981 or vehicle control at days 0, 3 and 6 and lymph nodes and spleen were isolated. Cells were isolated from lymph nodes and NK cells were enriched from spleen. Cells were labelled with Hashtag oligos, libraries were prepared and amplified and sequencing was performed. The different lymphocyte populations were detected as expected (figure 6B,C, online supplemental figure S10A). Subsequent analysis of differentially expressed mRNAs between treated and untreated samples revealed a striking upregulation of interferon target genes in response to TAK-981 treatment in all major sets of lymphoid populations and NK cells (figure 6D,E, online supplemental figure S10C). Our data fit with recent reports on the role of the SUMO pathway suppressing interferon responses.24 25
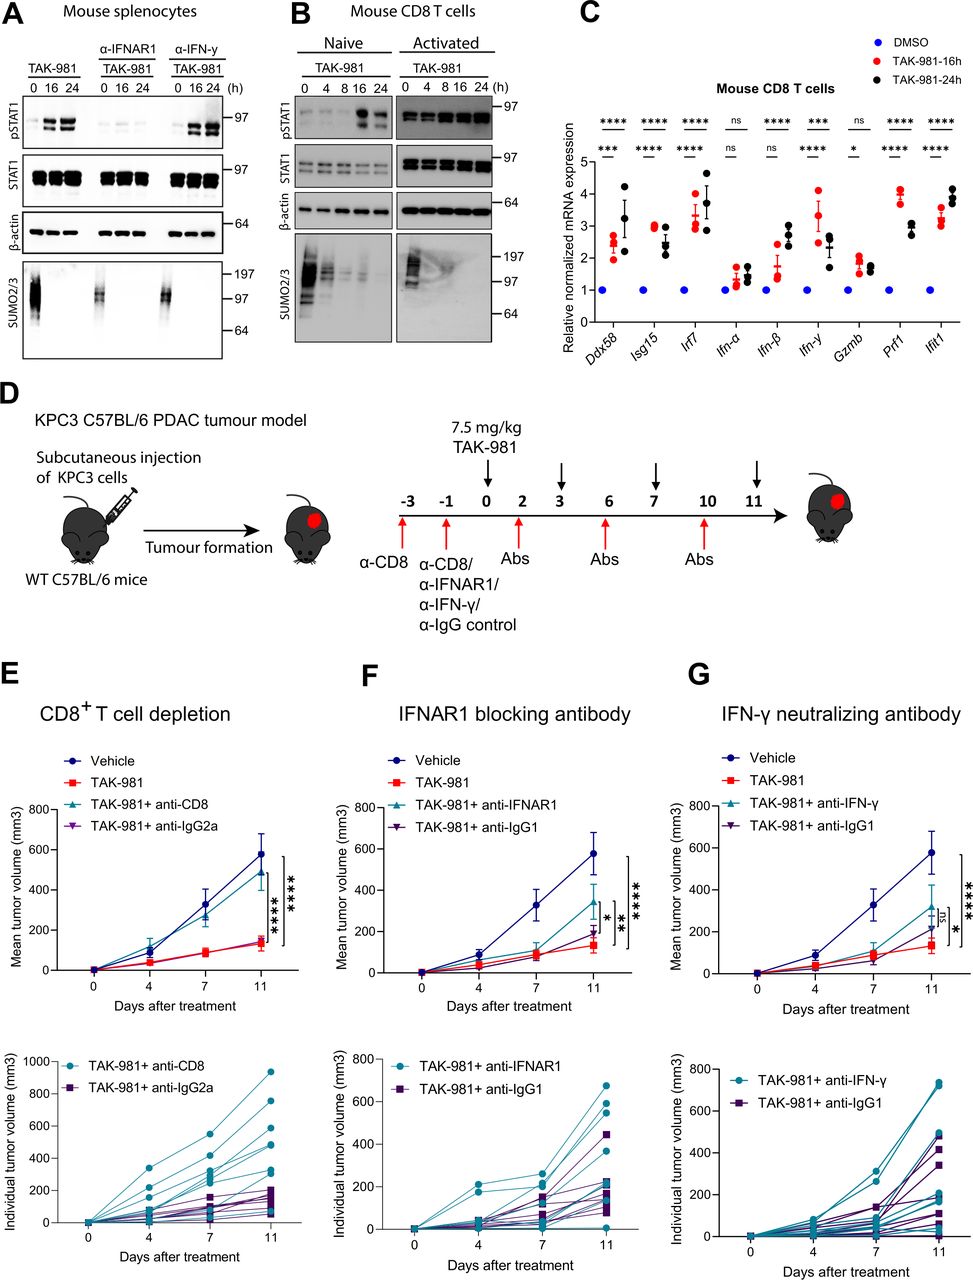
Subsequently, we demonstrated activation of STAT1 by phosphorylation in response to TAK-981 in primary splenocytes ex vivo, which could be fully blocked by an antibody neutralising the type I interferon receptor IFNAR, but not by an antibody neutralising type II interferon (IFNγ) (figure 7A). Activation of STAT1 by phosphorylation in response to TAK-981 was confirmed in mouse primary CD8 T cells and human CD8 T cells ex vivo. Treatment of naïve and activated CD8 T cells from Pmel-1 TCR transgenic mice and human CD8 T cells induced phosphorylation of STAT1, in a time dependent manner (figure 7B, online supplemental figure S11B). qPCR analysis confirmed activation of interferon signalling in mouse CD8 T cells in response to TAK-981 ex vivo, including expression of Ifn-β and Ifn-γ and interferon target genes Ddx58, Isg15, Irf7, Gzmb, Prf1 and Ifit1 (figure 7C). TAK-981 treatment of mouse CD8 T cells resulted in increased secretion of IFNγ, GM-CSF, GranzymeB, IL-3, IL-5, IL-13 and TNFα and in consumption of IL-2 ex vivo (online supplemental figure S11A). qPCR experiments for human CD8 T cells showed increases in interferon target genes DDX58, ISG15 and ISG56 (online supplemental figure S11C). Combined, our results indicate that TAK-981 treatment increases the proportion of specific sets of lymphocytes and myeloid cells in peripheral blood by inducing interferon signalling and related cytokines.

TAK-981 reduces KPC3 growth in a CD8 T cells and IFNAR dependent manner. (A) Western blot analysis of STAT1 phosphorylation (pSTAT1) in splenocytes obtained from C57BL/6 mice treated ex vivo with 150 nM TAK-981 in the presence of IFNAR1 blocking or IFN-γ neutralising antibodies (n=3). (B) Western blot analysis showing STAT1 phosphorylation (pSTAT1) in CD8 T cells from Pmel-1 TCR transgenic mice ex vivo treated with 150 nM TAK-981or DMSO control for the indicated time points (n=2). (C) qPCR analysis showing the expression of IFN-stimulate genes and interferons in mouse CD8 T cells treated ex vivo with 150 nM TAK-981 for the indicated time points. Statistical testing was performed using two way ANOVA with Dunnett’s multiple comparisons test. Data are expressed as mean±SEM *p<0.05; **p<0.01; ***p<0.001; ****p<0.0001. (D) Experimental strategy. KPC3 tumours were subcutaneously transplanted in C57BL/6 mice (n=8 mice per group). When tumours were palpable, mice were treated with vehicle or 7.5 mg/kg TAK-981 twice weekly (days 0, 3, 7, 11) and the indicated antibodies. (E) C57BL/6 mice bearing subcutaneous KCP3 tumours were treated with CD8 neutralising or isotype control antibody on days −3 and −1 via intraperitoneal injection. CD8 depletion was confirmed prior to TAK-981 treatment. Tumour-bearing mice were treated with 7.5 mg/kg TAK-981 on days 0, 3, 7, 11 and anti-CD8 or isotype control on days 2, 6 and 10. Data are shown as mean as mean±SEM, n=8 mice per group. Tumour growth was compared using two-way ANOVA (*p<0.05; **p<0.01; ***p<0.001; ****p<0.0001) with Dunnett’s multiple comparisons test. (F, G) C57BL/6 mice bearing subcutaneous KCP3 tumours were treated with 7.5 mg/kg TAK-981 on days 0, 3, 7, 11, and (F) anti-IFNAR1 or isotype control antibodies, or (G) anti-IFN-γ or isotype control antibodies were administered via intraperitoneal injection on days (−1, 2, 6, 10). Data are shown as mean as mean±SEM, n=8 mice per group. Tumour growth was compared using two-way ANOVA (p<0.05; **p<0.01; ***p<0.001; ****p<0.0001) with Dunnett’s multiple comparisons test. ANOVA, analysis of variance; PDAC, pancreatic ductal adenocarcinoma.
TAK-981 reduces KPC3 growth in a CD8 T cells and IFNAR dependent manner
Next, we investigated the functional roles of CD8 T cells and interferon signalling in response to TAK-981 treatment to reduce KPC3 tumour growth, using neutralising antibodies (figure 7E). CD8 T cells were efficiently depleted on α-CD8 treatment (online supplemental figure S12), resulting in a complete loss of TAK-981 efficiency to reduce KPC3 tumour growth (figure 7E). Partial loss of TAK-981 efficiency to reduce KPC3 tumour growth was observed on blocking the type I interferon receptor IFNAR (figure 7F), but not on blocking IFNγ (figure 7G). Combined, our data indicate that TAK-981 induces interferon signalling to stimulate an efficient immune response by activating CD8 T cells, NK cells and DCs in blood and lymphatic organs and by reducing B cells, contributing to its striking efficiency to reduce tumour growth in the syngeneic KPC3 PDAC model.
Discussion
Here, we demonstrate the potential of the SUMO E1 inhibitor TAK-981 for the treatment of PDAC via a double mode of action: by blocking cancer cell cycle progression and via an unexpected immunomodulatory mechanism. TAK-981 specifically blocked SUMO pathway function by forming a covalent adduct with SUMOs, blocking the SUMO E1 but not the ubiquitin E1s.39 40 TAK-981 blocked PDAC cell proliferation in the nanomolar range in vitro. PDAC cell lines showed increased G2/M populations in response to TAK-981 treatment, indicating defective mitosis. Microscopy experiments revealed persistent anaphase bridges, resulting in DNA bridges between daughter cells as well as the induction of micronuclei in response to TAK-981. Hundreds of SUMO target proteins were identified by proteomics in pancreatic cell lines, including many proteins involved in cell cycle regulation and genome integrity. In mice, TAK-981 profoundly reduced the growth of the KPC3 PDAC in syngeneic mice and to a lesser extent in immune-compromised NSG mice. Surprisingly, we noted a striking increase in the proportion of CD8 T cells, NK cells, DCs and specific sets of myeloid cells as well as a decrease in B cells, in peripheral blood and lymphatic organs, demonstrating strong immunomodulatory activity of TAK-981.
Modulation of the immune system by SUMO inhibition suggests an important second mode of action of SUMO signalling inhibitors that could be beneficial for the treatment of cancer. Increased CD8 T cell proportions were found within a few days after TAK-981 treatment, indicating a rapid response of the immune system to SUMO inhibition. Simultaneously, B cell numbers dropped nearly 4-fold in a single day, and started to decline 6 hours after the start of TAK-981 treatment, demonstrating rapid clearance of B cells from blood. The precise mechanism of action of this response remains to be established. However, most likely this includes interferon signalling as identified in our scRNA experiment and in our ex vivo experiments (figure 6), consistent with previous results on the role of SUMO to block interferon signalling and antiviral gene expression programmes in myeloid cells during innate sensing.24 25 55 56 The observed effects could be explained by TAK-981 stimulation of interferon-γ signalling, since increased interferon-γ signalling causes activation of CD8 T cells and a sharp decrease in B cells.57 58 This decrease in B cell infiltration in tumours might contribute to the mode of action of TAK-981, since B cells contribute to immune suppression in PDAC.59–61
Our data furthermore demonstrate the dependence of PDAC cells on ongoing SUMOylation for proper cell cycle progression. This is consistent with a wealth of literature on this topic as reviewed in.27 62 63 Mitotic defects in response to defective SUMO signalling were also frequently noted in cell culture experiments in a wide variety of cells and were first found in yeast.64 A study on the relevance of SUMO signalling for embryonic development demonstrated that SUMO E2-deficient embryos die at the early postimplantation stage due to mitotic defects including anaphase bridges.46 SUMO target proteins with important roles in mitosis include Topoisomerases, BLM, FoxM1, centromeric proteins, ANAPC4, AuroraB and Plk1.26 Our proteomics investigation confirmed most of these SUMO target proteins in PDAC cells and identified hundreds of other SUMO2 target proteins, as expected for a PTM that regulates cellular processes via group modification.65 Others have previously identified approximately 500 SUMO1 target proteins in PDAC and demonstrated dynamic alterations of SUMO1 targets in response to chemotherapy.66 These SUMO1 target proteins partially overlap with the SUMO2 target proteins identified in our screens. We have chosen to study SUMO2 target proteins since SUMO2 is the essential mammalian SUMO family member.67
Recently, another SUMO E1 inhibitor ML-93, was found to reduce PDAC growth in mice, but the inhibitory effect in vivo was rather modest, possibly due to the use of an immunodeficient mouse model.38 Furthermore, growth of HCT116 colorectal carcinoma and OCI-Ly10 DLBCL tumours was inhibited by TAK-981, when engrafted in nude mice.39 It is well known that a wide variety of cancer types are dependent on ongoing SUMO signalling.27 62 The surprising sensitivity of B cells to TAK-981 warrants investigation of TAK-981 treatment for B cell lymphomas. During the revision of our manuscript, a related paper was published, reporting similar findings in other tumour models.68 TAK-981 was shown to synergise with immune checkpoint blockade. Cooperativity of TAK-981 with other anticancer drugs remains to be investigated as well as the efficacy of TAK-981, possibly in combination with immune checkpoint blockade to treat PDAC patients. Phase I clinical trials for TAK-981 are ongoing for other types of tumours (NCT04381650, NCT04776018, NCT04074330, NCT03648372 and NCT04065555).40 Our data demonstrate the potential of the SUMO E1 inhibitor TAK-981 to treat PDAC, via a double mode of action, including cancer cell cycle inhibition and modulation of the immune system. This double mode of action is unique among anticancer drugs.
Methods
Immunohistochemical staining
Tissue microarrays containing 40 cases of pancreas adenocarcinoma, 5 cases of adjacent normal pancreas tissue and 5 cases of normal pancreas tissue, duplicate cores per case were purchased from Biomax (PA1001c, Biomax, USA). These were deparaffinised using xylene and washed in ethanol, after which endogenous peroxidase was blocked by incubation in a 0.3% hydrogen peroxide in methanol (Merck Millipore, Burlington, Massachusetts, USA) solution for 20 min. Heat-induced antigen retrieval was done with citrate buffer (10 mM, pH 6.0). After cooling, unspecific antibody-binding was blocked with Superblock solution (Thermo Fisher Scientific, Waltham, Massachusetts, USA) for 30 min and primary antibody; anti-SUMO1 (1:50 dilution, 21C7, University of Iowa) or anti-SUMO2/3 (1:100 dilution, 8A2, University of Iowa) was incubated overnight at 4 °C. The following day, slides were washed in PBS and incubated for 1 hour with polyhorseradish peroxidase solution (Immunologic, Duiven, the Netherlands) at room temperature. Antibody binding was developed with the DAB +chromogen (DAKO, Agilent Technologies, Santa Clara, California, USA) solution and the slides were counterstained with haematoxylin (Thermo Fisher Scientific). Immunodetection intensity was assessed in a semiquantitative manner in three categories: negative or absent immunodetection (0), vague or weak immunodetection (1) and strong positivity in the majority of cancer cells (2) (figure 1A). Scoring was highly concordant between tissue cores derived from the same patient despite these being scored independently.
Expression and survival analysis of SUMO pathway genes
To understand the transcriptional expression of SUMO pathway genes in pancreatic cancer, we employed a publicly available online tool, Expression Profiling Interactive Analysis 2 (GEPIA2) server using the TCGA (The Cancer Genome Atlas) and Genotype-Tissue Expression (GTEx) datasets.69 The GEPIA2 server contains data from 9667 tumours and 602 healthy tissues. Expression differences between these tumour tissue and the corresponding normal tissue in the GTEx database was obtained as ‘box plots’ using p value (cut-off) equal to 0.01, log2FC (cut-off) equal to 1 and ‘Match TCGA normal and GTEx data’.
The associations between different SUMO pathway genes and overall survival were plotted as Kaplan-Meier curves using the TCGA dataset and Kaplan-Meier plotter dataset (https://kmplot.com/analysis/index.php?p=service). The transcript identifiers for the SUMO pathway genes are SUMO1 (ENSG00000116030.16), SUMO2 (ENSG00000188612.11), SUMO3 (ENSG00000184900.15), SAE1 (ENSG00000142230.11), UBA2 (ENSG00000126261.12) and UBE2I (ENSG00000103275.18).
Compounds and reagents
The SUMO E1 inhibitor TAK-981 was provided by Takeda Development Center Americas (Lexington, Massachusetts, USA). TAK-981 was dissolved in DMSO for in vitro use. For in vivo use, TAK-981 was dissolved in 20% hydroxypropyl β-cyclodextrin (HPBCD; H-107, Sigma-Aldrich) at pH 4.
Cell lines
Pancreatic cancer cell lines (MiaPaCa2, PANC1, HPAF) were obtained from the Department of Veroscience, Erasmus MC, Rotterdam. PatuS, PatuT and VH10 were obtained from Department of Molecular Cell Biology of the LUMC. BxPC3 and KPC3 cell lines were obtained from the Department of Gastroenterology and Hepatology, Leiden University Medical Center (LUMC). MiaPaCa2, PANC1, HPAF were cultured in RPMI 1640 medium (Life Technologies) supplemented with 10% Fetal Bovine Serum (FBS, Biowest, South America Origin) and 5% Penicillin-Streptomycin (P/S, Life Technologies). BxPC3 and KPC3 cells were cultured in DMEM/F12 medium (Life Technologies) supplemented with 10% Fetal Bovine Serum and 2.5% Penicillin-Streptomycin, 10 mM HEPES (Life Technologies) and 5 ug/mL Gentamycin (Life Technologies). Cells were cultured in a humidified incubator at 37 °C with 5% CO2. Cells were regularly tested for Mycoplasma contamination and confirmed to be negative. Cell identity was analysed by STR profiling.
Lentivirus production and transduction
For lentiviral production of inducible SAE knockdown shRNAs, HEK 293 T cells were transfected with lentiviral packaging plasmids and plasmids containing SAE1, SAE2 shRNAs or nontargeting control shRNA as described previously.45 Lentivirus was harvested 48 hours after the transfection. For shRNA-mediated inducible knockdown experiments, MiaPaCa2, PANC1 and HPAF cells were infected at a multiplicity of infection (MOI) of three with third generation lentiviruses encoding shRNAs targeting SAE or nontargeting control shRNA. Transductions were performed in RPMI containing 8 µg/mL polybrene. Medium was replaced after 24 hours of infection. To obtain stable cell lines, selection was started 24 hours after transduction using 600 µg/mL Geneticin (G418; Life Technologies). To induce the expression of the shRNAs, these cells were treated with 100 ng/mL doxycycline for the indicated time point.
Colony formation assay
For the colony formation assay, cells were seeded at a low density of 1000–3000 cells per well in 6-well plates. For the SUMO E1 knockdown MiaPaCa2, HPAF and PANC1 cells stabling expressing SAE1 and SAE2 or nontargeting inducible shRNAs were treated with 100 ng/mL doxycycline for the indicated time point. Cells were either treated once for 4 days with TAK-981 or continuously with the indicated concentrations of TAK-981 and for control with 0.1% DMSO. Colonies were grown for 10–15 days, medium was removed from the cells and cells were fixed with ice cold 100% methanol for 20 min at −20°C. Colonies were stained with 0.05% crystal violet solution (Sigma, C0775) for 30 min. Crystal violet solution was removed and plates were washed with water and dried overnight. Subsequently, crystal violet was solubilised with 500 µL methanol for 30 min and absorbance was measured at 595 nm on a plate reader (Victor X3, Perkin Elmer).
WST-1 proliferation assay
Proliferation rates of pancreatic cell lines and the VH10 primary cell line were determined using the WST-1 assay (Roche Applied Science). In brief, MiaPaCa2, PANC1, HPAF, PatuS, PatuT and VH10 cells were seeded in 96-well plates at 500 cells per well. The next day, cells were treated with the indicated concentrations of TAK-981 and for control with 0.1% DMSO. The WST-1 assay was carried out 96 hours after the start of the inhibitor treatment. Cells were incubated with WST-1 at 37°C for 4 hours. The absorbance was measured at 450 nm using a plate reader (Victor X3, Perkin Elmer).
Flow cytometry
For cell cycle analysis, MiaPaCa2, PANC1, HPAF, BxPC3, PatuS and PatuT cells were treated with 0.5 µM TAK-981 or 0.1% DMSO for the indicated times. Cells were harvested by trypsinisation, washed once in PBS and resuspended in 1 mL of PBS. Four ml of 100% ethanol was added and the cells were fixed at 4°C overnight. On the day of flow cytometry analysis, the cells were first centrifuged at 500 × g for 2 min, the supernatant was removed and the cells were washed with PBS and 2% calf serum. Then, the cells were pelleted again and resuspended in 500 µL of PBS complemented with 2% calf serum, 25 µg/mL propidium iodide (Sigma-Aldrich, P4170) and 100 µg/mL RNAse A (Sigma-Aldrich, R6513). Cellular DNA content was determined by flow cytometry with the BD LSRII system and BD FACS DIVA Software (BD Biosciences Clontech). Cell cycle analysis was performed with FlowJo V.10 software, using the Watson (pragmatic) model.
For blood immunophenotyping, 25 µL blood was withdrawn from mice treated with TAK-981 or solvent control at indicated timepoints via vein puncture using heparin coated tubes. Red blood cells were lysed by addition of 200 µL RBC lysis buffer (LUMC). Samples were mixed briefly to resuspend cells and incubated for 10 min at room temperature. Cells were centrifuged at 500 × g for 2 min and taken up in FACS buffer (PBS with 0.5% FBS) and centrifuged again at 500 × g for 2 min.
For the analysis of immune cells in spleen, lymph nodes and bone marrow, mice were sacrificed at indicated time points. Whole bone marrow was isolated from femurs and tibias, muscles and flesh was removed from bones with scissors and forceps and clean bone was flushed 3 × with 10 mL cold media using 25G needles. Flushed bone marrow was centrifuged at 500 × g for 5 min. Pellets were dissociated in 1 mL red blood lysis buffer for 30 s, and 10 mL complete media was added. Single-cell suspensions were prepared by filtering through a 70 µm cell strainer (BD Biosciences). Cells were pelleted and dissociated with 5 mL complete medium before plating. Lymph nodes and spleen single cell suspensions were prepared by gently dissociating them with 3 mL syringe plungers over 70 µm cell strainers. Cells were pelleted and erythrocytes were lysed with RBC lysis buffer. Cells were dissociated in 5 mL complete media before plating.
For immune cell infiltration, mice were sacrificed and spleens, lymph nodes and tumours were excised. Single-cell suspension of spleen and lymph nodes were generated by mechanical disruption. Tumours were cut into small pieces and incubated with liberase (Roche) for 15 min at 37°C and then passed over 70 µm cell strainers. Cells were washed twice with FACS buffer.
For cell surface staining, cells were first resuspend with 2.4G2 Fc block (Biosciences, cat. 553141) on ice for 10 min. Cells were pelleted and resuspended with Zombie Aqua Fixable Viability Kit (Biolegend, cat. 423102) in PBS at room temperature in the dark for 10 min. Cells were pelleted and washed with PBS. Cells were then incubated with specific antibodies as detailed in online supplemental table S1 for 20 min on ice in the dark. For the FoxP3 staining, the eBioscience FoxP3/Transcription Factor staining buffer set was used according to the one-step protocol for intranuclear proteins. Samples were acquired on a BD Fortessa flow cytometer or 5-laser Cytek Aurora and results were analysed using the FlowJo software.
Supplemental material
In vivo tumour models
All animal experiments were executed in accordance with responsible science with animals (2021) and reviewed by the animal welfare body Leiden. All animals were housed and cared for in accordance with the Experiments on Animals Act (Wod, 2014). In this study 8 to 10 week old male C57BL/6 mice were purchased from Charles River and 10–12 weeks male and female (NOD). Cg-PrkdcscidIl2rgtm1Wjl/SzJ (NSG) mice53 were bred in house. Animals were housed in individually ventilated cages under specified pathogen-free conditions in animal facilities of our institute.
Tumours were inoculated by subcutaneous injection in the right flank of 100,000 KPC3 cells expressing luciferase (KPC3-LUC2) in 100 µL PBS. When tumours were palpable, 14–18 days after implantation, treatments were started with 0.2 mL of 7.5 mg/kg TAK-981 in 20% HPBCD or with vehicle control by retro-orbital injection twice weekly. Tumour growth was monitored two or three times a week using a digital vernier calliper, until mice had be to sacrificed due to tumour growth (tumour volume reaching 1500 mm3) or when tumours were ulcerated, according to local ethical guidelines. The mean tumour volume was calculated using the formula: volume (V)= W2×L/2, where W and L are the width and length of the tumour, respectively. The statistical significance of tumour growth over time was determined using repeated measures of two-way analysis of variance with Tukey multiple comparisons of means as a post hoc test to evaluate differences between two groups.
To investigate whether tumour growth inhibition by TAK-981 is dependent on type I and/or type II IFN signalling and/or CD8 T cells, we performed antibody neutralisation experiments through intraperitoneal injection when the tumours were palpable in C57BL/6 mice. To deplete CD8 T cells, mice were injected with 100 ug anti-CD8 antibody (Clone 2.42 in house produced) or the isotope control antibody IgG2b (clone LTF2, BioXcell), −3 and −1 days prior to TAK-981 treatment. Depletion of CD8 T cells was checked using flow cytometry of blood samples on day 0. Later on during the experiment, anti-CD8 antibody or control were injected 24 hours prior to TAK-981 treatment.
IFNAR blockade was carried out by injection of 1 mg/mouse anti-mouse IFNAR1 antibody (clone MAR1-5A3, BioXcell), 24 hours prior to each dose of TAK-981. The isotype-matching antibody IgG1 (clone MOPC-21, BioXcell) was used as control. IFN-γ neutralisation was carried out by injection of 200 µg/mouse anti-mouse IFN-γ neutralising antibody (clone XMG1.2 BioXcell) 24 hours prior to each dose of TAK-981. The isotype matching antibody IgG1 (clone HRPN, BioXcell) was used as control.
Western blotting
Whole cell lysates from pancreatic cancer cells lines treated with increasing concentration of TAK-981 or with 0.1% DMSO were prepared on ice with SNTBS lysis buffer (2% SDS, 1% NP40, 50 mM Tris pH 7.5, 150 mM NaCl) and boiled at 100 °C for 10 min. Proteins were separated on precast 4%–12% Bis-Tris gradient gels (Thermo Fischer Scientific). Separated proteins were subsequently transferred to Amersham Protran Premium 0.45 µm nitrocellulose membranes (Sigma-Aldrich) using a submarine system. Membranes were stained with Ponceau S solution for visualisation of total protein content and blocked with PBS containing 8% milk powder and 0.05% Tween-20 for 1 hour. Protein samples were incubated with primary antibodies against SUMO1 at 1:1000 dilution (mouse monoclonal 21C7, Thermo Fisher Scientific), SUMO2/3 at 1:500 dilution (mouse monoclonal 8A2, University of Iowa) and ubiquitin at 1:1000 dilution (sc8017, Santa Cruz). Donkey anti-rabbit IgG-HRP and goat anti-mouse IgG-HRP were used as secondary antibodies at 1:2000 dilution in 8% milk. Signal was detected using Pierce ECL2 (Life Technologies) and captured using RX medical film (Fuji).
Ex vivo CD8 T cell coculture and pSTAT1 signalling after TAK-981 treatment
CD8 T cells were isolated from spleen and lymph nodes of Pmel-1 TCR transgenic mice70 using the mouse CD8 T lymphocyte enrichment set—DM (BD Biosciences; Cat# 558471). For ex vivo stimulation of the CD8 T cells from Pmel-1 TCR transgenic mice, dendritic D1 cells were harvested using 2 mM EDTA and matured by adding 5 µg/mL LPS for 20–24 hours. The matured D1 cells (2×10⁵) were seeded in wells of a 24-well plate and loaded for 1–2 hour with 1 µg/mL short EGP peptide.71 CD8 T cells were then added (1×10⁶/well). Plates were centrifuged for 1 min at 1000 rpm to initiate cell contact and cocultured for 20–24 hours after which loosely attached cells were transferred to fresh 24-wells plates at a concentration of 0.5×10⁶ cells/well in the presence of recombinant mouse cytokine IL-7 (2 ng/mL; R&D Systems).
The next day, T cells were treated with 150 nM TAK-981 or 0.1% DMSO for the indicated time points. Whole cell lysates were prepared from the loosely attached CD8 T cells on ice with SNTBs lysis buffer (2% SDS, 1% NP40, 50 mM Tris pH 7.5, 150 mM NaCl) and boiled at 100 °C for 10 min. Proteins were separated on precast 4%–12% Bis-Tris gradient gels (Thermo Fischer Scientific). Protein samples were incubated with primary antibody (Cell Signaling Technology) at 1:1000 dilution for pSTAT1 (#9167), STAT1 (#14994), β-tubulin (#2128) and SUMO2/3 antibody (mouse monoclonal 8A2, University of Iowa) was incubated at 1:500 dilution. Donkey anti-rabbit IgG-HRP and goat anti-mouse IgG-HRP were used as secondary antibodies at 1:2000 dilution in 8% milk. Signal was detected using Pierce ECL2 (Life Technologies) and captured using RX medical film (Fuji).
Isolation of mouse splenocytes and ex vivo IFNAR1 and IFN-γ blockage
Spleens were harvested from euthanised mice. Single cell suspensions from spleens were prepared by gently dissociating cells with 3 mL syringe plungers over 70 µm cell strainers. Cells were pelleted and erythrocytes were lysed with RBC lysis buffer. Cells were dissociated in complete medium, counted and plated. Splenocytes were treated either with 10 µg/mL anti-IFNAR1 or IFN-γ neutralising antibodies 3 hours prior to 150 nM TAK981 treatment for indicated time points. Whole cell lysates were prepared from the splenocytes on ice with SNTBs lysis buffer. Protein samples were size separated by SDS-PAGE and immunoblotted with antibodies against pSTAT1 Tyr701, STAT1 and SUMO2/3.
Human CD8 T cell isolation and activation
Human CD8 T cells were isolated via MACS kit from a buffycoat according to manufacturer’s protocol (Miltenyi Biotec). For ex vivo activation CD8 T cells (1×10⁶ cells/mL) were cocultured with irradiated PBMCs (1×10⁶ cells/mL) and EBV-JY cells (1×10⁶ cells/mL) cells in presence of 800 ng/mL PHA and 100 U/mL IL-2 (LUMC) in IMDM supplemented 10% Human Pooled Serum (Sanquin) and Penicillin-Streptomycin-Glutamine (Gibco, Thermo Fischer scientific). Naïve and activated CD8 T cells were treated with 150 nM TAK-981 or DMSO control for indicated time points for qPCR and pSTAT1 protein analysis.
qPCR
Total RNA was extracted from activated mouse CD8 T cells and human CD8 T cells, using SV total RNA isolation system (Promega). cDNA was synthesised by reverse transcription of 0.5–1 µg of total RNA using random primers (Invitrogen) and ImProm-II reverse transcriptase (Promega) according to manufacturer’s protocol. Real-time PCR was performed using SYBR Green PCR Mastermix (Applied Biosystems) and a CFX384 real-time PCR detection system (Bio-Rad). Primer sequences are listed in the reagent table. CT values of genes of interest were normalised against the geometric mean of housekeeping genes (mouse: UBC, Ptp4a2, Mzt2) and (human: TBP, RPS11, Actin, SRPR).
Cytokine analysis
Mouse CD8 T cells were treated with 150 nM TAK-981 or DMSO for the indicated time points. Supernatants were harvested and stored frozen at −80°C. Samples were diluted 2× and analysed using a customised multiplex cytokine (Luminex) ELISA kit of R&D systems according to the user manual. Samples were analysed with the Bio-Rad Bio-Plex 200 System. Based on the standard curves, the programme of the Bio-Plex 200 system automatically calculated the concentrations of the different cytokines/chemokines.
Cell hashing and library preparation for single cell sequencing
C57BL/6 mice were treated with 7.5 mg/kg TAK-981 or vehicle at days 0, 3, 6. At day 7, lymph nodes and spleen were harvested. NK cells were enriched from spleens using MagniSort mouse NK cell enrichment kit (Thermo fisher Scientific). Cell hashing was performed according to the manufacturer’s protocol (TotalSeq anti-mouse Hashtag reagent- Biolegend).
Single cell gene expression libraries were generated on the 10× Genomics Chromium platform using the Chromium Next GEM Single Cell 5’ Library & Gel Bead Kit V.2 and Chromium Next GEM Chip K Single Cell Kit (10× Genomics) according to the manufacturer’s protocol. TotalSeq-C hashtag libraries were generated using the Chromium Single Cell 5' Feature Barcode Library Kit (10× Genomics) according the manufacturer’s protocol. Gene expression and hashtag libraries were sequenced on a NovaSeq 6000 S4 flow cell using V.1.5 chemistry (Illumina). Cell Ranger software V.6.0.1 (10× Genomics) was used for library demultiplexing, fastq file generation and read alignment. The resulting matrices contain the number of UMIs per gene or per antibody for each cell. Raw FASTQ files were aligned to the GRCm38 (https://support.10xgenomics.com/single-cell-gene-expression/software/release notes/build#mm10_2020A) mouse reference genome, gene and UMI counts were carried out using 10× Genomics Cell Ranger 6.0.1. ‘multi’ pipeline.72 CellRanger h5 output file was loaded into Seurat V.4.0.173 and downstream analysis was performed following the tool recommendation. In short, cells that showed expression of fewer than 200 genes and genes expressed in less than five cells were excluded, resulting in 8321 cells for downstream analysis. Based on HTO enrichment and using the Seurat implementation of the MULTIseqDemux algorithm74, cells were then demultiplexed into the eight pooled samples. This resulted in more than 90% (7468) of all the cells being assigned to a unique HTO barcode. Sixty-eight (68) cells were further removed because they showed a mitochondrial gene content greater than 10%. Next, cells assigned to lymph nodes and spleen samples were split into two different subsets. For each subset, expression measurements were then normalised using the ‘LogNormalise’ function with a scale factor of 10 000 and variable features were identified using the ‘FindVariableFeatures’ function. Expression values per gene were scaled and centred using the ‘ScaleData’ function. During this step unwanted sources of variants like sample of origin, ribosomal and mitochondrial content were regressed out. From the principal components analysis dimensionality reduction, cell clustering was carried out using 17 components for the spleen and 14 for the lymph node subset. Clustering was performed using Seurat functions ‘FindNeighbors’ and ‘FindClusters’ and identified through the shared correlation strength and using a resolution of 0.3 for both subsets. To visualise the cells and their clusters, a t-distributed stochastic neighbour embedding (tsne) plot was used. Cell clusters were annotated by identifying deferentially expressed genes using the ‘FindAllMarkers’ function. Gene ontology and pathway enrichment were performed with Metascape.75
His10-SUMO2 purification for identification of SUMO2/3 target protein
His10-SUMO2 conjugates were purified essentially as described previously.26 In brief, PANC1 and MiaPaCa2 cells expressing His10-SUMO2 were washed, scraped, and collected in ice-cold PBS. For total lysates, a small aliquot of cells was kept separately and lysed in 2% SDS, 1% N-P40, 50 mM TRIS pH 7.5 and 150 mM NaCl. The remaining parts of the cell pellets were lysed in 6 M guanidine-HCl pH 8.0 (6 M guanidine-HCl, 0.1 M Na2HPO4/NaH2PO4, 10 mM TRIS, pH 8.0). The samples were snap-frozen using liquid nitrogen, and stored at −80 °C until further processing. For SUMO purification, cell lysates were first thawed at room temperature and sonicated for 5 s, using a sonicator (Misonix Sonicator 3000, EW-04 711–81) at 30 W to homogenise lysates. Protein concentrations were determined using the bicinchoninic acid (BCA) protein assay reagent (Thermo Scientific) and lysates were equalised. Imidazole was added to the lysates to a final concentration of 50 mM. Prewashed Ni-NTA beads (Qiagen, 30210) were added to the lysates and incubated overnight at 4 °C. Ni-NTA beads were washed with wash buffer 1–4, respectively; Wash buffer 1: 6 M Guanidine-HCL, 100 mM sodium phosphate, 10 mM Tris, 10 mM imidazole, 5 mM β-mercaptoethanol, 0.2% Triton X-100. Wash buffer 2: 8 M urea, 100 mM sodium phosphate, 10 mM Tris, 10 mM imidazole, 5 mM β-mercaptoethanol, 0.2% Triton X-100. Wash buffer 3: 8 M urea, 100 mM sodium phosphate, 10 mM Tris, 10 mM imidazole, 5 mM β-mercaptoethanol, 0.2% Triton X-100. Wash buffer 4: 8 M urea, 100 mM sodium phosphate, 10 mM Tris, 5 mM β-mercaptoethanol, 0.1% Triton X-100. For samples used for subsequent mass spectrometry analysis, 0.2% Triton X-100 was included in Wash 1% and 0.1% Triton X-100 was included in Wash 2. Wash 3 and Wash 4 did not contain Triton X-100. Purified proteins were twice eluted in one bead volume of 7 M urea, 100 mM sodium phosphate, 10 mM Tris and 500 mM imidazole pH 7.0.
Proteomics sample preparation and mass spectrometry
His10-SUMO2 purified samples were concentrated using a 100 kDa cut-off filter and diluted with ammonium bicarbonate to an end concentration of 50 mM. Samples were reduced with DTT in two steps, first to 1 mM DTT and subsequently to 6 mM DTT. In between the reduction steps, samples were alkylated using 5 mM chloroacetamide. Proteins were first digested with Lys-C (Promega, VA1170) in a 1:100 enzyme-to-protein ratio for 5 hours. Peptides were diluted with 50 mM ammonium bicarbonate before trypsin (Promega, V5111) digestion. Trypsin digestion was carried out at a 1:50 enzyme-to-protein ratio, overnight and in the dark at RT. After digestion, peptides were acidified with 2% TFA and then desalted and concentrated on triple-disc C18 reversed phase StageTips. Peptides were eluted with acetonitrile (ACN), vacuum dried and dissolved in 0.1% formic acid (FA) prior to liquid chromatography-tandem mass spectrometry.
All analyses were performed on an EASY-nLC 1000 system (Proxeon, Odense, Denmark) connected to a Q-Exactive Orbitrap (Thermo Fisher Scientific, Germany) through a nano-electrospray ion source. Separation of peptides was achieved using a 15 cm analytical column with an inner diameter of 75 µm, packed in-house with 1.9 C18-AQ beads. For the identification of SUMOylated proteins, peptides were analysed over a 120 min gradient from 2% to 95% ACN in 0.1% FA. The mass spectrometer was operated in data-dependent acquisition mode using a top seven method. Full-scan MS spectra were acquired at a target value of 3E6 and a resolution of 70 000. The higher-collisional dissociation tandem MS/MS were acquired using a target value of 1E5, a resolution of 35 000 and a normalised collision energy of 25%. The maximum injection times for MS1 and MS2 were 50 and 120 ms, respectively.
MaxQuant mass spectrometry data analysis
For the analysis of SUMOylated proteins in pancreatic cell lines, three experimental conditions were studied in biological triplicate and each sample was measured with two technical repeats, which resulted in a total of 18 MS runs. All RAW data were analysed using MaxQuant software V.1.6.14 according to49 and its integrated search engine Andromeda with standard settings with the following modifications. The search was performed against an in silico digested reference proteome for Homo sapiens obtained from Uniprot.org (16 October 2020). Database searches were performed with trypsin allowing three missed cleavages. Carbamidomethyl was set as fixed modification and the variable modifications of oxidation (M) and acetyl (protein N-term) were allowed with a maximum number of 3 modifications per peptide. Label Free Quantification was performed not enabling the Fast LFQ algorithm. Match-between-runs was enabled with a match time window of 0.7 min and an alignment time window of 20 min.
For identification of SUMOylated proteins, MaxQuant ‘protein groups’ output tables were subsequently filtered and statistically analysed using the software package Perseus, V.1.6.14.49 50 Proteins ‘only identified by site’, ‘reverse’ or ‘contaminants’ were removed before LFQ intensities were log2 transformed. Replicates of the same condition were grouped together. The data were filtered for protein groups, which had at least three valid values in at least one group. Missing values were replaced by imputation using normally distributed values based on the total data matrix with a randomised 0.3 (log2) width and a 1.8 (log2) down shift. To obtain p values and log2 differences of the protein LFQ intensities in different conditions, a series of two-sided two samples t-tests were performed with a Permutation-based FDR of 0.05 and an S0=0.1. Proteins were considered to be SUMOylated when they were significantly enriched in any of the His10-SUMO2 expressing conditions tested against the parental condition. Statistical analysis was performed in Perseus and further processed in Microsoft Excel 365 for comprehensive data browsing. For data visualisation, and network analysis, SUMOylated proteins in both cell lines were processed in Cytoscape 3.8.276 with the following add-in Apps: stringApp 1.6.0, MCODE 2.0.0 and ClueGO 2.5.7.
Microscopy
Cells for immunofluorescence microscopy were cultured on glass slides in six-well plates. Cells were treated with 0.5 µM TAK-981 or 0.1% DMSO for the indicated times. Cells were fixed with 4% paraformaldehyde for 15 min at room temperature in PBS, and the cells were permeabilised with 0.1% Triton X-100 in PBS for 15 min. Next, the cells were washed twice with PBS and once with PBS plus 0.05% Tween-20 (PBS-T). The cells were then blocked for 10 min with 0.5% blocking reagent (Roche) in 0.1 M Tris, pH 7.5, and 0.15 M NaCl (TNB), and treated with primary antibody as indicated in TNB for 1 hour. Coverslips were washed five times with PBS-T and incubated with the secondary antibodies as indicated in TNB for 1 hour. Next, the coverslips were washed five times with PBS-T and dehydrated by washing once with 70% ethanol, once with 90% ethanol, and once with 100% ethanol. After drying the cells, the coverslips were mounted onto a microscopy slide using citifluor/Hoechst solution (500 ng/mL) and sealed with nail varnish.
Live cell microscopy
MiaPaCa2 cells were plated on µ-Dish 35 mm, high glass bottom (Martinsried, IBIDI, Germany) 24 hours prior to imaging. Two hours before imaging SiR-DNA (Spirochrome) was added at a final concentration of 500 nM. Just before live imaging, 0.1% DMSO or 0.5 µM TAK-981 was added. Time lapse imaging was carried out at 37°C, 5% CO2 for 72 hours using a Leica AF6000 LX microscope. Images were acquired every 5 min using 20×0.75 DRY objective. LAS AF software (Leica) was used to process images. The resulting videos are available as online supplemental movies S1 and S2.
Supplementary video
Supplementary video
Data availability statement
Data are available in a public, open access repository. Data are available on reasonable request. The mass spectrometry proteomics data have been deposited to the ProteomeXchange Consortium via the PRIDE partner repository with the dataset identifier PXD024521.77 The scRNA data have been deposited in NCBI’s Gene Expression Omnibus and are accessible through GEO Series accession number GSE189576.
Ethics statements
Patient consent for publication
Ethics approval
The licence was issued by the Central Authority for Scientific Procedures on Animals (CCD) based on a positive advice by the Animal Ethics Committee Leiden (AVD116002017858).
Acknowledgments
We thank our team members and other colleagues including Marit van Elsas, Douwe Bosma, Manon van der Ploeg, Jannie Borst, Susan Kloet, Ferry Ossendorp, Marcel Camps and Floor van Haften for reagents, advice, support and experimental help. We thank Takeda Development Center Americas (Lexington, MA), for providing TAK-981 and thank Dr Allison Berger (Takeda) and Laura Claessens for critically reading the manuscript.
References
Supplementary materials
Supplementary Data
This web only file has been produced by the BMJ Publishing Group from an electronic file supplied by the author(s) and has not been edited for content.
Footnotes
Twitter @HombreRro
LJACH and TvH contributed equally.
Correction notice This article has been corrected since it was first published. The open access licence has been updated to CC BY.
Contributors Conception and design of the study: SK, RA, NFCCdM, LJACH, TvH and ACOV. Acquisition of data and/or analysis and interpretation of data: SK, MJAS, JSK, IJdG, MS, DR, RG-P, MV-dV, JR, RA, NFCCdM, LJACH, TvH and ACOV. Drafting of the manuscript: SK and ACOV. Guarantor ACOV. All authors commented on and approved the final version of the manuscript submitted for publication.
Funding The laboratory of ACOV is supported by the European Research Council (ERC, 310913) and the Dutch Research Council (NWO, 724016003).
Competing interests None declared.
Provenance and peer review Not commissioned; externally peer reviewed.
Supplemental material This content has been supplied by the author(s). It has not been vetted by BMJ Publishing Group Limited (BMJ) and may not have been peer-reviewed. Any opinions or recommendations discussed are solely those of the author(s) and are not endorsed by BMJ. BMJ disclaims all liability and responsibility arising from any reliance placed on the content. Where the content includes any translated material, BMJ does not warrant the accuracy and reliability of the translations (including but not limited to local regulations, clinical guidelines, terminology, drug names and drug dosages), and is not responsible for any error and/or omissions arising from translation and adaptation or otherwise.