Article Text

Abstract
Objective Human white adipose tissue (AT) is a metabolically active organ with distinct depot-specific functions. Despite their locations close to the gastrointestinal tract, mesenteric AT and epiploic AT (epiAT) have only scarcely been investigated. Here, we aim to characterise these ATs in-depth and estimate their contribution to alterations in whole-body metabolism.
Design Mesenteric, epiploic, omental and abdominal subcutaneous ATs were collected from 70 patients with obesity undergoing Roux-en-Y gastric bypass surgery. The metabolically well-characterised cohort included nine subjects with insulin sensitive (IS) obesity, whose AT samples were analysed in a multiomics approach, including methylome, transcriptome and proteome along with samples from subjects with insulin resistance (IR) matched for age, sex and body mass index (n=9). Findings implying differences between AT depots in these subgroups were validated in the entire cohort (n=70) by quantitative real-time PCR.
Results While mesenteric AT exhibited signatures similar to those found in the omental depot, epiAT was distinct from all other studied fat depots. Multiomics allowed clear discrimination between the IS and IR states in all tissues. The highest discriminatory power between IS and IR was seen in epiAT, where profound differences in the regulation of developmental, metabolic and inflammatory pathways were observed. Gene expression levels of key molecules involved in AT function, metabolic homeostasis and inflammation revealed significant depot-specific differences with epiAT showing the highest expression levels.
Conclusion Multi-omics epiAT signatures reflect systemic IR and obesity subphenotypes distinct from other fat depots. Our data suggest a previously unrecognised role of human epiploic fat in the context of obesity, impaired insulin sensitivity and related diseases.
- obesity
- diabetes mellitus
- obesity surgery
Data availability statement
Proteome data: ProteomeXchange Consortium via the PRIDE partner repository.59 Raw methylome outputs are available from Arrayexpress under the accession number E-MTAB-10999. Transcriptome table is available as supplementary table 7. Raw trascriptome data can be made available upon direct request to the corresponding authors.
This is an open access article distributed in accordance with the Creative Commons Attribution Non Commercial (CC BY-NC 4.0) license, which permits others to distribute, remix, adapt, build upon this work non-commercially, and license their derivative works on different terms, provided the original work is properly cited, appropriate credit is given, any changes made indicated, and the use is non-commercial. See: http://creativecommons.org/licenses/by-nc/4.0/.
Statistics from Altmetric.com
Significance of this study
What is already known on this subject?
Adipose tissue (AT) is a complex organ contributing to metabolism beyond its role as a storage for excess fat.
AT distribution contributes to metabolic sequelae of obesity with visceral fat accumulation being associated with less favourable metabolic and clinical traits.
Visceral AT depots exhibit specific features regarding their development, composition, metabolism and immunological functions, warranting a critical approach accommodating these characteristics to elucidate their individual contributions to clinical phenotypes and disease development.
Among visceral ATs, mesenteric ATs and epiploic ATs (epiAT) have not been deeply characterised in the context of obesity, insulin resistance (IR) and type 2 diabetes (T2D).
Significance of this study
What are the new findings?
EpiAT exhibited unique features leading to a clear separation of epiAT samples from other studied visceral ATs (omental and mesenteric) in all omics layers (methylome, transcriptome and proteome).
EpiAT was characterised by an upregulation of several genes and proteins belonging to catabolic pathways, short chain fatty acid (SCFA) production as well as branched-chain amino acids degradation, and displays a unique methylation signature suggesting a distinct developmental origin of this particular depot.
EpiAT showed the strongest separation between insulin sensitive (IS) and insulin resistant (IR) states in obesity, displaying the most marked differences between these two states in transcriptome and proteome signatures.
IR in epiAT was associated with an upregulation of various infection and inflammatory pathways, including pathogenic Escherichia coli infection, macrophage and toll-like associated as well as chemokine signalling, whereas IS was associated with increased fatty acid and SCFA metabolism, suggesting a potential sentinel role of this depot in mediating signals from the gut.
Several key driver proteins’ underlying modules associated with IR in epiAT were associated with characteristic clinical features and AT gene expression related to obesity and T2D, suggesting a precursory role in metabolic disease development.
How might it impact on clinical practice in the foreseeable future?
Within visceral AT, specific AT depots such as epiAT may drive the clinically emerging subphenotypes of IR and T2D in obesity.
EpiAT is a potentially underrated depot contributing to metabolic health and disease in obesity, which needs to be accounted for in further studies.
Introduction
The role of white adipose tissue (AT) in obesity and systemic insulin signalling has already been extensively studied, yet many questions remain unanswered. One concept which arose from previous studies is the classification of human obesity as either insulin sensitive (IS) or insulin resistant (IR).1 These phenotypes have been linked to different patterns of whole-body AT distribution.2 Visceral fat accumulation has been associated with less favourable metabolic and clinical traits.3 Ample research comparing mainly subcutaneous AT (scAT) and omental AT (omAT) suggests several AT-depot-specific signatures related to development, cellular and extracellular matrix composition, metabolism, inflammation and immunological functions.4–6 It thus seems promising to further subdivide visceral AT into different subdepots and investigate their characteristics in association with clinical phenotypes.
Despite their location along the small and the large intestines, mesenteric AT (mesAT) and epiploic AT (epiAT) are two depots rarely assessed in studies of human AT. MesAT has been investigated in the context of inflammatory bowel disease, where it expands and becomes fibrotic and inflamed, a phenomenon termed ‘creeping fat’.7 8 However, it has also been shown to exhibit unique metabolic features compared with other visceral AT locations.9 The epiAT, also referred to as appendices epiploicae, consists of 50–100 lobules along the human colon, each approximately 2–5 cm in size.10 This tissue had only been sporadically studied, mostly in the context of mesenterial infarction,11 before recently a possible link to obesity was proposed.12 Since it is not present in rodents and its harvest from the human colon is rarely performed, studies in epiAT remain few and are limited by small sample sizes as well as a lack of in-depth characterisation.
This study aims at identifying depot-specific AT patterns of methylome, transcriptome and proteome as well as uncovering possible key drivers and pathways associated with IR, with focus on to the understudied epiAT. We present an extensive characterisation of four human ATs (abdominal subcutaneous, omental, mesenteric and epiploic) from patients with obesity and with or without impaired glucose metabolism. Starting from a multiomics-based comparison of these depots in IS obesity, we subsequently compared each depot between age-matched, sex-matched and body mass index (BMI) matched patients with IS and IR. AT differences and associations to the phenotype were then validated in a larger cohort, adding anthropometric, clinical and immunohistochemistry data.
Methods
Study subjects and AT samples collection
This study included 70 patients with obesity at the Leipzig University Medical Center. All subjects gave their written informed consent before participating in this study. AT was collected during laparoscopic Roux-en-Y gastric bypass surgery. ScAT was collected from the incision of the first trocar in the left paramedian mid-abdomen, omAT from the mid of the pars libera of the greater omentum, mesAT from the mesenterium of the mid-jejunum, close to the bowel wall, and epiAT was sampled from the appendices epiploicae of the transverse colon (figure 1).

Collection sites and study design. AT, adipose tissue; BMI, body mass index; FACS, fluorescence activated cell Sorting; SVF, stromal vascular fraction.
Blood, immunohistochemistry and gene expression analyses were performed in all subjects and routinely assessed clinical and anthropometric data were recorded (table 1). Based on clinically pre-diagnosed type 2 diabetes (T2D), subjects were divided into two groups (T2D and no T2D (nT2D)) for further analyses. To rule out IR as a confounding variable in multiomics AT comparisons, only subjects without IR (=IS) were considered. Assignment from the nT2D to the IS subgroup was based on following criteria: glycated haemoglobin (HbA1c) <5.8% (39.89 mmol/mol), homeostatic model assessment of insulin resistance (HOMA-IR) <2.5 and no diabetes medication. All other subjects were considered IR, regardless of whether T2D had previously been diagnosed or not. Nine subjects met the IS subgroup requirements and were included in the multiomics analyses. Systemic and AT inflammatory statuses were explored via routine measurements of metabolic markers and immunohistochemistry methods described in online supplemental methods. Circulating adipokines and apolipoproteins were measured by mass spectrometry as described previously.13 Fluorescence activated cell sorting (FACS) analysis was performed on the stromal vascular fraction (SVF) of AT samples from seven subjects with a previously established 13-colour panel, using a Fortessa Cell Analyzer equipped with 405-nanometre, 488-nanometre, 561-nanometre and 640-nanometre lasers and Diva software (BD Biosciences). Data analysis was performed with the FlowJo software (Tree Star, Ashland, Oregon, USA).14 Isolation of the SVF is described in online supplemental methods.
Supplemental material
Cohort characteristics
Quantification of AT depots from body donors
For quantification of visceral AT depots, epiAT and omAT were obtained from 51 body donors at the Institute of Anatomy at Leipzig University and the Institute of Anatomy and Cell Biology at Martin Luther University in Halle-Wittenberg, Germany. During their lifetime, body donors gave informed and written consent to the donation of their bodies for teaching and research purposes. As part of the body donor programme, regulated by the Saxonian Death and Funeral Act of 1994 (third section, paragraph 18 item 8), institutional approval for the use of the postmortem tissues of human body donors was obtained from both participating institutes. Clinical characteristics of the body donors, including age, weight, BMI, causes of death and comorbidities, are listed in online supplemental table S1. Dissections were performed by two board certified anatomists (either MG or MKrüger). Appendices epiploicae were collected from the ascending colon to the sigmoid colon. The omentum majus (pars libera) was dissected from the transverse colon. As an internal reference, the donor’s spleen was also dissected. All tissues were weighed and discarded subsequently.
Supplemental material
Methylation studies
Methylome analyses were performed in a subcohort consisting of nine IS subjects, matched to nine IR subjects by sex, age and BMI (online supplemental table S2). Raw data of 866 150 CpG sites were extracted using Illumina GenomeStudio with the Infinium MethylationEPIC V.1.0 B4 Manifest File (Illumina), followed by normalisation using the preprocessQuantile function in minfi.
Supplemental material
Proteomics
Proteome analyses were performed in the same subcohort used for methylation studies (online supplemental table S2). MesAT was omitted from these analyses due to limited sample availability. Samples were prepared15 and liquid chromatography and tandem mass spectrometry (MS) analysis was performed as described previously.16
MS raw data were processed using MaxQuant V.1.6.2.10. The database search was performed against the UniprotKB/Swissprot protein database of Homo sapiens (6 March 2019) and settings were used as stated before.16
Transcriptomics
Transcriptome analyses were performed in a subcohort consisting of nine IS subjects, matched to 15 IR subjects by sex, age and BMI (online supplemental table S3). Raw data of 47 323 probes were extracted; background correction and quantile normalisation were performed in R using lumi.
Supplemental material
All quantitative real-time PCR (qPCR) experiments were run on a LightCycler 480 System (Roche, Basel, Switzerland) using TaqMan probes (online supplemental table S4) as previously described.17
Supplemental material
Data analysis and statistics
A detailed description of the bioinformatics methods and software used in this publication is provided in the online supplemental methods. Briefly, all data were analysed using R V.3.6.0 and SPSS V.25 and all figures were generated using R followed by formatting in Adobe Illustrator 2020 (Adobe, California, USA).
A weighted gene correlation network analysis (WGCNA) was performed on the integrated transcriptome and proteome data as described previously.18
Data distribution was assessed using histograms and the Kolmogorov-Smirnoff test. Differences between tissues were analysed using paired approaches, where complete cases were identified for each variable, either by paired t-test or Wilcoxon signed-rank test, depending on the distribution of the data. Differences between patient groups within one tissue were determined by Student’s t-test or non-parametric Mann-Whitney U test, based on data distribution. For correlation analysis, Spearman’s rank correlation was employed, with exemption of WGCNA, which uses Pearson on log2-transformed data.
Results
Subject and AT characterisation
In this study, we analysed data from 70 subjects with obesity, mainly categorised by the presence or the absence of IR and T2D (figure 1). Clinical diagnosis of T2D (without significant differences in mean BMI or lifestyle habits) corresponded to elevated levels of several circulating metabolic parameters (fasting plasma glucose, HbA1c and triglycerides) and inflammatory parameters (tumor necrosis factor alpha (TNF-α) and high sensitive C reactive protein), consistent with the concept of subclinical inflammation in T2D (table 1).19
T2D was further associated with increased adipocyte diameter and macrophage counts in all analysed tissues (figure 2A–C). This was similar between epiAT and the more commonly studied omAT and scAT. A characteristic finding for epiAT was the relative increase in the fraction of very small adipocytes (<30 µm) in both T2D and nT2D subjects. While macrophage infiltration was similarly increased in T2D in all AT, macrophage infiltration was significantly lower in epiAT compared with omAT (figure 2C). Additionally, we performed FACS analysis of the SVF in seven subjects to determine differences in specific cell populations. According to our gating strategy (online supplemental figure S1A), epiAT had lower adipocyte progenitors compared with both scAT (p=0.031) and omAT (p=0.1). Quantification of immune cell populations showed significantly more CD45+ cells in both visceral depots (pepivsSc=0.031, pomvsSc=0.047) (figure 2D), whereas scAT had higher amounts of CD45− cells (p=0.016 vs epiAT) and epithelial cells (p=0.016 vs epiAT) (online supplemental figure S1B, table S5). Expression of genes involved in AT biology and inflammation revealed that key markers, such as PPARG, ADIPOQ and SREBP1 were significantly higher in epiploic compared with other tissues, whereas no differences were observed for adipocytokines, IL6 and TNFA (figure 2E; online supplemental table S6). To embed these findings into the wider biological concept of systemic metabolism, we examined the mass of epiAT compared with commonly studied omAT. We were able to quantify the mass of epiAT and omAT in a cohort of 51 body donors, whereas an MRI-based approach failed to robustly quantity epiAT due to extremely thin peritoneal coverings and the lack of separation from omAT (online supplemental figure S1C). Accordingly, epiAT appears to be a major fat depot with a mean weight of 121.5 g, amassing to 66% of the omentum majus (182.6 g) (figure 2F). While both epiAT and omAT masses correlated with BMI, this correlation was strongest and more significant in the epiploic depot (r2=0.47 vs 0.36, respectively) (figure 2G).
Supplemental material
Supplemental material
Supplemental material
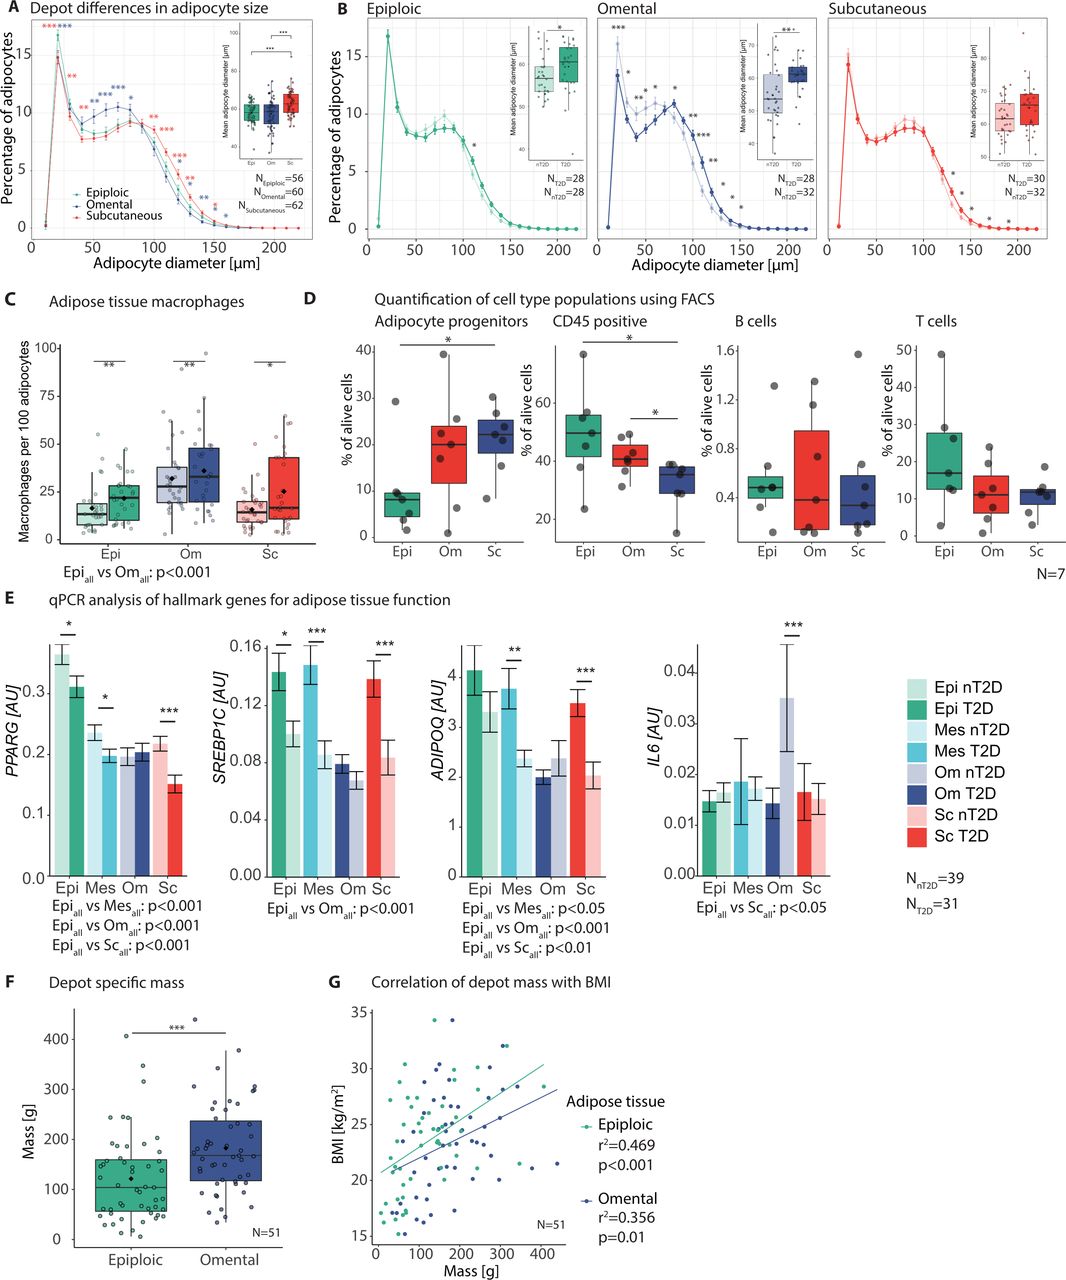
General characterisation of epiAT and mesAT adipose tissue (AT) in comparison to omAT and scAT. (A) Depot differences in adipocyte size and (B) differences between patient groups (nT2D and T2D) for individual depots, showing mean percentage of adipocytes over all patients in increments of 10 µm (large images, Student’s t-test) and overall mean diameter per individual (small image, Wilcoxon signed-rank test); colour of significance levels indicate differences compared with epiAT of the respective depot. (C) AT macrophages indicated as count per 100 adipocytes; significance levels above plot indicate tissue differences (Wilcoxon signed-rank test) and below differences between patient groups (Mann-Whitney U test). (D) FACS analysis of AT SVF (n=7) for immune cell populations and adipocyte progenitors (paired t-test). (E) Expression of central AT metabolic genes, indicated as mean±SEM; asterisks indicate significance levels between patient groups (Mann-Whitney U test); p values for comparisons between tissues are given below plot (Wilcoxon signed-rank test). (F) Fat-depot-specific mass of epiAT and omAT in g (Wilcoxon signed-rank test). (G) Correlation of fat depot mass with BMI (Pearson); significance levels are indicated as *p<0.05; **p<0.01; ***p<0.001. AT, adipose tissue; epiAT, epiploic AT; FACS, fluorescence activated cell sorting; mesAT, mesenteric AT; nT2D, no type 2 diabetes; omAT, omental AT; qPCR, quantitative real-time PCR; scAT, subcutaneous AT; SEM, standard error of the mean; SVF, stromal vascular fraction; T2D, type 2 diabetes.
Multiomics analyses reveal depot-specific differences in AT signatures
To delineate depot-specific characteristics independent from the metabolic state, multiomics comprising analyses of methylome, transcriptome and proteome were performed in a subgroup consisting of nine IS subjects (figure 1; online supplemental table S2). Principal component analysis (PCA) showed segregation between scATs and ATs classified as visceral depots (mesAT, omAT and epiAT) (figure 3A–C, online supplemental figure S2A). Among the latter, epiAT samples clustered separately from other ATs in all analysed omics layers, whereas mesAT was closely related to omAT (figure 3A and B; online supplemental tables S7,8), leading us to focus on multiomics signatures of epiAT.
Supplemental material
Supplemental material
Supplemental material

Multiomics characterisation of epiAT in IS subjects I. (A–C) PCA depicting performed omics in the analysed tissue for transcriptome (A), methylome (B) and proteome (C). (D–E) DEGs (D) and proteins (E) between epiAT and scAT or omAT; red colour indicates upregulation and blue colour indicates downregulation in epiAT; numbers indicate total identified analytes as well as significantly altered analytes. (F) Cell-type specificity of DEGs according to array data of FACS-sorted cell-type populations from human scAT. (G) Transcriptome-based gene set enrichment analysis using KEGG pathways comparing epiAT to omAT. (H) Validation of selected, DEGs compared with all other analysed tissue shown as mean±SEM (Wilcoxon signed-rank test). DEGs, differentially expressed genes; epiAT, epiploic adipose tissue; FACS, fluorescence activated cell sorting; FDR, false discovery rate; IS, insulin sensitive; mesAT, mesenteric AT; omAT, omental AT; scAT, subcutaneous AT; IS, PCA, principal component analysis; SEM, standard error of the mean.
Multiomics reveal a unique signature for epiAT
To investigate unique features of epiAT, we analysed all omics layers in the IS subgroup (online supplemental table S2). Based on the transcriptome, 30 genes had an epiAT-specific expression, different from all other analysed ATs. Many genes were only differentially expressed either versus scAT (309 genes), omAT (400 genes) or mesAT (506 genes). Upregulated genes compared with scAT included ITLN1 (aka omentin), MSLN, ANXA8L1 and KLK11, whereas EGFL6, NRCAM and TBX15 were less abundantly expressed in epiAT. Compared with omAT, PPP1R1B, OLFM4 and lipopolysaccharide binding protein (LBP) were among the most upregulated, whereas ISL1, CLDN1 and NELL2 were less expressed in epiAT (figure 3D; online supplemental table S8).
This was further corroborated in proteome analyses, where epiAT contained several highly abundant proteins, compared with both scAT and omAT. Enriched proteins included ones related to structural stabilisation like LIMCH1, MAP4 and MARCKS and proteins less abundant in epiAT included FMOD, SNRPD1 and THOP1, related to basic structural and functional remodelling (figure 3E; online supplemental table S8).
Genes upregulated in epiAT were mostly specific to adipocytes and were less likely to be immune cell related, as identified by bulk sequencing of FACS-sorted AT cell populations.20 This observation was more pronounced compared with omAT (figure 3F). Accordingly, gene set enrichment analysis of transcriptome data using Kyoto Encyclopedia of Genes and Genomes (KEGG) pathways revealed upregulation of catabolic pathways, including tricarboxylic acid cycle and pyruvate metabolism, short chain fatty acids (SCFA) production as well as branched-chain amino acids (BCAA) degradation. In contrast, calcium signalling and cell adhesion pathways were downregulated compared with omAT (figure 3G; for further results on pathway enrichment between epiAT, scAT and mesAT, see online supplemental figure S2C,D).
Multiomics findings are supported by epiAT gene expression
Selected targets (p-value and fold-change based), validated within the entire cohort using qPCR, included increased Leptin, HOXD8 and HOXA10 expression as well as downregulated IRX3 in epiAT (figure 3H). Since Leptin expression is dependent on adipocyte size, and the latter was relatively reduced in epiAT, increased Leptin expression in epiAT was, furthermore, validated and confirmed in isolated epiAT adipocytes from 14 subjects (online supplemental figure S2E). We also performed expression analyses of further genes related to lipid metabolism, inflammation and adipokine signalling in the entire cohort. Results support an overall higher expression of adipokines (progranulin and chemerin) and CEBPA, but no increase in expression of inflammatory markers, except for CASP1 (online supplemental table S6). Most differentially expressed genes (DEGs) were enriched in adipocytes and adipocyte progenitor cells (online supplemental figure S2F).
EpiAT exhibits a distinct developmental origin
Methylation analyses revealed 43 differentially methylated regions (DMRs) between epiAT and all other ATs. Of these, 33 were cis to at least one of a total of 45 different genes. Thirty two of those were known to be protein coding genes, including FABP4, LRAT as well as 12 genes with homeobox domains and 14 other developmental genes (online supplemental table S9).
Supplemental material
Consistent with the notion that developmental genes might play a role in the differential development of various ATs,21 we observed higher expression of HOXA10, HOX11AS, HOXA13 and HOXD3 in epiAT compared with all other ATs (figure 4A; online supplemental table S8). Tissue-specific differences in the expression of developmental genes were mirrored by similar alterations in the methylation profile of the same samples. Analysing gene-related DMRs, we found a total of 54. Among those, 15 showed a significantly differential methylation at the promoter region, 36 in the gene body and 3 in both. Again, we observed an enrichment of homeobox genes with these HOX genes, including HOXA13, HOXC10, HOXD3, HOXD8 and HOXD12, being hypermethylated in epiAT (figure 4B; online supplemental table S9).
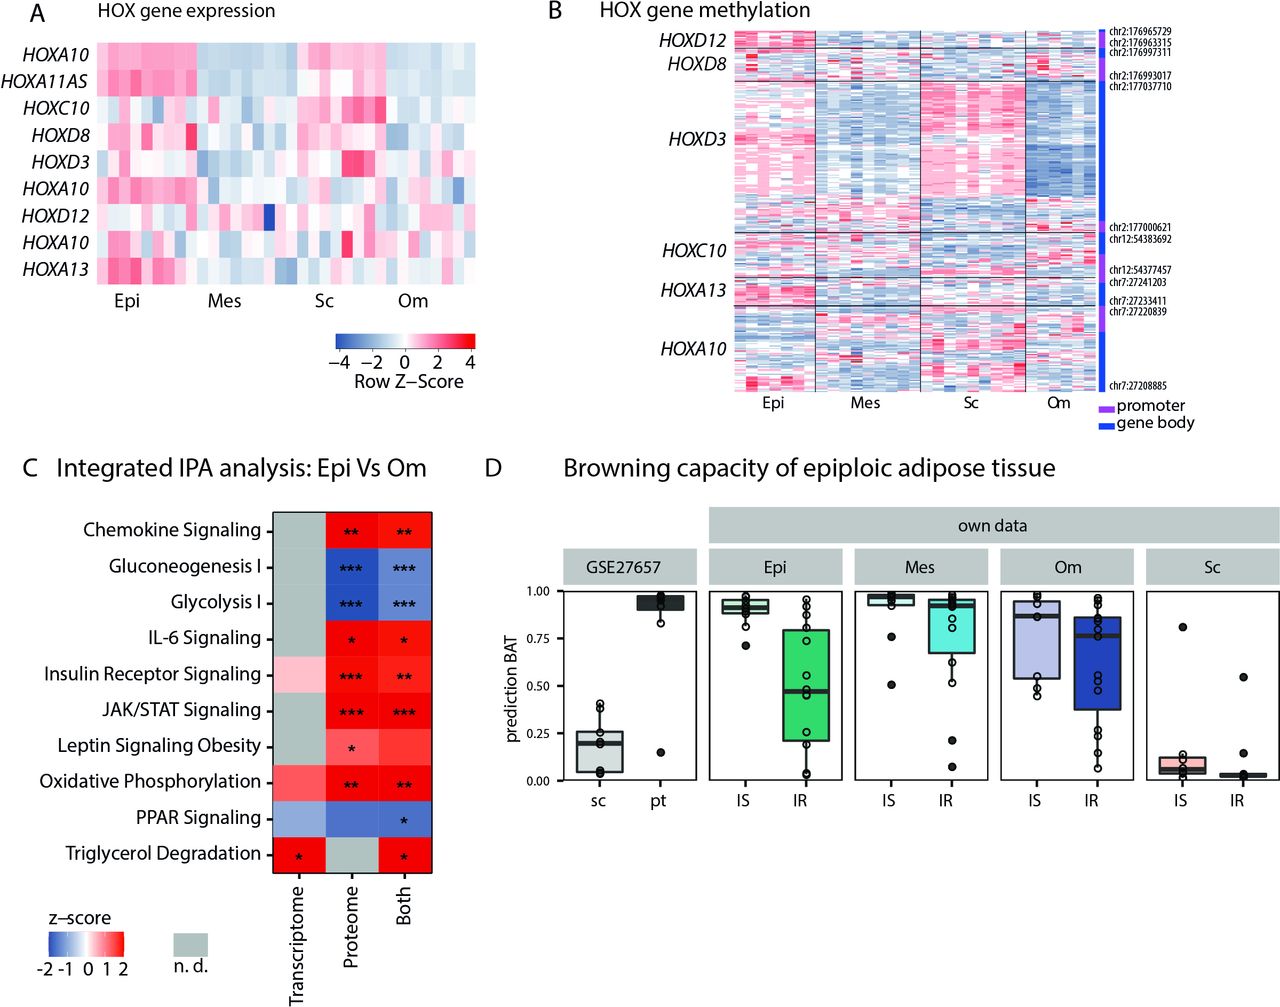
Characterisation of developmental genes, browning capacity of epiAT in IS subjects and multiomics integration. (A) Heatmap showing expression of selected HOX genes and (B) heatmap showing gene-specific methylation for selected HOX genes. (C) IPA for transcriptome, proteome and combined data comparing epiAT to omAT (z-score >0 pathway is upregulated in epiAT, z-score <0 pathway is downregulated in epiAT and n.d. is marked in grey) and (D) browning capacity of analysed depots using the ProFAT tool; significance levels are indicated as *p<0.05; **p<0.01; ***:p<0.001. AT, adipose tissue; epiAT, epiploic AT; IPA, ingenuity pathway analysis; IR, insulin resistance; IS, insulin sensitive; JAK, janus kinase; n.d., not detected; mes, mesenteric; om, omental; PPAR, peroxisome proliferator-activated receptor; sc, subcutaneous; STAT, signal transducer and activator of transcription proteins.
Integrative pathway signatures segregate epiAT from omAT
Since more significant changes were observed between omAT and epiAT compared with scAT and epiAT (figure 3D,E), we further focused on signatures to distinguish these ATs. The comparison of identified proteins and genes in the IS subgroup revealed 1929 overlapping candidates, out of which 46 were significantly altered in both omics layers (online supplemental figure S3A). Subsequent pathway analyses with differentially abundant proteins and genes between omAT and epiAT were conducted using IPA and revealed several enriched pathways. Catabolic metabolism processes such as fatty acid β-oxidation, oxidative phosphorylation, triglycerol degradation and degradation of BCAA were upregulated, whereas glycolysis and gluconeogenesis were downregulated (figure 4C; online supplemental table S10). Furthermore, PPAR signalling was downregulated despite increased expression levels of PPARG in epiAT. In addition, pathways related to inflammatory processes such as interleukin 2 (IL-2), IL-6, IL-8, chemokine signalling as well as pathways involved in cell proliferation like janus kinase/signal transducer and activator of transcription proteins and angiopoietin signalling were enriched in epiAT (figure 4C; online supplemental table S10).
Supplemental material
Supplemental material
EpiAT does not display increased browning capacity
The catabolic and oxidative character of epiAT, as well as the significant reduction of IRX3 expression, which is known to repress beiging of AT,22 suggested that epiAT might be a thermogenic type of fat. Despite this, UCP1 qPCR and UCP1 staining in paraffin embedded tissue were unable to detect relevant expression of UCP1 in epiAT (data not shown). Additionally, we used the recently published ProFAT tool,23 which allows prediction of browning capacity based on transcriptional profiles (figure 4D), and compared expression profiles of further markers genes from recent human studies24 25 (online supplemental figure S3B,C). We compared our findings with a published dataset on human scAT and perithyroid AT, the latter containing white and brown adipocytes and displaying increased browning capacity.26 All data suggested that browning capacity of epiAT is comparable to other visceral AT depots, whereas it is increased compared with scAT. Furthermore, we observed an expected decrease in browning capacity in patients with IR (figure 4D).
Systemic IR is best reflected by epiAT signatures
After establishing that epiAT is a distinct compartment exhibiting unique features in comparison to other AT depots in IS subjects, we aimed to characterise changes in its biological profile regarding IR in a matched subcohort. Notably, transcriptome and proteome analyses allowed the separation of IR and IS states in all AT. EpiAT showed the strongest segregation of the two states (figure 5A–C; online supplemental tables S7,8) by means of transcriptome and proteome signatures. We thus proceeded to characterise the signature of epiAT in IR.

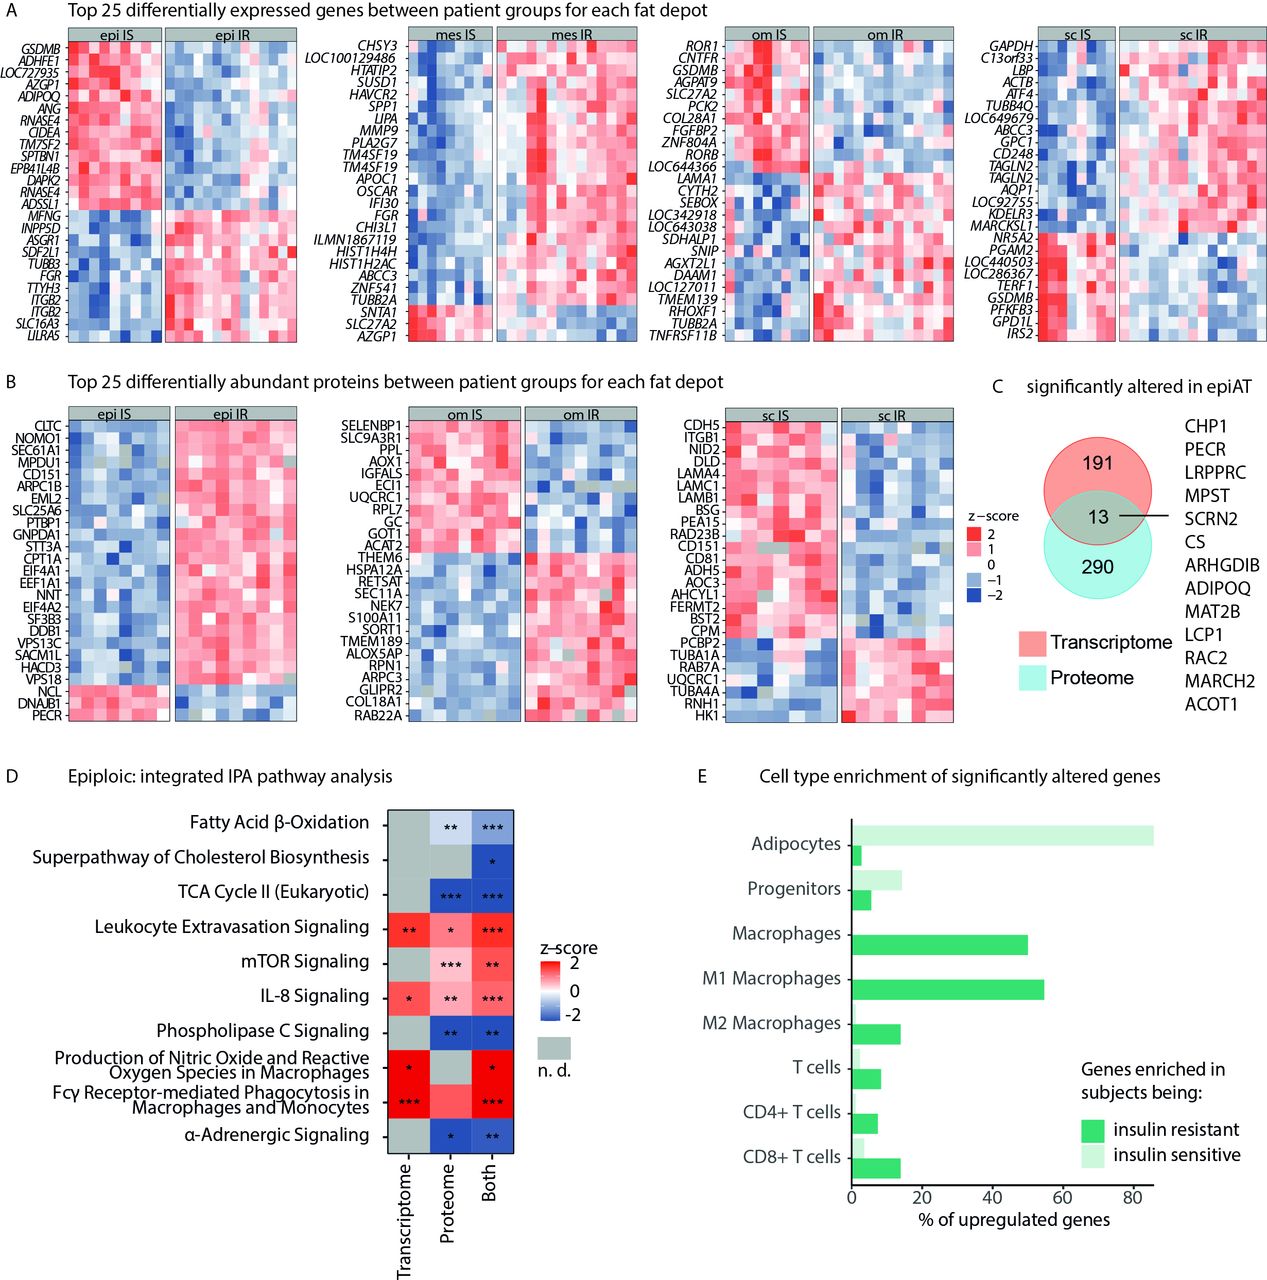
Multiomics profile of IR vs IS obesity in epiAT. (A) Top 25 DEGs (based on adjusted p value) for all analysed tissues, and (B) top 25 differentially abundant proteins, both shown as z-scores. (C) Overlap between significantly regulated transcripts/proteins in epiAT. (D) IPA integrating transcriptome and proteome data (z-score >0 pathway is upregulated in IR, z-score <0 pathway is down-regulated in IR and n.d. is marked in grey). (E) Cell-type specificity of DEGs according to array data of FACS-sorted cell-type populations from human scAT. AT, adipose tissue; DEGs, differentially expressed genes; epiAT, epiploic AT; FACS, fluorescence activated cell sorting; IPA, ingenuity pathway analysis; IR, insulin resistant; IS, insulin sensitive; n.d., not detected; scAT, subcutaneous AT; TCA, tricarboxylic acid.
Multiomics reveal specific candidates of IR in epiAT
Transcriptome analyses revealed 204 DEGs in epiAT between IS and IR subgroups, representing the highest number of DEGs compared with omAT and scAT (online supplemental table S8). In IR obesity, epiAT was characterised by higher expression of MMP9, LBP and APOC1, whereas IS obesity was associated with higher expression of ADHFE1, RNASE4, CIDEA, ADIPOQ and DAPK2 among others (figure 5A). Transcriptome-based KEGG pathway analysis showed that IR was associated with upregulation of various infection and inflammatory pathways, including pathogenic Escherichia coli infection, antigen processing, B cell and toll-like receptor signalling as well as chemokine signalling, whereas IS was associated with increased fatty acid and SCFA metabolism (online supplemental figure S4A).
Supplemental material
Within the proteome, a total of 303 proteins were differentially abundant between IR and IS obesity subgroups in epiAT. NNT, CD47 and SEC61A1, which have known associations with T2D development,27–29 were more abundant in IR epiAT, whereas LIMCH1, PECR and TUSC5 were less abundant (figure 5B, online supplemental table S8). Comparing proteome and transcriptome data, a total of 2067 overlapping candidates were reliably quantified in both, out of which 13 were significantly altered in IR, including ADIPOQ, RAC2 and MARCHF2 (figure 5C). The significantly altered candidates were used for pathway enrichment analyses using IPA. A reduced metabolic activity in IR compared with IS epiAT was observed based on downregulated fatty acid β-oxidation, cholesterol biosynthesis and tricarboxylic acid cycle (figure 5D; online supplemental table S10). In contrast, we detected an upregulation of inflammatory processes, such as IL-8 and mechanistic target of rapamycin (mTOR) signalling as well as macrophage-associated pathways.
Genes associated with increased IR are mostly specifically expressed in M1 macrophages and CD8+ T cells. In contrast, genes that are related to IS are mostly expressed by adipocytes (figure 5E). Changes in M1 macrophages can be linked to an increase of this cell type in IR, which goes along with a decrease of M2 macrophages. We do not observe altered counts of T cells, indicating that the observed differences are likely due to altered transcription profile rather than increased amount of T cells or other cells (online supplemental figure S4B). Comparing methylation levels between patient groups in all tissues, we found only one significantly hypermethylated DMR in IR epiAT close to the CYP2E1 and SPRN genes (online supplemental table S9).
IR and IS are reflected in multiomics signature of EpiAT
To identify correlated proteins, transcripts and methylated genes that could define IR, we applied sparse projection to latent structures–discriminant analysis. The identified features maximising the covariance clearly discriminate IS and IR in epiAT (figure 6A, upper panel). The corresponding analytes from the different omics layers (figure 6A, lower panel) were moreover strongly correlated (figure 6A,B).

Analyte-based data integration characteristic for IR epiAT. (A) Visualisation of integrative sparse discriminant analysis to maximise variance between IS and IR state in epiAT (upper panel) and corresponding abundance heatmap and clustering of the identified features (lower panel). (B) Circos plot showing the same identified feature by highlighting correlation between methylation state in promoter region and gene body with transcripts and proteins, n=12, circos plot outer layers show average analyte abundance, followed by names and the inner circles show correlation relationship (r>0.9), where red indicates positive correlation. (C) Analyte-focused visualisation of IR enriched KEGG pathways: chemokine signalling pathway (hsa:04062) and leucocyte transendothelial migration (hsa:04670). The gene nodes are separated into four slots, each representing the different abundances between IR and IS in epiAT, measured in the variant omics layers. From left to right, the slots show the fold changes of transcription intensity, protein abundance and the difference of the methylation rate in the CpGs of the gene promoter, and the gene body. Values exceeding the limits of the colour key are coloured with highest or lowest colour intensity, respectively. AT, adipose tissue; epiAT, epiploic AT; IR, insulin resistance; IS, insulin sensitive; KEGG, kyoto encyclopedia of genes and genomes.
The KEGG pathways, which were most strongly altered in each of the omics layers were chemokine signalling and leucocyte transendothelial migration (figure 6C). Within the chemokine signalling pathway, key molecules, including tyrosine kinase SRC and GTPase Rac2, were congruently regulated on transcriptome and proteome levels, whereas various chemokine receptors were co-regulated, based on transcriptome and methylation levels (figure 6C). Within the leucocyte transendothelial migration pathway, components of the nicotinamide adenine dinocleotide phosphate (NADPH) enzyme complex were similarly regulated in different omics layers, which is in line with results from the IPA analysis (figure 6C, online supplemental table S10. We generalised this approach by indicating the number of overlapping analytes for four individual pathways (online supplemental figure S5A–D), as well as all significant KEGG pathways (online supplemental figure S5E). About half of the analytes in the significantly enriched KEGG pathways (541 of 1110) were regulated in at least one of the omics layers. Of these ~20% (121 of 541) overlapped with at least one further layer. Focusing on findings revealing alterations in multiple omics layers, we found that ~55% of proteins were also regulated on the transcriptional level, about 40% of DMR (25% of those located in gene body and even 60% of those located in promoter regions) were linked to changes in the expression level, and about 10% of the genes with epigenetic differences (gene body or promoter) were also differentially expressed and showed altered protein abundances between IR and IS in epiAT.
Supplemental material
RNASE4 and ADHFE1 in epiploic adipocytes characterise systemic IS
Subsequently, three candidate genes based on p-value and fold-change (ADHFE1, RNASE4 and MMP9), in addition to ADIPOQ as a positive control, were validated by qPCR confirming results obtained from transcriptome array data. Using the strictly matched transcriptome cohort (online supplemental table S2), differences between both patient groups for ADHFE1, RNASE4 and MMP9 were observed (figure 7A), confirming array data results. All genes were expressed in isolated adipocytes, showing the same differences between patients with and without T2D in an independently collected cohort (figure 7B, online supplemental table S11). Gene expression was correlated with clinical markers in the original cohort comprising 70 individuals, showing strong associations. Especially, RNASE4 and ADHFE1 were negatively correlated with HbA1c and circulating triglycerides, but positively correlated with the expression of PPARG and SREBP1C in epiAT (figure 7C).
Supplemental material

Effects of IR on epiAT. (A) qPCR replication of candidate genes (based on adjusted p value and fold change) in the age-matched, sex-matched and BMI-matched cohort comparing patients with or without IR. (B) Adipocyte-specific expression of candidate genes in an independent cohort of 14 subjects (NnT2D=7 and NT2D=7). (C) Correlation of expression values with clinical data in the complete study cohort. (D) Selected key drivers of the IR epiAT based on WGCNA, filtered for absolute gene significance ≥0.4, absolute module membership ≥0.4, connectivity >0.1 and indicating observed changes for each key driver in the different ATs. Their connectivity was visualised as cytoscape network with colouring based on log2(FC) for IR vs IS in epiAT. (E) Correlation of key drivers with selected clinical parameters and (F) correlation of key drivers in epiAT with circulating adipokines and apolipoproteins. Heatmaps are coloured by Pearson; *p<0.05; **p<0.01; ***p<0.001. ATs, adipose tissues; BMI, body mass index; EpiAT, epiploic AT; FC, fold change; IR, insulin resistence; IS, insulin sensitive; nT2D, type 2 diabetes; qPCR, quantitative real-time PCR; T2D, type 2 diabetes; WGCNA, weighted gene correlation network analysis.
WGCNA identifies key drivers for IR in epiAT
To further identify novel key drivers associated with IR in epiAT, a WGCNA was conducted clustering co-abundant targets to modules, thus reducing the complexity of the data. For this purpose, genes and proteins were integratively analysed. Overall, we identified 14 modules containing co-abundant transcripts and proteins, which were correlated to the different AT and IS status before running a module-wise pathway enrichment analysis using IPA (online supplemental figure S6A, table S10). Briefly, the IS state in epiAT was associated with decreased inflammation (yellow module) and increased leptin signalling (blue module), whereas IR could be linked to increased IL-10 and chemokine receptor activation (salmon module) as well as decreased fatty acid β-oxidation (magenta module) (online supplemental figure S6B). Potential key driver characteristics for IS in epiAT were selected based on absolute gene significance, module membership ≥0.4 and intramodular connectivity ≥0.1, and were found to be assigned to the yellow module, including ZYX, CYP27A1 and SLC16A3 (online supplemental figure S6C, table S12).
Supplemental material
Supplemental material
Applying the same settings, key drivers for the IR epiAT were identified, mainly belonging to the salmon and blue modules (figure 7D). We observed COPB2, NNT, CD151, SACM1L, AOC3 and HACD3 to be upregulated in IR. Additionally, weaker effects were observed for the genes IDO1, CCL18, LY96 (alias MD2) and CD209. Notably, all these genes are involved in immunological processes, as indicated by the gene ontology (GO) enrichment available in the stringApp30 (online supplemental figure S6B).
Proteome and transcriptome key driver AT profiles are associated with IR
Lastly, we investigated whether the identified key driver proteins were associated with clinical and AT gene expression data related to obesity and T2D. EpiAT signatures were different from omAT and displayed a contrary set of correlations compared with those seen in scAT (figure 7E). More importantly, most epiAT key driver proteins were positively correlated with markers of IR and glucose homeostasis. The strongest positive correlations were observed for COPB2, NNT and SACM1L with HbA1c and fasting plasma insulin, while significant negative correlations with adiponectin expression were found for CD151, AOC3 and HACD3 (figure 7E). Gene key drivers, especially CD163L1 and CTSC, were positively associated with circulating apolipoproteins E and C3, whereas most protein key drivers were negatively correlated with the concentration of circulating visfatin (figure 7F).
Discussion
Our understanding of the role of AT has gradually shifted from a mere energy storage to that of a highly active endocrine and immune organ, contributing to overall metabolic health. AT distribution has been linked to varying degrees of metabolic disease, including IR, depending on the proportions of visceral AT and scAT.31 Indeed, visceral ATs exhibit depot-specific immune and metabolic differences compared with scAT,32 which dictate their individual roles in health and disease. The mesAT, located along the wall of the small intestine, has emerged as a potential regulator of gut-associated inflammation8 and metabolic rate following bariatric surgery.33 Another gut-related AT situated along the wall of the large intestine and occasionally referred to as epiAT, remained, until now, largely unexplored. In the present work, we, therefore, aimed at an in-depth characterisation of these intraabdominal depots in comparison to the more extensively studied depots in the context of IR by multiomics and immunohistochemistry-based approaches in individuals with obesity.
Positioning of epiAT in relation to other fat depots is a challenging question. The methylome is closer to omAT/mesAT and transcriptome is somewhere between that of scAT and omAT, whereas epiAT appears to be closely related to scAT based on the proteome data. In contrast, mesAT was closely related to omAT. Thus, we directed our attention towards in-depth analyses of epiAT, which we show to constitute a relevant proportion of visceral fat, approximating 66% of omAT mass. This was further motivated by its location in proximity to the colon, which harbours by far the most bacteria in the human body,34 making epiAT a potential sentinel between gut and host metabolism in the context of increased intestinal permeability in obesity and metabolic disease.35
EpiAT exhibits histological features of both omAT and scAT regarding adipocyte size and macrophage infiltration, which was further confirmed in all omics spaces owing to its intermediary location along the first two principal components. This result is supported by a marked difference in the expression and methylation patterns of various homeobox transcription factor genes, which have been shown to play a role in the context of metabolic disease, indicating a potentially distinct developmental origin of epiAT. Our methylation analysis results confirm findings previously published on homeobox and other genes involved in adipogenesis and browning of white AT.36 37 Also, when comparing epiAT in the IR versus the IS state, we found a hypermethylated DMR close to CYP2E1, the gene product of which is associated with oxidative stress and cellular damage in non-alcoholic fatty liver disease (NAFLD), obesity and T2D.38 However, it should be noted that most of these previous findings are either from studies in mice, human peripheral blood leucocytes or other AT biopsies and not from epiAT, where data until now remain scarce.38 39 Among the investigated depots, epiAT exhibits the largest fraction of very small adipocytes, increased metabolic activity of mainly catabolic pathways (triacylglycerol degradation, oxidative phosphorylation and fatty acid β-oxidation) and higher expression of ADIPOQ and PPARG, suggesting an active metabolic role,40 but not a key role in lipid storage. While initial single features suggested a potential characteristic browning behaviour in epiAT, we found that epiAT exhibited comparable browning capacity to other visceral AT, which was increased as compared with scAT. As in all other depots, capacity for browning was markedly decreased in IR.
The unique signature of epiAT was further reflected in an increased expression of genes related to antimicrobial response such as ITLN1, LBP and OLFM4. Interestingly, OLFM4 may link obesity to gastrointestinal inflammation, because OLFM4- /- knockout mice exhibit increased resistance against E. coli and Staphylococcus aureus infections.41 42 Similarly, increased expression of genes encoding components of the degradome (KLK11) and more abundant proteins such as MAP4, implicated both in mitochondrial health43 and efficient T cell activation in the context of adaptive immune response,44 proposes an important role of epiAT in the crosstalk between gut bacteria, intestinal barrier and overall host immunity and metabolism.
Having determined the signature characteristics for epiAT in IS obesity, we further addressed its role in IR. Based on the number of DEGs and proteins, epiAT showed a more clear separation of disease states, compared with both scAT and omAT. In this context, we found a downregulation of pathways involved in mammalian downstream metabolism of gut-derived SCFA propionate and butyrate in IR. These bacterial metabolites are established markers of a gut-AT crosstalk and are generally associated with improved metabolic health. Reduced degradation of BCAA and simultaneously increased mTOR signalling further supported BCAA-related dysmetabolism as a putative mechanism for IR in epiAT.45 This could lead to increased circulating BCAAs promoting β-cell mitochondrial dysfunction, stress signalling and subsequent apoptosis, further aggravating systemic IR and impaired glucose tolerance in obesity.46
Although we neither observed differences in macrophage infiltration nor expression of TNF or IL6 in epiAT between IS and IR, upregulation of inflammatory pathways was more pronounced in epiAT of individuals with IR. Pathways included increased signalling of IL-8, mTOR and phagocytosis with subsequent production of reactive oxygen species by macrophages, ultimately leading to increased stress signalling as seen in IR obesity in several ATs.47 This was further substantiated by co-regulation of several omics findings within chemokine signalling and leucocyte transendothelial migration pathways. Overall, correlation between proteome and transcriptome data was rather low, suggesting additional mechanisms such as IR-dependent regulations at a posttranscriptional level, may have an impact on the observed differences.
Candidate DEGs, that is, ADHFE1, RNASE4 and MMP9 were validated via qPCR. Their marked differences between matched IS and IR subjects were confirmed by strong correlations with parameters of impaired glucose (eg, HbA1c) and lipid metabolism (fasting triglycerides) in the entire cohort. While MMP9 was increased in metabolically unhealthy obesity48 and ADHFE1 expression was shown to be dependent on the differentiation trajectory of AT,49 its importance has not been elucidated in human T2D yet. Nevertheless, ADHFE1 expression was increased in the vasculature in mice with streptozotocin-induced diabetes mellitus.50 RNASE4, on the other hand, is mainly expressed in the liver but was recently shown to be highly secreted in adipose-derived mesenchymal stromal cells under hypoxic stress.51 Here, we show that RNASE4 is also highly expressed in isolated adipocytes and that higher secretion from adipocytes in obesity is linked to improved glucose metabolism, as seen by its strong negative correlations with HOMA-IR and HbA1c in our cohort.
We further performed integrated WGCNA analysis to identify key drivers for IR in epiAT. A closer look at individual key drivers for IR uncovered molecules either related to glucose metabolism impairment or to cardiometabolic health via association to adiponectin. Key drivers for impaired glucose metabolism included NNT. Its expression in visceral AT has been previously linked to parameters of obesity, fat distribution and glucose tolerance.52 Other abundant candidates in IR included HACD3 and AOC3. HACD3 is involved in insulin signalling.53 AOC3 is primarily localised on the surface of the adipocyte membrane and has been shown to play a role in glucose trafficking and leucocyte migration during inflammation.54 More importantly, elevation of AOC3- activity (also known as VAP-1) has been proposed to contribute to renal and vascular disease, as well as acute and chronic hyperglycaemia55 and the long-term complications of hyperglycaemia and diabetes.56 Admittedly, our study design does not allow to draw conclusions regarding a causal role of epiAT in mediating systemic IR. However, we hypothesise that the same mechanisms (eg, leaky gut) that cause epiAT accumulation/ dysfunction may contribute to systemic IR.
Notwithstanding, we are aware of several limitations of this study: Our cohort only consisted of subjects with obesity, whereas healthy, lean subjects would have been a desirable control. However, tissue collection according to the exact same protocol as we described in this study was considered impractical and ethically questionable outside of bariatric surgery, since tissue collection from the intestines’ walls represents an avoidable surgical risk. Considering females outnumber males in the omics datasets, we cannot exclude that the results are skewed toward severity-related omics markers more relevant in females. That being said, the ratio of females and males remains constant when comparing tissues, which makes the difference most likely related to underlying tissue differences instead of sex-driven AT depots candidates. Considering the metabolic differences between females and males and limited numbers of subjects in our dataset when dividing according to sex, which lead to reduced power, we believe larger studies should aim to answer this question in males versus females matched for age and BMI. Moreover, AT is composed of several cell types. Thus, although it could not be directly determined to what extent each cell population contributed to the observed effects, the combination of FACS analyses with prevalent human datasets on cell population specific transciptomics allowed us to trace back the expression of several key drivers of IS to the adipocytes fraction of epiAT and show that differentially expressed genes in IR stem from M1-polarised macrophages. We, moreover, found that leptin mRNA levels are markedly higher in epiAT compared with subcutaneous fat depots, whereas epiploic adipocyte size is lower. This result is in contrast to our expectations from reports that leptin expression (and secretion) correlates with adipocyte size57 but could be confirmed in expression analyses of isolated adipocytes suggesting another driver behind leptin expression in epiAT beyond adipocyte size. We have to acknowledge that because of limited biopsy amounts, we were not able to test whether leptin secretion from isolated epiploic versus subcutaneous adipocytes confirms this potentially unique feature of epiploic fat. Potential leptin secretion differences between epiploic and subcutaneous fat need to be studied in follow-up studies. Overall, future single cell approaches may elucidate the contribution of individual AT cell.
While encouraging future studies to overcome the aforementioned limitations, it should be noted that epiAT does not occur in commonly used animal models.10 Nevertheless, we postulate that in vivo studies in humans and other suitable species could shed light on how epiAT metabolism reflects systemic IR and contributes to host pathologies.
In conclusion, we find heterogeneous AT signatures even within the visceral fat depots, which may contribute to distinct associations with obesity subphenotypes and the recently described clinical clusters of diabetes.58 Our findings highlight the underestimated role of epiAT in IR, inflammation, and metabolic health.
Data availability statement
Proteome data: ProteomeXchange Consortium via the PRIDE partner repository.59 Raw methylome outputs are available from Arrayexpress under the accession number E-MTAB-10999. Transcriptome table is available as supplementary table 7. Raw trascriptome data can be made available upon direct request to the corresponding authors.
Ethics statements
Patient consent for publication
Ethics approval
This study was approved by the ethics committee of the University of Leipzig (017-12-23012012).
Acknowledgments
Microarray analysis was conducted at the Core Unit DNA Technology at the Faculty of Medicine of the University Leipzig, headed by PD Dr Knut Krohn, whom we thank. We thank Julia Howanski, Beate Gutsmann and Steffi Ziesche for their excellent technical support. We further thank Prof. Heike Kielstein and Prof. Ingo Bechman for their support in histochemistry studies and studies conducted in body donors as well as Prof. Timm Denecke, Dr Nicolas Linder and Dr Harald Busse for the support of imaging studies. We are deeply grateful for the willingness of the patients at the university hospital and the subjects, who made their bodies available for science beyond death, to support this research and scientific advancement.
References
Supplementary materials
Supplementary Data
This web only file has been produced by the BMJ Publishing Group from an electronic file supplied by the author(s) and has not been edited for content.
- Data supplement 1
- Data supplement 2
- Data supplement 3
- Data supplement 4
- Data supplement 5
- Data supplement 6
- Data supplement 7
- Data supplement 8
- Data supplement 9
- Data supplement 10
- Data supplement 11
- Data supplement 12
- Data supplement 13
- Data supplement 14
- Data supplement 15
- Data supplement 16
- Data supplement 17
- Data supplement 18
- Data supplement 19
Footnotes
RC and LM are joint senior authors.
Twitter @IKarkossa
LK and KD contributed equally.
Correction notice This article has been corrected since it published Online First. The first supplementary file and figure 2 have been replaced and the corresponding author's email address updated.
Contributors Conceptualisation: RC, LM and PK. Data curation: LK, KD, IK, SHB, SK, MKeller and JL. Funding acquisition: PK, MB and MS. Formal analysis: LK, IK, SHB, SK, KS and LM. Investigation: RC, LM, KD, ST, AL and NS. Methodology: MvB, MG, RC, LM, KS and AS. Resources: MB, AD, MS, PK, MvB, MG and MKrüger. Writing—original draft: KD, LK, RC, LM and PK. Writing—revision: PK, RC and LM. All authors reviewed and edited the final version of the manuscript.
Funding This work was supported by grants from the Deutsche Forschungsgemeinschaft (DFG, German Research Foundation – Projektnummer 209933838 – SFB 1052; B01, B03, B09, Z03, Z04) and from Deutsches Zentrum für Diabetesforschung.
Disclaimer MB received honoraria as a consultant and speaker from Amgen, AstraZeneca, Bayer, Boehringer-Ingelheim, Lilly, Novo Nordisk, Novartis and Sanofi. All other authors declare no conflict of interest.
Competing interests MB received honoraria as a consultant and speaker from Amgen, AstraZeneca, Bayer, Boehringer-Ingelheim, Lilly, Novo Nordisk, Novartis and Sanofi. All other authors declare no conflict of interest.
Provenance and peer review Not commissioned; externally peer reviewed.
Supplemental material This content has been supplied by the author(s). It has not been vetted by BMJ Publishing Group Limited (BMJ) and may not have been peer-reviewed. Any opinions or recommendations discussed are solely those of the author(s) and are not endorsed by BMJ. BMJ disclaims all liability and responsibility arising from any reliance placed on the content. Where the content includes any translated material, BMJ does not warrant the accuracy and reliability of the translations (including but not limited to local regulations, clinical guidelines, terminology, drug names and drug dosages), and is not responsible for any error and/or omissions arising from translation and adaptation or otherwise.