Article Text

Abstract
Objective Refractory coeliac disease (RCD) is a potentially hazardous complication of coeliac disease (CD). In contrast to RCD type I, RCD type II is a precursor entity of enteropathy-associated T-cell lymphoma (EATL), which is associated with clonally expanding T-cells that are also found in the sequentially developing EATL. Using high-throughput sequencing (HTS), we aimed to establish the small-intestinal T-cell repertoire (TCR) in CD and RCD to unravel the role of distinct T-cell clonotypes in RCD pathogenesis.
Design DNA extracted from duodenal mucosa specimens of controls (n=9), active coeliacs (n=10), coeliacs on a gluten-free diet (n=9), RCD type I (n=8), RCD type II (n=8) and unclassified Marsh I cases (n=3) collected from 2002 to 2013 was examined by TCRβ-complementarity-determining regions 3 (CDR3) multiplex PCR followed by HTS of the amplicons.
Results On average, 106 sequence reads per sample were generated consisting of up to 900 individual TCRβ rearrangements. In RCD type II, the most frequent clonotypes (ie, sequence reads with identical CDR3) represent in average 42.6% of all TCRβ rearrangements, which was significantly higher than in controls (6.8%; p<0.01) or RCD type I (6.7%; p<0.01). Repeat endoscopies in individual patients revealed stability of clonotypes for up to several years without clinical symptoms of EATL. Dominant clonotypes identified in individual patients with RCD type II were unique and not related between patients. CD-associated, gliadin-dependent CDR3 motifs were only detectable at low frequencies.
Conclusions TCRβ-HTS analysis unravels the TCR in CD and allows detailed analysis of individual TCRβ rearrangements. Dominant TCRβ sequences identified in patients with RCD type II are unique and not homologous to known gliadin-specific TCR sequences, supporting the assumption that these clonal T-cells expand independent of gluten stimulation.
- T-CELL RECEPTOR
- SMALL INTESTINE
- COELIAC DISEASE
- LYMPHOMA
- MOLECULAR PATHOLOGY
This is an Open Access article distributed in accordance with the Creative Commons Attribution Non Commercial (CC BY-NC 4.0) license, which permits others to distribute, remix, adapt, build upon this work non-commercially, and license their derivative works on different terms, provided the original work is properly cited and the use is non-commercial. See: http://creativecommons.org/licenses/by-nc/4.0/
Statistics from Altmetric.com
Significance of this study
What is already known on this subject?
High-throughput sequencing (HTS) is a sensitive approach to identify subpopulations of clonal T-cells and to determine the T-cell diversity.
However, T-cell variability of the small intestinal compartment has not been studied in detail, especially regarding population size and consistency of clonal T-cell subpopulations.
Refractory coeliac disease (RCD) is a severe complication of coeliac disease, frequently progressing to a fatal enteropathy-associated T-cell lymphoma (EATL).
Intraepithelial clonal T-cell populations with a specific immunophenotype occur in RCD type II.
What are the new findings?
Analysis of TCR diversity reveals small dominant (clonal) subpopulations that are stable over years even in healthy duodenal mucosa.
In RCD type II, T-cell diversity is significantly diminished. Dominant clonotypes consisting of up to 73% of all TCR rearrangement occur.
Patients with highly frequent clonotypes appear to be at-risk for progression to EATL.
Dominant RCD type II T-cell clones appear not to be gliadin-dependent.
How might it impact on clinical practice in the foreseeable future?
Analysis of TCR diversity and tracking of stable TCR clonotypes might be a prognostic tool to identify patients at-risk for progression to EATL.
For reasons of high sensitivity of HTS-TCR and its potential to reproducibly identify clones by their specific TCR-CDR3 sequences, TCRβ-HTS might become a valuable diagnostic tool for future treatment studies in RCD type II, since it will likely pick-up even residual clonal lymphocyte populations and determine copy numbers allowing quantitative judgement of treatment efficacy.
Introduction
While atrophy of the small intestinal mucosa in patients suffering from coeliac disease (CD) reverses in >95% of patients once a gluten-free diet (GFD) is introduced, there are refractory cases, who—in spite of closely following the diet—continue to suffer from malabsorption of nutrients secondary to small intestinal atrophy.1 ,2
More importantly, two types of refractory CD (RCD) exist. While RCD type I appears to be an aetiologically heterogeneous condition that most often can be treated with an immunosuppressive regimen, the small intestinal mucosa in RCD type II is infiltrated with a population of aberrant intraepithelial T-lymphocytes, which are clonally expanding.1 ,3 Recently, the presumable precursor of RCD type II-associated aberrant T-cells was identified in patients without CD as an IL-15 receptor(+) CD7(+) CD127(−) CD34(−) cell population.4 Since patients with RCD type II carry a high risk of developing an enteropathy-associated T-cell lymphoma (EATL) and since T-cell clones found in RCD type II are indistinguishable from EATL T-cell clones by their identical T-cell receptor (TCR) gene rearrangements, RCD type II is regarded as a precursor lesion to EATL.5–8 Strategies to diagnose RCD type II include immunohistochemistry revealing a loss of CD8 in intraepithelial lymphocytes (IELs) in combination with evidence for clonal expansion of IELs, as uncovered by T-cell receptor β (TCRβ) or TCRγ-PCR in duodenal samples.9 ,10 Alternative diagnostic procedures include flow cytometric immunophenotyping of isolated IELs from duodenal mucosa.11
The structure of TCR gene rearrangements in RCD type II is a matter of current research.12 The TCR acts as a heterodimer, which is in 85% of small intestinal IELs composed of α and β chains, whereas in 15% of these cells it consists of γ and δ chains.13 Antigen binding of TCRα/β is determined by three hypervariable complementarity-determining regions (CDR)1–3, where CDR3 is mainly responsible for recognising processed antigens.14 These CDRs are generated by somatic recombination among the variable (V), diversity (D present only in TCRβ) and joining (J) segments. In addition, non-templated bases are incorporated at the recombination junctions, which generate overall a spectrum of >2.5×10⁷ unique TCR receptors.15 So far, it is well known that clonally expanded mucosal T-cells expressing the same CDR3 region are a hallmark of RCD type II.9 Since it has been shown from early on that clones found in RCD type II were identical to the clonal structure of EATLs that later arose within the same individual, the assumption came up that RCD type II is a premalignant condition that might require an oncologic rather than an immunosuppressive treatment strategy.16–19 However, the TCR repertoire in the duodenal mucosa in its molecular heterogeneity with respect to the number and frequency of co-existing clonally expanding T-cells in the healthy duodenum as well as in active CD and diseases with clonal expansion of T-cells as RCD type II needs further characterisation. Moreover it is unknown, if RCD type II aberrant IELs express public TCR sequences, that is, CDR3 segments that are found interindividually in RCD type II and whether they relate to previously published TCR sequences.
Up to now, analysis of the TCR-CDR3 region was dominated by technologies like spectratyping generating information about fragment length rather than sequence identity.20 ,21 With the advent of high-throughput sequencing (HTS), it is now possible to determine a huge number of sequences concurrently. In this work, we employed a multiplex TCRβ PCR assay followed by HTS of the generated amplicons to determine the entire individual spectrum of CDR3 sequences of patients with RCD type II compared with uncomplicated CD and RCD type I. This allows for the first time a precise and quantitative dissection of the individual T-cell repertoire (TCR) of these patients and by comparison to healthy individuals insights into the general CDR3 sequence variability of the human small intestine.
Methods
A more comprehensive description of the methods is included in the online supplementary material methods section.
Supplementary material
Supplementary material
Study design and sample acquisition
Duodenal mucosal tissue was collected after informed consent during routine endoscopy at the Department of Gastroenterology (Ethics approval EA4/016/14). Endoscopic biopsies were snap-frozen immediately after sampling or processed to formalin-fixed paraffin embedded (FFPE) samples. FFPE samples were immunostained and reviewed by pathologists, whereas the snap-frozen tissue was additionally used for DNA extraction and subsequent molecular analyses. A detailed flow chart of the sample preparation and analysis is given in figure 1.

Flow chart of sample preparation and analysis. FFPE, formalin-fixed paraffin embedded.
Patient characteristics
The Charité coeliac tissue bank was searched for patients with diagnosis of RCD and matched appropriate controls. Fifty-two small intestinal tissue samples suitable for this study were identified that had been collected within the time span from 2002 to 2013. This included a total of 47 patients with either active coeliac disease (ACD), CD on a GFD (CD GFD), RCDs, patients with a Marsh I enteropathy and healthy controls (table 1). Control subjects were scoped for reasons of dyspepsia and did not reveal clinical or histological signs of enteropathy. Patients on a normal diet that revealed on histology a Marsh III enteropathy (ie, crypt hyperplasia or crypt hyperplasia plus villous atrophy), showed positive transglutaminase-IgA serology and later responded to a GFD, were judged as ACD (n=10). Patients with CD GFD (n=9) had been previously diagnosed as coeliacs and had been successfully treated with a strict GFD for at least 1 year. RCD was diagnosed in patients who were refractory to a GFD for >1 year. Differential diagnoses and a failure to adhere to the diet had to be ruled out (RCD type I, n=8; RCD type II, n=8).2 Exceptions from this rule included one RCD type II case where diagnosis had to be established earlier to introduce timely treatment. Subtyping of RCD in type I and II was not accomplished by flow cytometry as it is now included in the current diagnostic standards, since at the time of collection (2002–2013) this diagnostic modality was not part of clinical routine, but on the basis of TCR clonality (GeneScan analysis21) and loss of CD8 expression in >50% of CD3-positive intraepithelial T-cells. Patients fulfilling clinical criteria for RCD but with preserved CD8 expression and no evidence for TCR clonality were classified as RCD type I. Patients without CD (n=9) underwent gastroscopy due to unclear upper abdominal symptoms but examination revealed no pathological findings. A small group of patients with a Marsh I enteropathy only (n=3), but without CD (ie, negative coeliac serology/no improvement on a GFD/HLA-DQ2 negative), were classified as a second control group, called ‘Marsh I’. In five patients, biopsy specimen of two independent examinations was collected to analyse the reproducibility of data.
Characteristics of patients enrolled in the study
Immunohistochemistry and histology
Duodenal biopsies were reviewed by experienced pathologists and classified according to Marsh22 and Oberhuber et al.23 Quantification of CD3-positive T-cells was analysed by immunofluorescence using an anti-CD3 antibody. The average T-cell content was 12.1%±1.2% (range 5.6%–19.6%; online supplementary figure S1).
Sequencing of TCRβ gene rearrangements and clonotype analysis
For HTS of TCRβ gene rearrangements, amplicons covering the CDR3 and proportions of the respective Vβ-segments and Jβ-segments were generated as described previously (see also supplementary material methods section for details).24 Clonotypes consist of clusters of identical or almost identical (maximum 1 bp difference) sequences of TCRβ gene rearrangements. For each patient, the percentage distribution and the composition (diversity) of the clonotypes was assessed. To identify identical TCRβ rearrangements, intersection between clonotypes was determined and displayed as a heatmap. For detection of public clonotypes, we compared in silico translated peptide CDR3 sequences of our data set with published CDR3 sequences of patients with CD without allowing amino acid mismatches.25 ,26 Results of T-cell diversity analysis were not corrected for percentage of T-cells found in the samples, since this was not inter-related (see online supplementary figure S2).
Statistics
Non-parametric analysis between data groups were performed by the Mann-Whitney U test using GraphPad PRISM V.6 software (GraphPad Software, La Jolla, California, USA). Linear correlation between T-cell diversity and patient age was tested by calculation of the Pearson's correlation coefficient. The biodiversity of each sample was assessed by using the Shannon diversity index defined as:
 where pi=n/N is the proportion of clonotypes n (n=number of reads per clonotype) relative to the total number of clonotypes N (N=number of reads per sample).27 A p value <0.05 was considered to be statistically significant.
Results
TCRβ repertoire diversity in healthy duodenum and various states of coeliac disease
Fifty-two duodenal biopsies of 47 patients were included in the study. Classification was done according to the criteria described in the Methods section yielding samples for ACD (n=12), RCD type I (n=8), RCD type II (n=9), CD GFD (n=11), Marsh I (n=3) and controls (n=9). DNA from all cases was subjected to multiplex TCRβ PCR to amplify all available gene rearrangements. Amplicons were subsequently sequenced by HTS. For comparability of HTS data among the different groups, the same amount of genomic DNA (100 ng) was employed for each TCRβ multiplex PCR assay and the number of T-cells was assessed by immunostaining for CD3. A mean of approximately 1.9×10⁶ joined sequence reads per sample was available for further analysis.
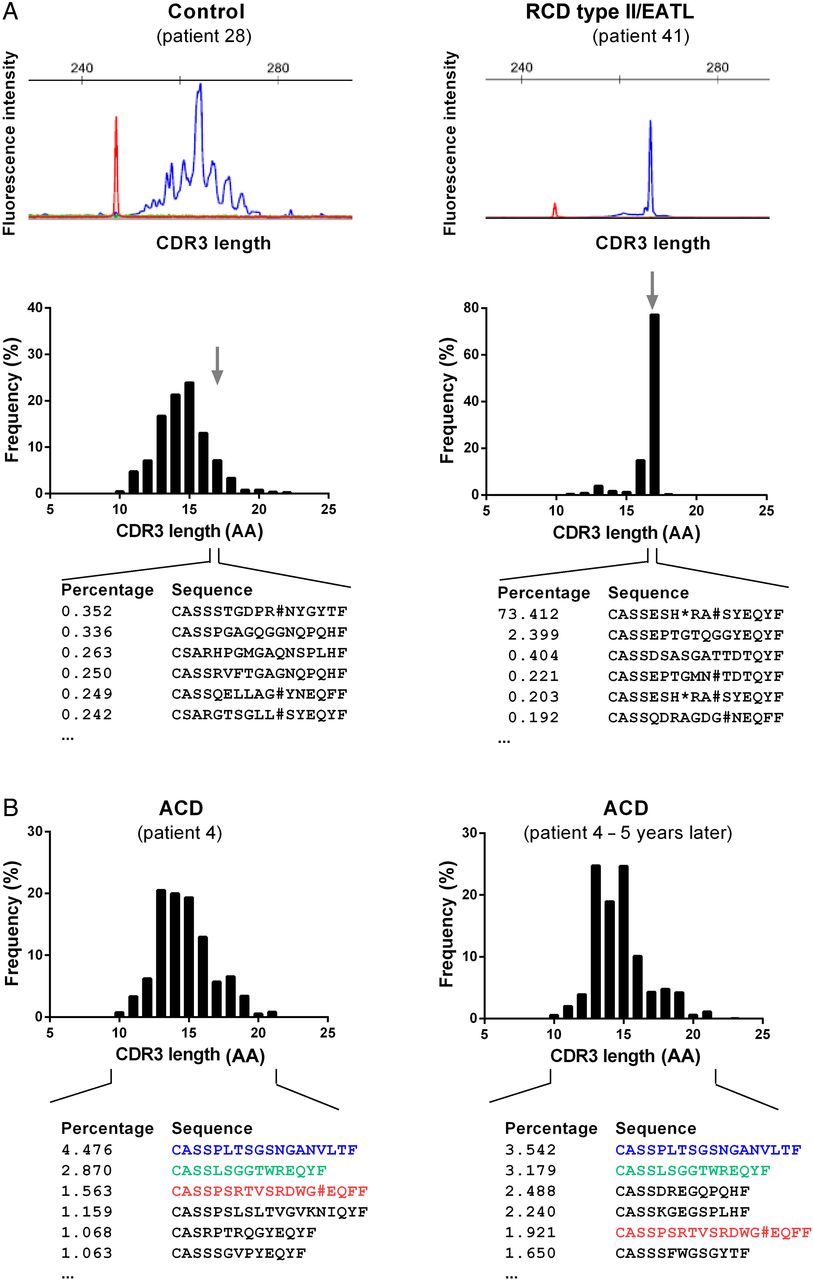
Size distribution comparison of TCRβ gene rearrangements generated by HTS and by conventional capillary electrophoresis (GeneScan) based on BIOMED-2-derived TCRβ amplicons revealed very similar patterns resulting in an identical interpretation of the results in all cases (figure 2A). In contrast to capillary electrophoresis, HTS is able to resolve each individual TCRβ gene rearrangement on the basis of its DNA sequence. To compare our findings with the previously reported preferred V-segment usage in CD-associated T-cells, we examined the V-segment and J-segment usage of HTS-derived TCRβ gene rearrangements among the various patient groups (see online supplementary figure S3A). The analysis was focused on the top 20 clonotypes per individual and compared the RCD type II group with all others to raise the question, if RCD type II clones were distinct in their V-segment usage. We detected a borderline significant association with TRBV6 and TRBV7 (p=0.045 and p=0.050, respectively, online supplementary figure S3B). However, statistics turned insignificant once multiple testing was applied. Moreover, when statistics were done group-specifically or when all clonotypes (>0.03%) were included, this borderline significant finding was not confirmed (see online supplementary figure S3A). Thus, we could not definitely confirm the previously reported distinct usage of V-segments in RCD type II.28 We then further focused V-segment usage analysis on the subgroup of RCD type II and RCD type II/EATL and found some indicators of distinct V-segment usage of RCD type II and RCD type II/EATL (see online supplementary figure S4). This was supported by the fact that the hierarchical clustering algorithm almost perfectly grouped RCD type II and RCD type II/EATL. Interestingly, this grouping was presumably caused by usage of the T-cell receptor beta V (TRBV) genes 19, 2, 15, 3 and 29. With respect to the limited number of cases, larger cohorts will be needed for more confirmative assumptions.

T-cell repertoire (TCR)β repertoires in patients with coeliac disease (CD). (A) Representative complementarity-determining regions 3 (CDR3) length spectrum of TCRβ sequences as determined by capillary gel electrophoresis (GeneScan, BIOMED-2 primer combinations, upper panel) or high-throughput sequencing (HTS)-based TCRβ multiplex analysis of a control individual and a representative patient with refractory coeliac disease (RCD) type II (lower panel). For the digital HTS-based CDR3 length spectrum sequences of the most frequent TCRβ clonotypes with 17 amino acids (AA) in length are shown. TCRβ CDR3 size is defined as all AA starting from the conserved 5′ cysteine in the V-segment and ending at the conserved 3′ phenylalanine in the J-segment. In red the size marker is delineated. (B) Two independent digital CDR3 length distribution of TCRβ sequences of the same patient with active coeliac disease (ACD) sampled in an interval of 5 years. The most frequent TCR sequences were shown and identical CDR3 sequences were coloured.
The current clinical approach to classify RCD based on T-cell clonality uses the occurrence of reproducible dominant peaks after GeneScan analysis, whereas HTS enables the detection of clonality by precise quantification of the number of sequence reads in clonotypes and the clonotype distribution as a feature of TCR diversity. In the control group, the mean frequency of the most frequent clonotype was 6.8% (range from 2.0%–17.7%). In contrast, the frequency distribution found in RCD type II was highly scattered, revealing dominant clonotypes with frequencies up to 73.4% and as low as 2.4% (mean: 42.6%). According to this observation, we introduced an additional classification of patients with RCD type II, which distinguished patients with RCD type II who later developed an EATL (RCD type II/EATL) from those that did not (RCD type II). Of note, patients who were assigned to the RCD type II/EATL group had no clinical characteristics of EATL at the time of endoscopy when samples used for our study were acquired. Strikingly, 80% of patients with RCD type II (4/5) progressing to an EATL had frequencies of the most common clonotype >50%, resulting in a highly significant difference if compared with any other CD group (ACD p=0.0005; CD GFD p=0.0005; RCD type I p=0.0016; Marsh I p=0.0357) as well as to controls (p=0.0010; figure 3A). In line, significantly lower numbers of clustered clonotypes were detectable in RCD type II/EATL as compared with ACD (p=0.0009) and RCD type I (p=0.0109; figure 3B). Patients with ACD showed a significantly higher number of clonotypes compared with patients with CD GFD (p=0.0024). In figure 3C, an RCD type II case is compared with a control case with respect to the frequency of the 20 most common T-cell clones, highlighting the strikingly different distribution of clonotypes. To ascertain that differences in frequencies of T-cell clones do not merely reflect the age of the patient as suggested previously for peripheral blood T-cells, we plotted the number of individual clonotypes indicative for T-cell diversity against the age of the patients—irrespective of CD diagnosis.29 Interestingly, no correlation was found (figure 3D). Similarly, no correlation between transglutaminase-IgA titre and the frequency of the most dominant clonotypes was detected (see online supplementary figure S5). The finding of significantly higher clonotype frequencies in RCD type II as well as RCD type II/EATL cases and the accompanied lower TCRβ diversity could be approved by the quantitative assessment of biodiversity via the Shannon diversity index (figure 4).27

T-cell repertoire (TCR)β diversity in patients with coeliac disease (CD). (A) Dot plot of the most common clonotypes in all small intestinal mucosal samples included in this study. Each symbol illustrates the most common clonotype of a single sample in per cent. Group mean values are delineated by a horizontal bar. The average frequency of the most common clonotype in patients with refractory coeliac disease (RCD) type II who progressed to enteropathy-associated T-cell lymphoma (EATL) (RCD type II (EATL)) differs significantly to all other groups (p=0.036, Marsh I). (B) Diversity dot plot of TCR sequences in patients with CD. Each symbol represents the numbers of unique clonotypes of each biopsy. Patients with acute coeliac disease (ACD) presented significantly higher numbers of clonotypes in comparison with the CD gluten-free diet (GFD) (**p<0.005) or RCD type II/EATL group (***p<0.001). However, in patients with RCD type II/EATL significantly lower numbers of clonotypes were found as compared with patients with RCD type I (*p<0.05). For the other groups, no further significant differences could be detected. (C) Clonotype distribution of T-cells in a representative control and a representative patient with RCD type II. Each dot represents the occurrence of a distinct TCRβ clonotype in per cent of overall clonotypes. In RCD type II, a small number of clonotypes is found at very high frequencies at the expense of the remaining sequences. (D) Dot plot of T-cell clonotype numbers per sample. No change of individual clonotype numbers with increasing donor age irrespective of CD diagnosis could be detected.

Dot plot illustrating T-cell repertoire (TCR) diversity of each patient by delineation of corresponding Shannon diversity indices and comparison with peripheral blood CD4+ and CD8+ T-cells. Patients with refractory coeliac disease (RCD) type II/enteropathy-associated T-cell lymphoma (EATL) represents a significant reduced diversity in accordance with any other coeliac disease (CD) subgroup (p>0.05).
TCRβ repertoire variety and stability among patients with CD
In contrast to assays restricted to fragment length, HTS-based data are based on individual TCRβ sequences providing an unlimited resolution of the entire TCR of a given sample. Thus, the presence of individual TCRβ sequences allows to compare sequences interindividually within our study group as well as to compare sequences with published (therefore called public) CDR3 protein sequences.
First, to address the question of stability of the TCR in small intestinal biopsy samples and reproducibility of this technique, we analysed the TCR composition of multiple small intestinal biopsies sampled from the same individual (patient #3, #4, #5, #10 and #43) at different time points (time in between endoscopies from two consecutive days up to 5 years). Thereby, we were able to track defined TCR rearrangements in samples over time. Figure 2B exemplifies the stability of individual T-cell clones over a period of 5 years. This corresponded to a Shannon diversity index that stayed fairly constant in mucosa samples that had been examined repeatedly (see online supplementary figure S6). This implied that (i) TCR diversity data from individual mucosal biopsies are meaningful and that (ii) in the small intestine a set of dominant clonotypes can persist over a long period of time.
Second, to study the variety and re-occurrence of TCRβ sequences within or among CD groups, we compared all clonotypes of individual cases with all other clonotypes of our cohort and displayed the resulting overlaps as a heatmap (figure 5). Interestingly, no disease-specific identical clonotypes or TCRβ motifs were found within the various CD groups. Likewise, no specific TCRβ sequence was found to be identical among all groups.

Heatmap of T-cell repertoire (TCR)β sequence overlap between patients with coeliac disease (CD). The size of intersection in TCRβ-complementarity-determining regions 3 (CDR3) sequences (amino acid level) between all pairwise patients is displayed without clustering of columns or rows. The number of identical clonotypes between two biopsies was encoded in a grey scale. The lower triangular matrix displays the overlap of TCRβ-CDR3 sequences between samples with frequencies over 0.03% (35 361 sequences in total). The upper triangular matrix illustrates the identical overlap including all TCRβ-CDR3 sequences over 0.3% (2445 sequences in total). Overlapping sequences between two biopsies of one patient are highlighted. ACD, active coeliac disease; GFD, gluten-free diet.
Identification of public TCRs
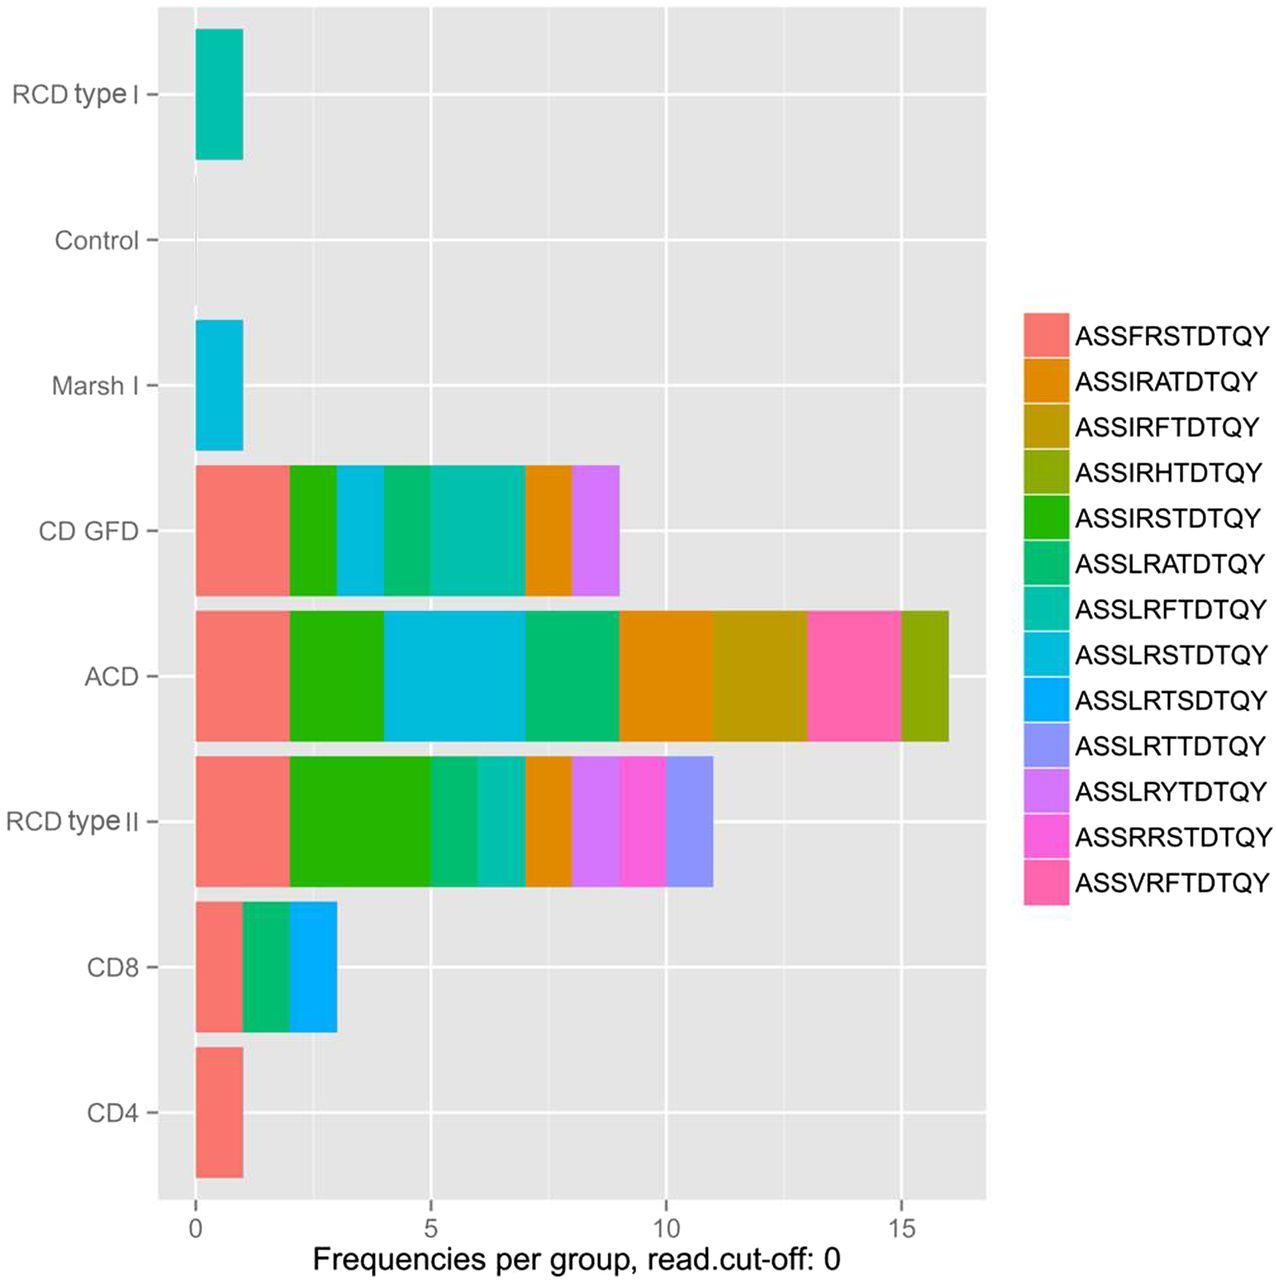
To identify previously published CD-related TCRβ sequences in our data set (designated as ‘public TCRs’), an alignment analysis of the corresponding CDR3 peptide sequences was performed (figure 6).30 First, the highest frequency of public CDR3 sequences was detected in the ACD group, which appears plausible, since this finding presumably reflects the active gliadin response. Interestingly, a small number of public TCRs was also found in the peripheral blood of healthy donors suggesting that healthy individuals rarely reveal a presumably limited immune response to gliadin peptides that is not further progressing to an enteropathy (figure 6). Since public TCR sequences in subjects with Marsh I and RCD type I occurred at similar levels if compared with healthy controls, it can be assumed that immune pathology of these two entities is different from CD. In contrast, TCR sequences from ACD, CD-GFD or patients with RCD type II included public TCR sequences that previously had been associated with CD. It is worth noting that the most dominant of these public sequences had a frequency of <0.04% and approaches the previously reported frequency range of gliadin-specific CD4+ T-cells, which was determined by a totally unrelated approach, that is, tetramer staining of isolated intestinal T-cells (0.1%–1.2% of CD4+ T-cells).31 Moreover, this indicates that none of the public CDR3 peptide sequences had expanded to a dominant clonotype in any of the CD groups (see online supplementary table S1)—this also includes public, virus-specific TCR rearrangements (see online supplementary figure S7 and supplementary table S2).32 ,33 ,34 Instead, it is justified to assume that gliadin-independent T-cell clones dominate the duodenal mucosa in RCD. Since all analysis were carried out using a cut-off value (frequency >0.03%), analysis was repeated without this cut-off. This did not result in the detection of RCD type II clonotypes in the other CD types.

Public T-cell repertoire (TCR)β sequences of small intestinal T-cells and peripheral blood CD4+ and CD8+ T-cells. Alignment analysis of the complementarity-determining regions 3 (CDR3) peptide sequence revealed homology with previously published public, gliadin-specific CDR3 sequences. The numbers of public sequences are plotted group-specifically. Of 39 CDR3 sequences that were evaluated, 13 were identified in our data set, some of which occurred in multiple subjects (number of individuals with confirmed public TCR-CDR3 sequence: control=0, ACD=5, CD GFD=4, RCD type I=1, RCD type II=4, Marsh I=1, CD4+ T-cells=1, CD8+ T-cells=3).25 ,26 The percentage of reads corresponding to the detected clonotypes range at the low distribution end with a maximal occurrence of 0.036 read per cent. A detailed overview of the detected public TCRβ sequences and their individual occurrence are given in online supplementary table S1. ACD, active coeliac disease; CD, coeliac disease; RCD, refractory coeliac disease; GFD, gluten-free diet.
Discussion
CD is an autoimmune, T-cell-driven disease that causes mucosal atrophy in the small intestine. Interestingly, the course of disease is heterogeneous. While the majority of CD is curable by a strict GFD, two types of refractory CD (RCD type I and II) exist. Whereas RCD type I can be controlled by immunosuppressive treatment in most cases, RCD type II, characterised by clonally related intraepithelial T-cells, progresses in up to 50% to an EATL within 5 years.5 ,6 Since the prognosis of a patient having progressed to overt T-cell lymphoma is often fatal, it is essential to reliably recognise patients at-risk early in their disease course in order to introduce timely immunosuppressant in RCD type I or cytoreductive treatment in RCD type II. Identification of clonal T-cell populations in the small intestinal mucosa of patients with refractory CD is currently performed either by conventional immunohistology, analysis of TCR gene rearrangement or by flow cytometric analysis of isolated intestinal lymphocytes after immunostaining.2 ,3
Previous attempts to decipher the TCR repertoire in CD were hampered by the fact that merely a size distribution of TCRβ rearrangements (GeneScan analysis) or a distribution and usage of rearranged TCR Vβ-segments (spectratyping) could be determined. With the recent development of HTS technologies that allow parallel analysis of huge amounts of heterogeneous sequence mixtures, these limitations have been overcome. By combination of the TCRβ multiplex PCR for simultaneous amplification of all TCRβ rearrangements in a given sample and subsequent HTS, the plethora of PCR products can be resolved to the level of individual sequences. Moreover, HTS generated copy numbers of identical sequences contributed to objectify quantitative statements in molecular pathology. In our study, DNA extracted from small intestinal mucosa biopsies was analysed by a previously established TCRβ-HTS approach in order (i) to compare patterns of CD-specific and RCD-specific TCRβ gene rearrangements with those of individuals with healthy mucosa, (ii) to better understand the impact of dominant CDR3 sequences on the disease course and (iii) to identify the abundance of TCRβ motifs previously shown to be associated with the coeliac immune reaction.24
T-cell diversity in small intestinal mucosa
The first question we addressed refers to the frequency distribution of the TCRβ rearrangements found in small intestinal tissue. The frequency of the most dominant TCRβ rearrangement in control tissue was 6.8% on average (range 2.0% and 17.7%). This contrasts with the frequency of dominant TCRβ rearrangements in peripheral blood T-cells of healthy donors, where an average of 0.8% of the purified CD4+ fraction and 4.7% in the purified CD8+ fraction were described as highest frequencies.24 This is in accordance with previous studies using more indirect measures for T-cell variability, which suggested the existence of an oligoclonal TCR in the small intestine of humans and mice.35 ,36 Particularly studies in young children and in mice preweaning and postweaning have revealed that an initially polyclonal TCR becomes oligoclonal, presumably by gut microbiota-dependent expansion of specific clones that undergo proliferation, by clonal deletion, or by selective clonal emigration.37 ,38 In our study, 5±2 TCR gene rearrangements within an individual sample had a frequency of >1%, pointing to the presence of multiple dominant T-cell populations within the mucosa. Interestingly, all of these apparently oligoclonal TCR sequences were unique when compared with other healthy samples and in the study participants, who were studied repeatedly, clonal T-cell populations revealed a remarkable stability.
Reduced TCR diversity in RCD type II; predictive function of TCRβ-HTS
The major objective of our study was the comparison of the TCR repertoires of RCD type II (as this is regarded as pre-EATL) with RCD type I as well as active and inactive CD (ie, patients on a GFD). For RCD type II, one would expect the TCR repertoire to be reduced, since this condition is known to be associated with dominant TCR rearrangements.9 ,12 ,39 This was confirmed for RCD type II with strikingly dominant TCR sequences, that is, individual TCRβ clonotypes found at frequencies as high as 70% and a significantly reduced number of distinct TCRβ gene rearrangements. This was also reflected by a significant reduction in the Shannon diversity index, which is a well-established measure of diversity.27
By distinction of the RCD type II group with or without progression from EATL, significant higher frequencies of dominant TCR rearrangements were detectable in patients with progressive disease. This is exemplified by the finding that all patients of our cohort (with the exception of one) with a TCRβ clonotype frequency >50% showed progression to an overt T-cell lymphoma. This observation might be especially relevant, since a biomarker that has predictive function is currently lacking. Conventional diagnostics including GeneScan and CD8/CD3 immunohistochemistry as well as flow cytometry are established parameters in the diagnosis of RCD, but display no prognostic value regarding clinical outcome.
Identity of TCRβ sequences in RCD type II
The presence of individual and highly frequent T-cell clones in patients with RCD type II poses the question, if these TCRs represent private or public sequences. Using the HTS-generated TCR sequence information, we present evidence that these dominant T-cell clones are private and unique for each patient with RCD type II. Of note, no disease group-specific, public sequences were found even at frequencies as low as 0.05%.
Moreover, no previously published ‘coeliac’ TCR sequences (CDR3 sequences from gliadin-restricted T-cells) were detected within the subset of dominant clonotypes. In fact, we were able to identify gliadin-dependent TCR rearrangements, however, exclusively within clonotypes of very low frequencies. On the one hand, this exemplifies the extraordinary sensitivity of TCRβ-HTS, since it was capable to identify T-cell populations at an extremely high level of scarcity. On the other hand, this finding appears to be at variance to previous studies regarding the frequency of these clonotypes. However, in previous studies, in vitro propagated T-cells were analysed, whereas our data reflect the unbiased in vitro situation present in primary tissue specimens.26 ,30 Furthermore, gliadin-dependent sequences detectable in our samples were present most often in patients with ACD, whereas RCD type II and inactive CD showed less overlaps with public TCR sequences. The rareness of matching events (<0.04% of public TCR clonotypes) is in concordance with previously published frequencies and also reflects the fact that unstimulated T-cells (ie, T-cells not expanded with gliadin in vitro) were tested. Since public sequences were never detectable in the major clonotypes of patients with RCD type II, it is justified to conclude that these T-cell clones are not derived from gliadin-restricted T-cells and that these sequences appear to be unique (ie, private) within the RCD type II group. In this regard, data from Tjon et al40 support the idea of a non-functional TCR in RCD type II, as they realised that TCR-CD3 complexes from RCD type II aberrant lymphocytes are subject to a defective intracellular trafficking, thereby rendering the receptor in an intracellular compartment, which is inaccessible for conventional TCR stimuli. Furthermore, it was shown for ACD that CD3+ NKG2C+ intraepithelial cytotoxic T-cells oligoclonally expand leading to a high percentage of T-cells expressing the same TCRBV segments.41 The dominant TRBV segments detected were unique for each patient, which is in agreement with the ‘privacy’ of TCR sequences identified in our study.
Validity of TCRβ-HTS data
The reliability of data generated by our highly sensitive TCRβ-HTS approach is indicated by the following considerations: (i) independent mucosal samples of the same individual display a remarkable consistency of the patient-associated T-cell diversity (Shannon diversity index) and (ii) identical dominant T-cell populations persist with a reproducible frequency over many years in the respective patients. Previous studies were unable to ascertain this finding at the sequence level but drew similar conclusions based on the length distribution of the dominant PCR products as revealed by GeneScan or spectratyping analyses.
Finally, we want to sum up potentials and major advantages of using the TCRβ-HTS in RCD as proposed in this study:
TCRβ-HTS reveals the identity of clonal small intestinal lymphocytes in RCD type II and thereby has indicated a role for gliadin-independent lymphocytes in RCD type II.
As a prognostic tool, TCRβ-HTS might identify those patients with RCD type II, who are at an immediate risk to develop EATL.
Secondary to its high sensitivity on the one hand and its potential to specifically and reproducibly assign clones to TCR-CDR3 sequences on the other hand, TCRβ-HTS might become a valuable diagnostic tool for future treatment studies in RCD type II. While the conventional GeneScan analysis might fail to detect a pretherapeutically identified clone after effective treatment secondary to its disappearance in the ‘background noise’ (and thereby might falsely label the post-treatment situation ‘successful elimination of the clone’), HTS will likely pick up even residual lymphocyte populations expressing the respective TCR and determine a copy number allowing quantitative judgement of treatment efficacy.
References
Footnotes
Contributors Study concept and design: JR, BS, AR, SD, MH, MS; acquisition of data: JR, SM, AS, SH, MH; analysis and interpretation of data: JR, KZ, KJ, SD, MH, MS; manuscript preparation: JR, BS, AR, SD, MH, MS, statistical analysis: JR, KZ.
Funding Moniek Cranmehr, Hans-Henning Müller, Erika Berg, Claudia Heldt, Ulrike Dethlefs for active support. We received funding from the Deutsche Zöliakie Gesellschaft, Dr. Schär and the Clinical Scientist programme of the Charité. The sponsors were neither involved in study design nor the collection, analysis or interpretation of data.
Competing interests None declared.
Ethics approval EA4/016/14.
Provenance and peer review Not commissioned; externally peer reviewed.