Article Text

Abstract
Background The majority of coeliac disease (CD) patients are not being properly diagnosed and therefore remain untreated, leading to a greater risk of developing CD-associated complications. The major genetic risk heterodimer, HLA-DQ2 and DQ8, is already used clinically to help exclude disease. However, approximately 40% of the population carry these alleles and the majority never develop CD.
Objective We explored whether CD risk prediction can be improved by adding non-HLA-susceptible variants to common HLA testing.
Design We developed an average weighted genetic risk score with 10, 26 and 57 single nucleotide polymorphisms (SNP) in 2675 cases and 2815 controls and assessed the improvement in risk prediction provided by the non-HLA SNP. Moreover, we assessed the transferability of the genetic risk model with 26 non-HLA variants to a nested case–control population (n=1709) and a prospective cohort (n=1245) and then tested how well this model predicted CD outcome for 985 independent individuals.
Results Adding 57 non-HLA variants to HLA testing showed a statistically significant improvement compared to scores from models based on HLA only, HLA plus 10 SNP and HLA plus 26 SNP. With 57 non-HLA variants, the area under the receiver operator characteristic curve reached 0.854 compared to 0.823 for HLA only, and 11.1% of individuals were reclassified to a more accurate risk group. We show that the risk model with HLA plus 26 SNP is useful in independent populations.
Conclusions Predicting risk with 57 additional non-HLA variants improved the identification of potential CD patients. This demonstrates a possible role for combined HLA and non-HLA genetic testing in diagnostic work for CD.
- Coeliac Disease
- Genetic Testing
- Hla
- Molecular Genetics
- Celiac Disease
This is an Open Access article distributed in accordance with the Creative Commons Attribution Non Commercial (CC BY-NC 3.0) license, which permits others to distribute, remix, adapt, build upon this work non-commercially, and license their derivative works on different terms, provided the original work is properly cited and the use is non-commercial. See: http://creativecommons.org/licenses/by-nc/3.0/
Statistics from Altmetric.com
Significance of this study
What is already known on this subject?
-
HLA-DQ2 and DQ8 provide the highest genetic risk for CD. However, these genes are present in about 40% of the population, and only a subset will develop disease. Therefore, screening for HLA-DQ2 and DQ8 alleles is helpful only to identify those at extremely low risk for CD.
-
Current recommendations are to perform periodic screening of certain high-risk groups for CD, such as first-degree relatives and those with type 1 diabetes. However, the degree of risk is not uniform among all of these groups.
-
Current methods of genetic testing are inadequate at effectively identifying individuals from the general population at significantly greater risk for CD who may require periodic serological screening for CD.
What are the new findings?
-
Increases in the number of variants associated with CD have helped refine and improve the genetic risk model.
-
Using HLA variants, 57 non-HLA variants, gender and population origin have improved the discriminatory power with the AUC of the ROC curve reaching 84%.
-
Combining HLA and 57 non-HLA variants improved the classification of 11% of individuals to more accurate categories.
How might it impact on clinical practice in the foreseeable future?
-
Although we only screen individuals with a ‘known’ risk for CD (because they belong to an ‘at-risk’ group, the majority of cases of CD comes from individuals who have permissive HLA in the general population. The ability to identify an individual at ‘extreme’ risk for CD could make the current serological screening strategy more effective by personalising the approach in the general population. This is a first step towards the application of genetic testing for CD in the clinical setting and/or on a population level.
-
Genetic testing for CD may assist in the early detection of individuals at risk of CD, ie, those with a first-degree relative with CD and those with autoimmune diseases showing comorbidity with CD.
Introduction
Coeliac disease (CD) is a chronic immune-mediated enteropathy triggered by exposure to dietary gluten in genetically predisposed individuals.1 Screening studies have revealed increased occurrence in some countries, with a prevalence ranging from 0.3% to 3%, always with the majority of cases being previously undiagnosed.2–7 Age at onset ranges from infancy to late adulthood, and clinical presentation can be highly variable, from impaired growth, diarrhoea and abdominal pain to presentations such as iron-deficiency, anaemia and decreased bone density.8–10 Family members of CD patients and those with another immune-mediated disease are at higher risk of developing CD. As symptoms of CD can be subtle or insidious, current recommendations are to screen such at-risk groups with periodic serological testing. The serological antibodies used as markers for CD have a relatively high sensitivity and specificity, and in most cases a small bowel biopsy revealing enteropathy is necessary to confirm the diagnosis of villous atrophy.11
The importance of genetic testing was highlighted in the revised guidelines for the diagnosis of CD recently proposed by the European Society of Paediatric Gastroenterology, Hepatology and Nutrition.12 They recommend typing for HLA-DQ2 and HLA-DQ8 in symptomatic children with high clinical suspicion of CD, but without confirmatory biopsy, to add strength to the diagnosis, as well as to those with an uncertain diagnosis of CD or to those belonging to risk groups, to exclude further testing for CD. These HLA heterodimers are known to be the major genetic risk factors for CD and have a negative predictive value of almost 100%, but the positive predictive value is poor, as approximately 40% of the population carry one or both of these alleles.13 In the past few years, two genome-wide association studies (GWAS) and one fine-mapping project have identified up to 57 non-HLA single-nucleotide polymorphisms (SNP) that contribute to CD susceptibility.14–17 To date, approximately 54% of the genetics of CD can be explained by HLA plus the 57 non-HLA SNP compared to 40% by HLA alone.18 In 2009, we published a genetic risk model for CD using HLA and the 10 non-HLA risk variants resulting from the first GWAS.19 We showed that by using this model, the identification of individuals at high risk of developing CD could be markedly improved. Now, with many more associated loci known for CD, our aim was to test if the genetic risk model could be improved by adding the new variants, assess how well it transfers to other cohorts, and evaluate how well it can be used in clinical practice.
Materials and methods
Study populations
Our study included four groups (table 1): (1) a discovery set of 2675 CD cases and 2822 healthy controls in which we calculated the OR for each SNP after having identified the mode of inheritance; (2) a derivation set of 2675 cases and 2815 controls in which we created the risk model; (3) two sets for validating the risk model, which included a 1709 nested case–control population (validation set 1), and a prospective cohort of 1244 individuals (validation set 2); and (4) a test set of 985 independent individuals on whom we applied the risk model.
The different datasets included in this study: a discovery set for single SNP OR calculation, a derivation set to create the risk models, two validation sets to validate the risk model, and a test set to evaluate the model in clinical practice
The discovery and derivation case–control samples were previously included in our CD meta-analysis and incorporated cohorts from The Netherlands, Italy, Poland, Spain and the UK.17 To prevent over-fitting of the model, we randomly selected 50% of the cases and controls to form a discovery dataset in which we calculated the OR, while the other half became the derivation set to create the risk model (table 1). The samples were evenly distributed across the different populations, except for the UK cohort, from which we randomly selected 700 cases and 1000 controls to obtain sample sizes equal to the other populations.
The first validation set included cases and matched controls from a Swedish cross-sectional CD screening of 12-year-old children. Most of these children were born in 1993 or 1997.5 ,20 ,21 Together the two cohorts contain 306 CD patients for whom DNA was available. Gender-matched controls (1403 individuals) were randomly selected among those with normal levels of CD markers belonging to the corresponding cohort. As there was no difference between the frequencies of SNP in the two cohorts, we treated the 1993 and 1997 cohorts as one collection in our analysis.
The second validation set included 1244 non-Hispanic, white American children from a prospective population-based cohort from Denver, Colorado, USA; they are being followed from birth for the development of transglutaminase auto-antibodies and CD (the DAISY study).22
The test set included 985 parents of high-risk CD children (those with a first-degree relative with CD) from The Netherlands, Italy, Poland and Spain, which were collected as part of the PreventCD project.21
Each dataset was collected for different purposes by different investigators and are independent of each other. All subjects had self-reported Caucasian ancestry and have been described elsewhere.17 ,20–22 CD patients in the discovery, derivation and test sets had a biopsy-confirmed diagnosis. In validation 1 set, CD diagnosis required villous atrophy or intraepithelial lymphocytosis in combination with the presence of HLA-DQ2 or HLA-DQ8, as well as symptoms or signs supporting the diagnosis. In validation 2 set, CD was defined as having a very high and persistent level of transglutaminase auto-antibodies or confirmed by biopsy, so we refer to this group as having CD autoimmunity.23
Genotyping
Individuals homozygous for HLA-DQ2.5 or HLA-DQ2.5/DQ2.2 genotypes have an increased CD risk compared to those homozygous for HLA-DQ2.2 or DQ8, or heterozygous for HLA-DQ2.5, DQ2.2 or DQ8, while individuals with no-DQ2/DQ8 have practically no risk for CD.19 ,24–26 To predict whether an individual has 0, 1 or 2 HLA-DQ2 and/or DQ8 alleles, we genotyped six tagging SNP.27 We then categorised the individuals into three risk groups: low-risk (coded 0) if they were HLA-DQ2/DQ8 negative (ie, neither HLA-DQ2.5, DQ2.2 nor DQ8), high-risk (coded 2) for those homozygous for HLA-DQ2.5 or HLA-DQ2.5/DQ2.2, and intermediate risk (coded 1) for all other combinations.19
To assess if the new susceptibility variants improve risk prediction, we compared three genetic risk scores (GRS) calculated using: (1) 10 non-HLA SNP from the first GWAS and its follow-up;14 ,15 (2) 26 non-HLA SNP from the second GWAS;16 and (3) 57 non-HLA SNP from the fine-mapping project17 (see supplementary table 1, available online only). All these SNP were reported at genome-wide significance (p<5×10⁻⁸) in each study.
For the discovery and derivation sets, genotype data were acquired as part of our fine-mapping project using Immunochip, a custom-made platform from Illumina.28 A stringent quality control check was performed on these samples.17 Samples in validation sets 1 and 2, and in the test sets were genotyped on Illumina 48-plex VeraCode technology for the 26 SNP identified in the second GWAS only and the six HLA tagging SNP, following Illumina's protocol. Genotyping data analysis and clustering was performed in GenomeStudio. Genotype clusters were manually investigated and adjusted if necessary. All plates included one duplicate sample and one positive control. One SNP, corresponding to IL18RAP locus (imm_2_102429801), was not present on VeraCode, so we used a perfect proxy (rs917997, r2=1, D′=1) (see supplementary table 1, available online only).
Statistical analysis
Using the derivation cohort, we coded each SNP genotype as 0 for the non-risk homozygous, 1 for the heterozygous, and 2 for the homozygous risk, then determined the type of inheritance mode by analysing the genotypes as categorical variables in logistic regression and adjusting for HLA group, gender and population origin. Comparing the Akaike information criterion (AIC) from each model, we saw no major differences between the inheritance models and therefore used the log-additive model, which was the best-fit model for most SNP.
In order to account for a difference in risk contribution from each SNP, we used a weighted method and calculated an average GRS for each individual. First, we multiplied the β-coefficients in supplementary table 1 (available online only) by the number of risk alleles (0, 1, 2) for each SNP per individual, took the sum across 10, 26 or 57 non-HLA SNP, and then divided the total by the number of alleles included in the model to obtain an average weighted GRS per allele. Only individuals with a defined HLA genotype and with more than 95% of genotypes available were included in the analysis. We used an averaged GRS per allele in order to be able to compare GRS from different datasets with different numbers of SNP that passed the quality control. Then, the GRS were categorised in quintiles of the control population. The controls in validation set 1 were healthy individuals who had a negative screening result for CD; we used both cases and controls to calculate the quintiles. For validation set 2, we had genotype data from 986 non-Hispanic white American individuals from the general population, which we used to calculate the quintiles. In each validation set, we estimated the risk for each category of the GRS in a logistic regression using the third quintile (p40–p60) as a reference group adjusting for HLA group, gender and population origin.
To evaluate the overall discrimination of our genetic model, we calculated the area under the receiver operator characteristic (ROC) area under the curve (AUC) for HLA only and combining HLA and the GRS. We also calculated the net reclassification improvement (NRI) and the integrated discrimination improvement (IDI). A two-tailed p value less than 0.05 indicated statistical significance. All analyses were performed using PLINK v1.07, the R package PredictABEL, and SPSS V.16.0.29 ,30
Results
Figure 1 shows the distribution of HLA and the three GRS in the large derivation set of 2675 CD cases and 2815 controls. The mean in cases is shifted towards a higher GRS in all three models compared to the mean in controls, showing a clear separation of distribution between the two groups. We divided participants into five categories defined as quintiles of the control populations to make it easier to interpret the results of an average weighted GRS (the third quintile was considered the reference category). The OR increases with increasing risk score for all three GRS models (see supplementary figure 1, available online only). The GRS_57 performs better than GRS_26 and GRS_10 mainly in the top quintile (p80–p100). Individuals in the top quintile of GRS_57 had a 2.5 times higher risk (95% CI 2.1 to 3.0) than those with a mean GRS, and a 7.2 times higher risk (95% CI 5.7 to 9.2) than those in the bottom quintile.

Distribution of HLA group and average risk scores of the genetic risk score (GRS)_10, GRS_26 and GRS_57 models in 2675 cases and 2815 controls. GRS_10, GRS_26 and GRS_57 show a clear separation of distribution between cases and controls with the mean (SD) in cases (0.103 (0.020), 0.071 (0.009), 0.069 (0.006), respectively) being statistically different to the mean (SD) in controls (0.095 (0.020), 0.067 (0.009), 0.066 (0.006), respectively) (p=2.71×10−45, 3.41×10−67, 3.2×10−111, respectively (independent sample two-tailed t test)).
Figure 2 shows the ROC curves for HLA only, HLA plus GRS_10, HLA plus GRS_26 and HLA plus GRS_57. The AUC estimates were improved with an increasing number of susceptibility variants used in the model. Combining HLA with 57 non-HLA SNP showed the best discrimination, with an AUC reaching 0.854. The improvement between the HLA-only model and the models with HLA plus GRS was statistically highly significant (p=0.0001).
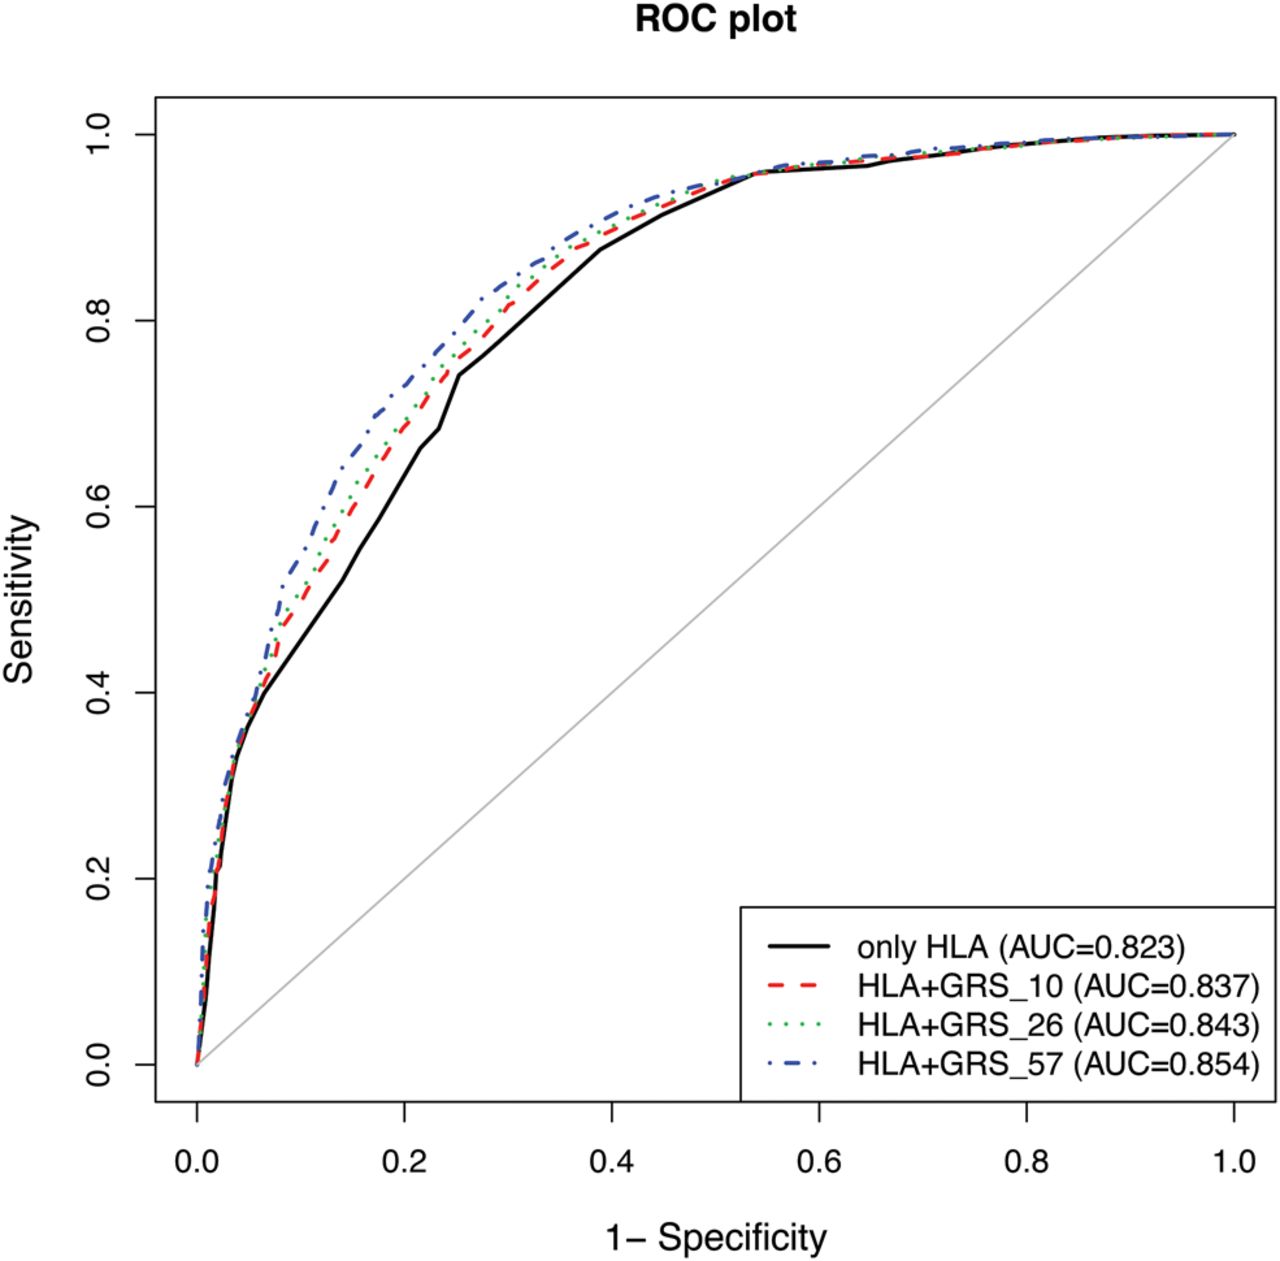
Receiver operator characteristic (ROC) curves and area under the curve (AUC) for the HLA-only model (AUC=0.823; 95% CI 0.812 to 0.834), and combined HLA plus GRS_10 (AUC=0.837; 95% CI 0.827 to 0.848), HLA plus GRS_26 (AUC=0.843; 95% CI 0.832 to 0.853) and HLA plus GRS_57 (AUC=0.854; 95% CI 0.844 to 0.864) models.
To confirm that adding non-HLA risk variants improved risk prediction, we tested the ability of the combined HLA and GRS models to reclassify individuals into predefined risk groups based on HLA testing only. The individuals could be grouped into three categories: low (predicted risk <25%), intermediate (25–75%) and high-risk (>75%), thus we used the same cut-offs to classify individuals using the models with HLA plus GRS (figure 3). Among the 1590 cases that have intermediate risk based on their HLA only (derivation set), 241 (15.1%) individuals were moved into the high-risk category (>75%) when their GRS with 57 variants was added (table 2). Similarly, 25 (18.2%) of the 137 controls first classified as high risk (>75%) were moved to the intermediate-risk category and 212 of 1373 intermediate-risk controls (15.4%) were moved to the low-risk category (<25%). NRI and IDI were statistically significant for all models. Even when we used 20% and 80%, or 30% and 70% as cut-offs, the NRI and IDI were still significant. The model with 57 SNP performed best by reclassifying 11.1% of the individuals into a more accurate risk group, while GRS_26 reclassified 7.1% and GRS_10 reclassified 4.1%.
Reclassification table of individuals of predicted risk using HLA-only versus combined HLA and GRS_10, GRS_26 and GRS_57 (low risk <25%, intermediate risk 25–75%, high risk >75%)

Plot of predicted risk using HLA-only model versus HLA and genetic risk score (GRS) models showing how individuals can be shifted from one risk group to another. The GRS_57 model shows the largest number of individuals who were reclassified. All models were adjusted for gender and five-population origin. The black vertical line defines the three groups based on HLA (low <25%, intermediate 25–75%, high >75%), while the blue dashed line is the 25% predicted risk and the red dashed line is the 75% predicted risk based on HLA plus non-HLA variants.
To assess if such a genetic risk model is applicable to other populations, we tested the GRS with 26 SNP in two nested case–control studies from Sweden (validation set 1) and in a prospective cohort from the USA (validation set 2), both of which had not been assessed in previous gene discoveries.
In the Swedish study, the mean of GRS_26 in controls of 0.068 (SD 0.0099) was statistically different from the mean of cases (0.071, SD 0.0097) (independent sample two-tailed t test=1.28×10⁻⁵). Based on HLA genotypes, we first categorised the individuals into three groups and identified only one CD case in the low-risk group (no HLA-DQ2/DQ8), indicating the high negative predictive value of HLA typing to exclude CD risk. We further focused our test on those individuals positive for DQ2 and/or DQ8 (n=1035). The predicted risk based on HLA only ranged from 23.57% to 27.74% for the intermediate HLA group, and 60.95% to 66.02% for the high-risk HLA group. Using the lowest ranges as a cut-off for reclassification, 31% (215/695) of the controls in the intermediate group (23–60%) were moved to the low-risk group (<23%). The NRI of HLA-only versus HLA plus GRS_26 was 0.116 (95% CI 0.051 to 0.180; p=0.00042), while IDI was 0.013 (95% CI 0.006 to 0.020; p=0.0004) (data not shown).
In the prospective cohort (validation set 2), we categorised individuals based on quintiles calculated from a general population cohort and used the lowest quintile (p0–p20) as a reference group. Based on HLA, there were no CD autoimmunity cases in the lowest group and our analysis continued with 1116 individuals who were DQ2 and/or DQ8 positive. Using the Cox proportional hazard model adjusted for gender, recruitment group and HLA, we observed an increase in HR with increasing risk score category (see supplementary figure 2, available online only). Although this was not statistically significant, it showed a trend of association, with the top group having a HR of 1.8 (95% CI 0.81 to 3.98) compared to individuals in the lowest quintile.
To test how well this risk profiling can be used in clinical practice, we calculated a predicted risk for 985 independent individuals (test set) before unravelling their status using the OR calculated in validation set 1 (see supplementary table 2, available online only). We then grouped the individuals into the risk categories defined earlier. After checking the CD status of individuals, we compared their classification from using only HLA in the model to using HLA plus GRS_26. Combining HLA and 26 non-HLA variants in the model led to 14.6% of the individuals being reclassified into more appropriate categories (table 3).
Reclassification table for HLA-only versus combined HLA and GRS_26 in the test set of 985 individuals
Discussion
We demonstrate that combining HLA and non-HLA variants increases the diagnostic accuracy of genetic testing for CD. Previously, we showed better classification with a simple count model of 10 non-HLA variants.19 Now we have further developed this model by including up to 57 non-HLA SNP and comparing four genetic risk models for CD including gender and population origin. We used a weighted GRS to account for the differences in OR of each allele. All three GRS were associated with CD in our case–control derivation set, with individuals in the top quintile having 1.68, 2.00 and 2.50 times higher risk of CD compared to those in the middle quintile. Individuals in the bottom quintiles had 0.54, 0.44 and 0.45 times less risk of developing CD than someone with a mean GRS from the general population.
Adding non-HLA variants to the HLA prediction improved not only the discriminatory power as assessed by the ROC curves, but also the reclassification of individuals into more accurate risk categories with the increase in NRI and IDI. Compared to other genetically complex diseases such as multiple sclerosis and type 2 diabetes, in which AUC only reached 0.769 and 0.74, respectively, our GRS in CD performs well.31 ,32 Our best AUC reached 0.854 for the GRS_57 model. This is in the same range as the Framingham risk score for coronary heart disease (AUC∼0.8), which is clinically useful.33 Moreover, our risk model appears to be applicable to clinical practice and transferable to other populations, being specifically useful in individuals positive for HLA-DQ2 and/or DQ8.
The ability to identify subgroups of those at ‘extreme’ risk or lower risk for CD will enable more accurate classifications of research subjects in clinical trials. For example, PreventCD is an ongoing intervention study that will evaluate whether the controlled introduction of small quantities of gluten between the age of 4 and 6 months can prevent the occurrence of CD in children carrying HLA-DQ2 and/or DQ8. However, many children in the study will never develop CD, as they do not carry the other risk factors required. This means that larger numbers of individuals are needed to test the potential treatment adequately.21 The enhanced risk modelling will help classify individuals into higher and lower risk groups more accurately, by using both HLA and non-HLA genetic signatures, thereby permitting a more efficient study design and analysis in the future.
From a clinical perspective, there are several at-risk groups of individuals who will require periodic serological screening for CD throughout their lifetime. It has been argued, although not universally recommended, that HLA testing could be done first to identify carriers of HLA-DQ2 and/or DQ8 and then to perform repeated serological testing only in those individuals in the future (although the risk of developing CD is not equal for HLA-DQ2 and HLA-DQ8 carriers). From a cost perspective, this might be an efficient strategy as genotyping is relatively cheap and only needs to be done once, whereas serological testing is more expensive and needs to be repeated frequently. Excluding individuals who do not carry the genetic risk for developing CD from serological testing would reduce the cost and burden of repeated invasive testing. The age at which serological screening in an at-risk child should begin, how frequently to test, and when to perform intestinal biopsy are all issues that are still under discussion. The added value of non-HLA genetic factors is that they may allow us to stratify the population better into those in need of repeated serology screening, as HLA testing alone would still include some 30% of the population. Using only the presence or absence of HLA as a screening tool to help in the diagnosis of CD has a positive predictive value of 94%, but a sensitivity of 35%. However, by using our model, which combines different HLA risk variants with non-HLA risk variants, to classify individuals into a high-risk group decreases the positive predictive value to 57%, but increases the sensitivity to 63%. Thus, including non-HLA risk factors suggests that we can reclassify 14.6% of the population into more accurate risk categories, which might help to make a better selection of those who need closer follow-up and repetitive antibody testing.
Acknowledgments
The authors would like to thank all the participants in this study, Mathieu Platteel and Astrid Maatman for preparing samples and genotyping, and all the doctors who collected the DNA. They acknowledge the use of DNA from CEGEC (Spanish Consortium on the Genetics of Coeliac Disease), and also thank Jackie Senior for critically reading the manuscript.
References
Supplementary materials
Supplementary Data
This web only file has been produced by the BMJ Publishing Group from an electronic file supplied by the author(s) and has not been edited for content.
Files in this Data Supplement:
- Data supplement 1 - Online appendix
- Data supplement 2 - Online figures
- Data supplement 3 - Online table 1
- Data supplement 4 - Online table 2
Footnotes
JR and AR contributed equally to this article.
HMB, EL, CW jointly directed this project.
-
Correction notice This article has been corrected since it was published Online First. The list of Collaborators has been updated.
-
Collaborators The PreventCD study group. Cristian Scerri, Tunde Koltai; Sanja Kolaček, Zrinka Mišak, Slaven Abdović; Sibylle Koletzko, Gertraud Osiander, Katharina Werkstetter; Eckart Mummert; Ilma R Korponay-Szabo, Judit Gyimesi; Raanan Shamir, Corina Hartman; Enzo Bravi, Marco Poles; Renata Auricchio, G Gianna Giovamma Limongelli, Luigi Greco, Riccardo Troncone; Vincenzo Villanacci; Jacques G Bindels; Ronald Brand, Bibi Funke Kupper, Caroline E Hogen Esch, Erica G Hopman, Frits Koning, Yvonne Kooy-Winkelaar, Chantal te Marvelde, Hein Putter, Els Stoopman, Sabine Vriezinga; Ludvig M Sollid, Melinda Ráki; Ania Chmielewska, Piotr Dziechciarz, Małgorzata Pieścik-Lech, Hania Szajewska; Anna Szaflarska-Szczepanik; Gemma Castillejo, Amalia Capilla, Vicente Varea; Carmen Ribes-Koninckx, Anna Lopez, Paula Crespo; Eva Martinez, Isabel Polanco; Lotta Högberg, Lars Stenhammar; Annelie Carlsson, Charlotta Webb; Solveig Hammarroth; Olle Hernell, Carina Lagerqvist, Anna Myléus, Katrina Nordyke, Fredrik Norström, Olof Sandström, Stig Wall; Eva Karlsson.
-
Contributors CW, EL and HMB led the study. Major contributions were: JR, AR and CW wrote the paper; JR, GT, AS and SAJ performed DNA sample preparation and genotyping assays; JR, VK, LF, JGA and CCvD performed statistical analysis. Other authors contributed mainly to sample collection and phenotyping. All authors reviewed the final manuscript. CW had full access to all the data in the study and takes responsibility for the integrity of the data and the accuracy of the data analysis. JR and AR contributed equally. HMB, EL and CW jointly directed this project.
-
Funding This study was supported by grants from the Coeliac Disease Consortium (an innovative cluster approved by The Netherlands Genomics Initiative and partly funded by the Dutch government, grant BSIK03009 to CW), The Netherlands Organisation for Scientific Research (NWO-VICI grant 918.66.620 to CW), the Dutch digestive disease foundation (MLDS WO11-30 to CW), by the European Union project PreventCD (FP6-2005-FOOD-4B-36383-PreventCD), the parent CEDAR grant (R01 DK050979) and by grant number 5R1DK084568-02 from the National Institutes of Health.
-
Competing interests None.
-
Ethics approval All cohorts have previously been published and each centre obtained approval from its own ethics committee/institutional review board.
-
Provenance and peer review Not commissioned; externally peer reviewed.