Article Text

Abstract
Objective We investigated how pancreatic cancer developed resistance to focal adhesion kinase (FAK) inhibition over time.
Design Pancreatic ductal adenocarcinoma (PDAC) tumours from KPC mice (p48-CRE; LSL-KRasG12D/wt; p53flox/wt) treated with FAK inhibitor were analysed for the activation of a compensatory survival pathway in resistant tumours. We identified pathways involved in the regulation of signal transducer and activator of transcription 3 (STAT3) signalling on FAK inhibition by gene set enrichment analysis and verified these outcomes by RNA interference studies. We also tested combinatorial approaches targeting FAK and STAT3 in syngeneic transplantable mouse models of PDAC and KPC mice.
Results In KPC mice, the expression levels of phosphorylated STAT3 (pSTAT3) were increased in PDAC cells as they progressed on FAK inhibitor therapy. This progression corresponded to decreased collagen density, lowered numbers of SMA+ fibroblasts and downregulation of the transforming growth factor beta (TGF-β)/SMAD signalling pathway in FAK inhibitor-treated PDAC tumours. Furthermore, TGF-β production by fibroblasts in vitro drives repression of STAT3 signalling and enhanced responsiveness to FAK inhibitor therapy. Knockdown of SMAD3 in pancreatic cancer cells abolished the inhibitory effects of TGF-β on pSTAT3. We further found that tumour-intrinsic STAT3 regulates the durability of the antiproliferative activity of FAK inhibitor, and combinatorial targeting of FAK and Janus kinase/STAT3 act synergistically to suppress pancreatic cancer progression in mouse models.
Conclusion Stromal depletion by FAK inhibitor therapy leads to eventual treatment resistance through the activation of STAT3 signalling. These data suggest that, similar to tumour-targeted therapies, resistance mechanisms to therapies targeting stromal desmoplasia may be critical to treatment durability.
- pancreatic cancer
- drug resistance
- TGF-beta
- pancreatic fibrosis
- myofibroblasts
Statistics from Altmetric.com
Significance of this study
What is already known on this subject?
Focal adhesion kinase (FAK), signal transducer and activator of transcription 3 (STAT3) and transforming growth factor beta (TGF-β)/SMAD pathways are all hyperactivated in human pancreatic ductal adenocarcinoma (PDAC), and these data suggest they undergo reciprocal regulation in PDAC cells.
Targeting of FAK signalling suppresses PDAC progression and enhances overall survival in animal models, but tumours will eventually develop therapeutic resistance.
FAK inhibitor clinical trials are ongoing in human PDAC patients, and the development of resistance is expected.
STAT3 signalling is linked to treatment resistance in several tumour contexts.
What are the new findings?
Reprogramming of the PDAC tumour microenvironment (TME) by FAK inhibition induces a feedback loop, whereby decreased stromal TGF-β enhances PDAC cell proliferation.
STAT3 signalling is hyperactivated following prolonged FAK inhibitor treatment and enhances FAK-independent PDAC growth.
TGF-β/SMAD3 signalling suppresses STAT3 activation in PDAC cells but is diminished as FAK inhibitor treatment decreases stromal desmoplasia.
Combined inhibition of Janus kinase (JAK)/STAT and FAK signalling shows durable efficacy in PDAC animal models.
How might it impact on clinical practice in the foreseeable future?
There are two ongoing clinical trials in pancreatic cancer that combine FAK inhibitors with either chemotherapy or combined chemotherapy and immunotherapy. Thus, understanding how FAK inhibitor reprogramming of the PDAC TME might alter tumour-intrinsic resistance signalling is important.
Combinatorial targeting of JAK/STAT and FAK signalling is tractable for translation into near-term clinical testing.
Introduction
The prognosis for patients with pancreatic cancer (PC) is dismal, with the 5-year survival rate less than 9%. This poor survival rate is driven by the high propensity of this disease to metastasise and the lack of therapeutic efficacy from cytotoxic, targeted and immune-based therapeutics. One proposed mechanism of resistance to therapy has been the uniquely desmoplastic tumour microenvironment (TME) of pancreatic ductal adenocarcinoma (PDAC). Included in this TME, high stromal density including excessive collagen deposition and activated fibroblasts are thought to provide a barrier to the delivery of cytotoxic and targeted agents and effector T cells and likely improve PDAC cell survival even when these agents are delivered into the tumour.1 2 Disruptors of stromal density are actively being investigated in multiple clinical trials. However, the limitations of and/or mechanisms of resistance to such approaches are only now becoming apparent.
Dysregulation of signal transducer and activator of transcription 3 (STAT3) occurs often in many human solid tumours.3 Janus kinases (JAKs) play the most relevant biological role in linking STAT3 to the activity of cytokines. JAK/STAT3 signalling mediates multiple aspects of cytokine signalling in cancer cells, chiefly accelerating proliferation, increasing resistance to apoptosis and promoting angiogenesis and metastatic potential.4 5 The intrinsic activation of STAT3 in tumour cells is frequently observed in human solid malignancies and is mainly caused by an oversupply of cytokines and growth factors present in the tumour microenvironment.6 7 Recent studies have shown that excessive STAT3 activity in tumour cells provides a common mechanism by which the cells acquire resistance to targeted treatment.8 9
Focal adhesion kinases (FAKs) are non-receptor tyrosine kinases, which include FAK1 and PYK2/FAK2. Several studies have demonstrated that elevated FAK1 expression enhances tumour malignancy and correlates with poor prognosis.10 Previous studies by our laboratory and others have shown that pharmacological targeting of FAK in pancreatic cancer models results in decreased stromal density and thus increases the responsiveness of the tumour to chemotherapy and immunotherapy while simultaneously suppressing tumour progression.11 12 In these studies, we observed that in response to FAK inhibition, most tumours exhibited a period of disease stabilisation followed by resistant growth.11 In the present study, we investigated how stromal depletion leads to altered susceptibility to FAK inhibitor growth suppression through STAT3 activation.
Materials and methods
Pancreatic cancer tissue microarray cohort and analysis
Tissue microarray (TMA) studies were conducted on surgically resected PDAC specimens from patients diagnosed in the Department of Pathology at Washington University. To assemble TMAs, clearly defined areas of tumour tissue were demarcated, and two biopsies (1.0 mm diameter) were taken from each donor block. Four-micrometre paraffin sections were used for immunohistochemical (IHC) analyses. All human tissue studies were approved by the Washington University School of Medicine Ethics Committee. Fully automated image acquisition was performed using a Zeiss Axio Scan Z1 Slide Scanner system with a 10× objective (Carl Zeiss) to capture whole-slide digital images.
Genetic mouse model of PDAC
KPC (p48-CRE; LSL-KRas/KrasG12D/wt; p53flox/wt) and KPPC (p48-CRE; LSL-KrasG12D/wt; p53flox/flox) mice were generated in-house, and C57BL/6 breeders were obtained from the Jackson Laboratory. KPC and KPPC mice were backcrossed to C57BL/6 over six generations and validated as C57BL/6 congenic through single nucleotide polymorphism scanning. Mice were maintained within the Washington University Laboratory for Animal Care barrier facility, and all studies involving animals were approved by the Washington University School of Medicine Institutional Animal Studies Committee.
Orthotopic model and preclinical animal cohorts
Syngeneic orthotopic PDAC tumours were established by surgical implantation, as previously described.11 Approximately 200 000 cells in 50 µL Matrigel (BD-Biosciences) were injected into the pancreas of each mouse. Cohorts of mice were randomised into different treatment groups on gross palpation of tumour in the pancreas. In the transplantable model, 200 000 cells in 50 µL Matrigel (BD-Biosciences) were injected into each mouse’s back/flank. Cohorts of mice were randomised into different treatment groups by tumour volume (calculated as length×(width2)/2). Preclinical studies were conducted with 10–15-week-old female mice. Tumour burden was measured by establishing the gross wet weight of the pancreas and comparing it to that of five parallel mice sacrificed at the beginning of treatment. Mice were maintained within the Washington University Laboratory for Animal Care barrier facility. All studies involving animals were approved by the Washington University School of Medicine Institutional Animal Studies Committee.
Inhibitors and neutralising antibodies
FAK inhibitor (FAKi) was provided by Verastem. VS-4718 is a selective bispecific inhibitor for FAK and Pyk2 kinases, with a biochemical half-maximal inhibitory concentration (IC50) of 1.5 nM. VS-4718 was administered at 50 mg/kg by oral gavage two times a day. STAT3 inhibitor (Stattic) and JAK1/2 inhibitor (ruxolitinib) were purchased from MedChem Express. Stattic was administered at 25 mg/kg by intraperitoneal injection once a day. Ruxolitinib was administered at 100 mg/kg by oral gavage two times a day. For the survival study, KPC or KPPC mice were started on FAKi treatment at 3.5 or 1.5 months old, respectively. Mice were considered to have reached the survival endpoint when the pancreatic tumour reached 1.8 cm in diameter or the mice lost >20% of body weight, whichever occurred earlier. For T cell depletion, CD4 and CD8- neutralising IgG antibodies (anti-mCD4 clone GK1.5, anti-mCD8 clone 2.43, BioXCell) were administered via intraperitoneal injection every 4–5 days, with the first injection containing 500 µg before tumour implantation and subsequent injections containing 250 µg. For TGF-β1 neutralisation, TGF-β1 antibody (clone 1D11.16.8, BioXCell) was given by intraperitoneal injection every other day for 14 days at 200 µg. In vitro, KP cells cultured alone or cocultured with pancreatic fibroblasts were treated with 4 µg/ mL TGF-β1 antibody (clone 1D11.16.8, BioXCell).
Cell line, constructs and siRNAs
KP2 cells were derived from a KPC tumour obtained in house. Kras-INK (KI) cells were obtained from Dr Douglas Hanahan’s laboratory. Panc-1 and Capan-1 cells were obtained from Dr Kian H Lim’s laboratory. Primary pancreatic fibroblasts were isolated from the normal pancreas from an 8-week old female C57BL/6 mice. Briefly, the normal pancreas was dissected by manual mincing using a scalpel, followed by enzymatic digestion with 3.0 mg/mL collagenase A (Roche) and DNase I (Sigma) dissolved in Dulbecco’s Modified Eagle’s Medium (DMEM); (Gibco) for 40 min at 37°C with constant stirring. Digestion mixtures were quenched by adding DMEM containing 10% fetal bovine serum (FBS) and filtered through 40 µm nylon strainers (Fisher Scientific). Single-cell suspensions were cultured in DMEM with 10% FBS for several passages to enrich mesenchyme-like fibroblasts. All experiments were performed with low-passage (passage 4–6) fibroblasts. Multiple batches of fibroblasts were used. All cell lines tested negative for mouse antibody production (MAP) and mycoplasma.
To generate tumour cell lines stably expressing short hairpin STAT3, KP2 cells were transduced with lentivirus particles carrying short hairpin RNA (shRNA) for 48 hours, following standard transduction protocols. Subsequently, cells were cultured in regular DMEM+F12 medium (Gibco) containing 7 µg/mL puromycin (Sigma-Aldrich) for 2 weeks. Surviving cells were tested for knockdown efficiency by immunoblotting.
The small interfering RNAs (siRNAs) targeting mouse STAT3, SMAD3 and human SMAD3 were purchased from Integrated DNA Technologies. Sequences are listed below: siSTAT3#1 5’-CACAUGGGCUAAAUUCUGCAAAGAA-3’; siSTAT3#2 5’-UUCUUUGCAGAAUUUAGCCCAUGUGAU-3’; siSMAD3 5’-CAAGUUGCAUCAAUGAAUUCACCTA-3’ and Human siSMAD3 5’-AGUCAGUUGCAUUCAUUAAAUCAAC-3’. shRNA constructs targeting mouse STAT3 were purchased from the Genome Center at Washington University. The targeting sequence is listed in online supplementary table 1.
Supplementary file 1
Synergism analysis
On day 0, 1000 KP2, Panc-1 and Canpan-1 cells were seeded in triplicates on 96-well plates precoated with collagen, and the cells were treated with eight fixed-ratio concentrations (all in µM) of VS-4718 to ruxolitinib (1:10, 0.5:5, 0.25:2.5, 0.125:1.25, 0.0625:0.625; 0.03125:0.3125; 0.015625:0.15625; 0.0078125:0.078125) and of VS-4718 to Stattic (1:0.5, 0.5:0.25, 0.25:0.125, 0.125:0.0625, 0.0625:0.03125, 0.03125:0.015625; 0.015625:0.0078125, 0.0078125:0.00390625). On day 3, old medium was replaced with fresh drug-containing medium. On day 5, cells were processed for the Alamar blue assay. Briefly, for each 100 µL cell culture medium, 25 µL 5× Alamar Blue reagent (Sigma-Aldrich) was added, and the culture was shaken at room temperature (RT) for about 10 min, then incubated at 37°C for 1–2 hours. Fluorescence was read at 540 nm and 590 nm using a molecular device plate reader. All wells were normalised with the dimethyl sulfoxide (DMSO)-treated group. Combination indices were calculated using Compusyn software (ComboSyn).
RNA isolation and PCR
Total RNA was extracted from tissue or cells, using an E.Z.N.A. Total RNA Kit (OMEGA). Complementary DNAs (cDNAs) were synthesised using qScript cDNA SuperMix (QuantaBio). Quantitative real-time PCR Taqman primer probe sets (Applied Biosystems) were used, and the relative gene expression was determined on an ABI 7900HT quantitative PCR machine (ABI Biosystems) using Taqman Gene Expression Master Mix (Applied Biosystems). The comparative threshold cycle method was used to calculate fold changes in gene expression, which were normalised to the expression of hypoxanthine phosphoribosyl transferase (HPRT), glyceraldehyde-3-phosphate dehydrogenase (GAPDH) and/or TATA-box binding protein (TBP) as reference genes.
Immunofluorescence
Five-micrometre-thick fresh cryosections were air-dried and fixed in 4% paraformaldehyde (PFA) (Ted Pella) for 15 min before being washed three times with PBS. Tissues were permeabilised by incubating the slides in 0.5% Triton X-100 in PBS for 15 min at RT and peroxidase-quenched by incubating in 1% hydrogen peroxide (Invitrogen) for 10 min at RT. After blocking for 1 hour at RT in blocking buffer (5% goat serum, 2.5% bovine serum albumin (BSA) in 1× PBS), slides were incubated overnight in a humidified chamber at 4°C with the antimouse antibodies listed in online supplementary table 2. Following PBST (1×PBS with 0.05% Tween-20) washes, slides were incubated with Alexa Fluor 594 or Alexa Fluor 647-conjugated goat antimouse/rabbit secondary antibody (Invitrogen). For immunofluorescence staining by Tyramide Signal Amplification (TSA), slides were additionally blocked using an Avidin/Biotin Blocking Kit (Vector Labs) after using blocking buffer. After primary incubation and washes, streptavidin-hypoxanthine phosphoribosyl transferase (HRP) conjugate (PerkinElmer) was added and incubated for 30 min at RT. After three washes in PBST, the slides were incubated with TSA-Biotin (PerkinElmer) for 8 min at RT. After PBST washes, slides were incubated with Streptavidin-Alexa Fluor 594 (Life Technologies) for 30 min. Slides were subsequently washed and mounted using Vectashield containing 2-(4-Amidinophenyl)-6-indolecarbamidine dihydrochloride (DAPI) (Vector Labs). For cell immunofluorescence staining, 5000 normal pancreatic fibroblasts were seeded into an 8-well chamber slide (Lab-Tek II; Thermo Fisher Scientific) and cultured overnight. Slides were then processed as described previously for tissue immunofluorescence staining.
RNA in situ hybridisation and immunohistochemistry
Fresh formalin fixed and paraffin- embedded (FFPE) slides of KPC tumours were subjected to automated RNA in situ hybridisation (ISH) using ACD RNAscope 2.5 LS reagents on the Leica Bond III RXm autostainer. TGF-β1 transcript (Mm- TGF-β1 probe Cat#407758) was visualised using 3,3'-Diaminobenzidine tetrahydrochloride hydrate (DAB) immunohistochemistry. Stained slides were scanned on the Zeiss Axio Scan Z1 Slide Scanner (Carl Zeiss Microscopy) at a magnification of 20× and analysed on Indica Labs HALO platform. Tissues were fixed in formalin and embedded in paraffin according to standard protocols. Immunostaining was performed on the Leica Bond III RXm autostainer using Leica Bond ancillary reagents and Refine Polymer DAB detection system. Primary antibodies are listed in online supplementary table 2. For TGF-β1 ISH plus aSMA IHC staining, ACD RNAscope 2.5 LS reagents without proteinase were used. Immunostaining was performed according to ISH and IHC protocols.
Microarray and data analysis
Microarray analysis was performed by the Genome Technology Access Center at Washington University, and the data generated has been deposited in NCBI’s Gene Expression Omnibus with accession number GSE75233. Gene Set Enrichment Analysis (GSEA) using KEGG_TGF_BETA_SIGNALING_PATHWAY databases was performed as previously described.13
Results
STAT3 signalling is hyperactivated in FAKi non-responsive tumours
In our previous studies, we showed that both genetic and pharmacological targeting of FAK suppresses tumour progression in pancreatic cancer models.11 We also observed that inhibition of FAK caused a period of stable disease followed by rapid progression, during which FAKi-treated tumours grew at the same rate as vehicle-treated tumours (see online supplementary figure 1A). Previously, reduced levels of phosphorylated STAT3 observed after short-term FAKi-treatment were considered a biomarker of FAK inhibition, and this paralleled decreased proliferation in tumour and stromal cells. To determine if loss of disease control during FAK inhibition was associated with altered STAT3 signalling, we analysed the expression levels of phosphorylated STAT3 (pSTAT3) in PDAC tissues from either KPC mice treated for 1.5 months (wherein tumour progression is controlled in most animals) or from end-stage animals being treated for 3–5 months (where FAK inhibition had eventually failed in most animals). The total levels of pSTAT3 were significantly decreased in mice treated for 1.5 months with FAKi, compared with those of vehicle-treated mice (figure 1A). In contrast, we observed a dramatic increase in pSTAT3 expression in end-stage FAKi-treated tumours (figure 1B), indicating that STAT3 signalling becomes hyperactivated after prolonged inhibition of FAK signalling. Although many KPC mice in the study showed prolonged stable disease following treatment with FAK inhibitors, a subset of mice exhibited rapid progression.11 To explore if STAT3 signalling was altered in those mice that showed limited de novo response to FAK inhibition, we analysed PDAC tissues for pSTAT3 levels of end-stage KPC mice stratified by duration of response to FAKi and found that there was a significant increase in the level of pSTAT3 in tumours with limited response to FAKi (figure 1C and online supplementary figure 1B). Moreover, the survival of FAKi-treated mice was inversely correlated with the overall pSTAT3 expression in the tumour, suggesting that pSTAT3 might be a predictive biomarker for FAK inhibition (see online supplementary figure 1C).

Elevated expression of pSTAT3 in end-stage FAKi-treated tumours. (A) Representative immunofluorescence staining for pSTAT3 in PDAC tissue from 1.5 month vehicle and FAKi-treated KPC mice. Scale bar, 100 µm. Right, the percentage of pSTAT3+ area for each treatment group (n=5–6 mice per group). Error bars represent mean±SEM. *P<0.05 by Student’s t-test. (B) Representative immunofluorescence staining for pSTAT3 in PDAC tissue from end-stage vehicle- and FAKi-treated KPC mice. Scale bar, 100 µm. Right, the percentage of pSTAT3+ area for each treatment group (n=8–11 mice per group). Error bars represent mean±SEM. *P<0.05 by Student’s t-test. (C) Representative whole-tissue and 10×inset of immunofluorescence staining for pSTAT3 in PDAC tissue from end-stage vehicle and FAKi-treated (responsive and non-responsive) KPC mice. Scale bar, 100 µm. Right, the percentage of pSTAT3+ area for each treatment group (n=5–8 mice per group). Error bars represent mean±SEM. *P<0.05 by Student’s t-test. (D) Representative immunofluorescence staining for pSTAT3 and tumour marker pan-keratin (Pan-K) in tumour from end-stage vehicle and FAKi-treated KPC mice. Scale bar, 50 µm. Right, the percentage of pSTAT3+ area in tumour from each treatment group (n=7 mice per group). Error bars represent mean ±SEM. *P<0.05 by Student’s t-test. FAKi, focal adhesion kinase inhibitor; PDAC, pancreatic ductal adenocarcinoma; pSTAT3, phosphorylated signal transducer and activator of transcription 3.
To explore which compartments in the TME express high levels of pSTAT3, we differentiated pSTAT3 levels in both tumour and stromal cells of non-responsive KPC tumours. We found that pSTAT3 was highly expressed in both tumour and stromal cells (figure 1D and online supplementary figure 1G). To confirm our findings from genetic mouse models of PDAC, we further analysed pSTAT3 in tumours from both KP and KI transplantable models.14 Consistent with the data in KPC mice, we found that there was a significant increase in the expression of the pSTAT3 protein in KI and KP2 tumours that outgrew FAK inhibition (see online supplementary figure 1D–F). Taken together, these data suggest that STAT3 signalling is activated, with a corresponding loss of disease control, during FAK inhibitor therapy.
Tumour cell-intrinsic STAT3 regulates the durability of the FAK inhibitor response
Base on the dramatic increase in pSTAT3 expression in end-stage FAKi-treated tumours, we hypothesised that intrinsic STAT3 expression in tumour cells might be critical in their response to FAK inhibitor. To test this, we knocked down STAT3 in in the KPC-derived PDAC cell line KP2 and found that although STAT3 depletion did not change cell proliferation on its own, loss of STAT3 did dramatically increased the sensitivity of cells to FAK inhibitor (figure 2A,B). In vivo, we also found that STAT3-deficient PDAC cells had prolonged responsiveness to FAKi and greater tumour repression compared with STAT3-proficient tumours (figure 2C,D). Concomitant with this increased susceptibility to FAKi treatment, proliferation as marked by Ki67 was markedly reduced in FAKi-treated STAT3-deficient tumours (figure 2E). To access the impact of STAT3 expression in pancreatic fibroblasts on FAK responsiveness, we cocultured KP cells with either control (siNC) or STAT3-depleted (siSTAT3) fibroblasts in the presence of FAKi. We found that loss of pSTAT3 in fibroblasts did not affect the inhibitory effects of FAKi on KP cells (see online supplementary figure 2A and 2B). Taken together, these data suggest that STAT3 in fibroblasts may not be the critical driver of FAK inhibitor resistance and support the conclusion that tumour cell-intrinsic STAT3 regulates the durability of the FAK inhibitor response.

Tumour-intrinsic STAT3 contributes to FAKi response. (A) Representative immunoblot for total STAT3 and β-actin (loading control) in KP cells stably expressing control shRNA (shLUC) or shSTAT3 constructs (shSTAT3 #1–5). Bottom, MTT proliferation assay using KP cells stably expressing shLUC or shSTAT3 constructs (shSTAT3 #1–2) treated with DMSO or 1 µM FAKi. Error bars represent mean±SEM. *P<0.05 by Student’s t-test. (B) Histogram showing the percentage of growth inhibition in KP cells stably expressing shLUC or shSTAT3 constructs (shSTAT3 #1–2) treated with DMSO or 1 µM FAKi. Error bars represent mean±SEM. *P<0.05 by Student’s t-test. (C) Syngeneic tumour growth of KP cells stably expressing shLUC or shSTAT3 in mice treated with vehicle or 50 mg/kg FAKi. All animal experiments included 8–9 mice per group unless otherwise specified. Error bars represent mean±SEM. *P<0.05; by one-way analysis of variance with Dunnett’s multiple-comparison test. (D) Histogram showing the percentage of tumour growth KP cells stably expressing shLUC or shSTAT3 in mice treated with vehicle or 50 mg/kg FAKi. Error bars represent mean±SEM. *P<0.05 by Student’s t-test. (E) Representative immunohistochemistry staining for pSTAT3 in PDAC tissues from C57BL/6 mice subcutaneously transplanted with 200 000 KP cells stably expressing shLUC or shSTAT3 constructs (shSTAT3 #1–2) and then treated with FAKi or vehicle. Scale bar, 100 µm. Right, the percentage of pSTAT3+ area for each treatment group (n=6–9 mice per group). Error bars represent mean±SEM. *P<0.05 by Student’s t-test. DMSO, dimethyl sulfoxide; FAKi, focal adhesion kinase inhibitor; MTT, 3-(4,5-dimethyl-2-thiazolyl)-2,5-diphenyl-2-H-tetrazolium bromide; PDAC, pancreatic ductal adenocarcinoma; shRNA, short hairpin RNA; shLUC, shRNA targeting luciferase; shSTAT3, short hairpin signal transducer and activator of transcription 3; STAT3, signal transducer and activator of transcription 3.
FAKi downregulates TGF-β/SMAD3 signalling via reducing fibroblasts and collagen
To determine if STAT3 signalling was directly upregulated by FAK inhibition, we stimulated KP (see online supplementary figure 3A) and KI cells (see online supplementary figure 3B) with FAKi and found that there was no change in pSTAT3 levels among different groups. Moreover, silencing of both FAK1 and PYK2 in KP cells did not modulate pSTAT3 expression, suggesting that activation of STAT3 signalling was not due to the loss of FAK1/PYK2 in tumour cells (see online supplementary figure 3C). Additionally, long-term selection for FAKi-resistant cell lines did not result in elevated pSTAT3 signalling (see online supplementary figure 3D). These data suggest that exposure to FAK inhibition alone does not alter STAT3 signalling, and that FAKi-induced changes in the TME might be at involved.
To further explore how FAK inhibition might change the TME, we profiled gene expression in PDAC tissue in vehicle or FAKi-treated mice. GSEA revealed enrichment of genes involved in the TGF-β signalling pathway in downregulated gene sets (figure 3A, online supplementary figure 3E and tables 3–6). To better understand the mechanisms leading to downregulation of the TGF-β pathway, we evaluated several TGF-β receptor ligands and pathway signalling component genes. Among TGF beta receptor ligands, the messenger RNA (mRNA) of TGF-β1 was expressed at 10–100-fold higher than that of TGF-β2 and 3, or BMP-5, 6 and 7 (see online supplementary figure 3G). Additionally, TGF-β1 was significantly downregulated in FAKi-treated tumours (figure 3B), but the majority of other signalling components were not (see online supplementary figure 3I). Consistent with these results, the protein levels of TGF-β1 were also suppressed by FAKi (figure 3C). To validate whether TGF-β1 was involved in repressing pSTAT3 hyperactivation, we treated KPPC mice with a TGF-β-neutralising antibody and observed that pSTAT3 was upregulated in PDAC tissue from TGF-β-neutralised mice (figure 3D and online supplementary figure 3F). These data suggest that prolonged FAK inhibition leads to downregulation of TGF-β in the TME and thus potentiates STAT3 signalling.
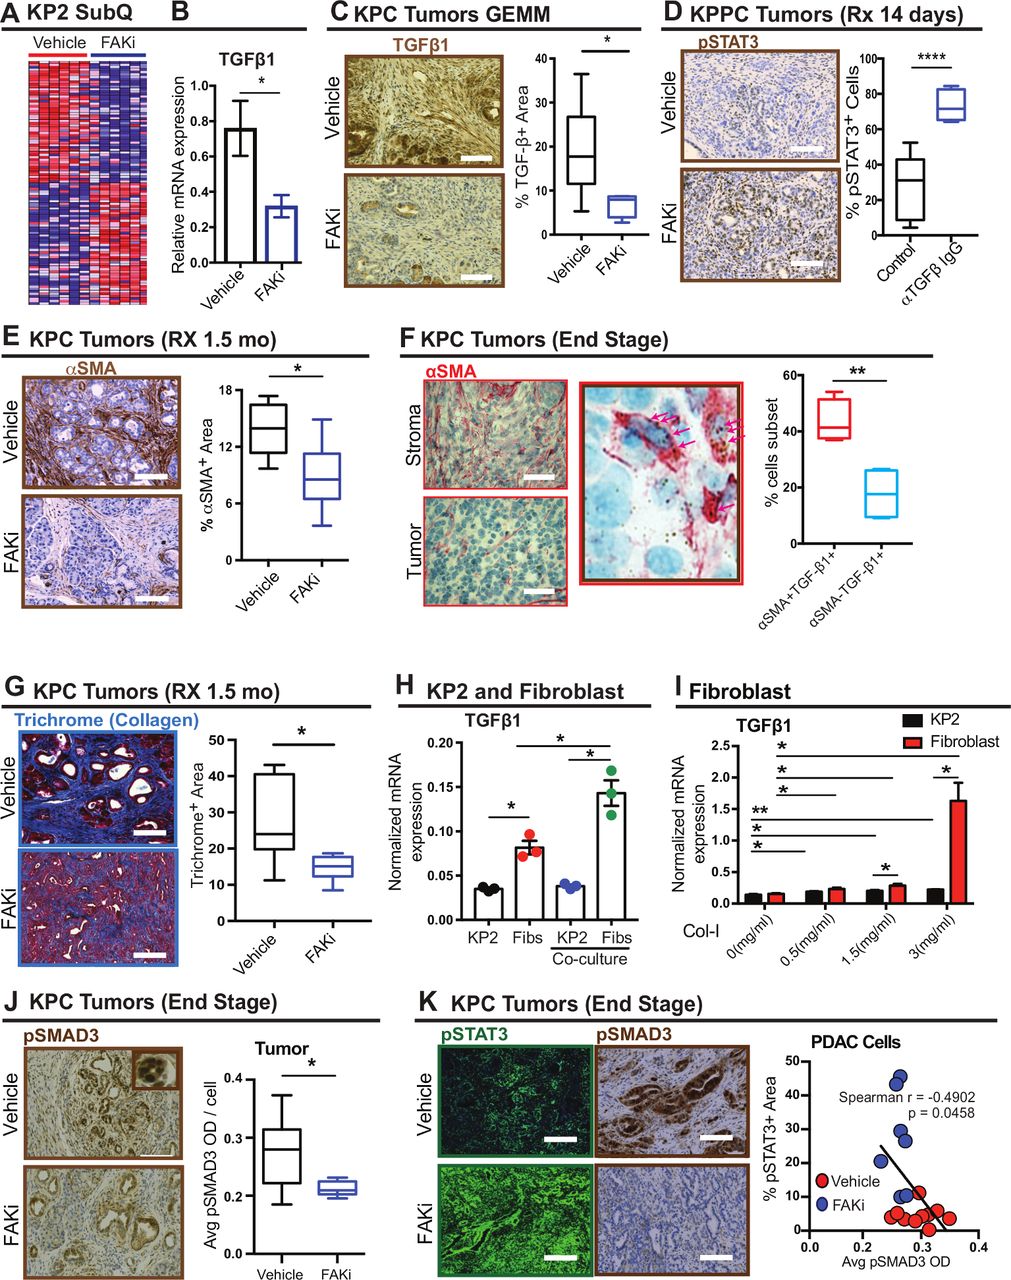
FAKi triggers pSTAT3 via inhibiting fibroblast- mediated TGF-β1/SMAD3 signaling. (A) Heatmap of top 50 downregulated and upregulated genes by FAK inhibition in KP transplantable tumours following treatment with vehicle or FAKi (n=six mice per group). (B) mRNA expression analysis of TGF-β1 from a gene array of KP2 transplantable tumours following treatment with vehicle or FAKi (n=six or seven mice per group). Error bars represent mean±SEM. *P<0.05 by Student’s t-test. (C) Representative immunohistochemistry staining for TGF-β1 in PDAC tissue from 1.5 month vehicle- and FAKi-treated KPC mice. Scale bar, 100 µm. Right, the percentage of TGF-β+ area for each treatment group (n=6–7 mice per group). Error bars represent mean±SEM. *P<0.05 by Student’s t-test. (D) Representative immunohistochemistry staining for pSTAT3 in PDAC from KPPC mice treated with vehicle and TGF-β neutralising antibody. Scale bar, 100 µm. Right, the percentage of pSTAT3+ cells for each treatment group (n=5–8 mice per group). Error bars represent mean±SEM. *P<0.05 by Student’s t-test. (E) Representative immunohistochemistry staining for αSMA in PDAC tissue from 1.5 month vehicle and FAKi-treated KPC mice. Scale bar, 100 µm. Right, the percentage of αSMA+ area for each treatment group (n=6–7 mice per group). Error bars represent mean±SEM. *P<0.05 by Student’s t-test. (F) Representative immunohistochemistry staining for αSMA combined with TGF-β1 RNA in situ hybridisation in PDAC tissue from end-stage KPC mice. Scale bar, 25 µm. Arrows indicate TGF-β1 mRNA ISH. Right, the percentage of αSMA+ TGF-β+ cells and αSMA- TGF-β+ cells (n=4). Error bars represent mean±SEM. *P<0.05 by Student’s t-test. (G) Representative immunohistochemistry staining for Trichrome in PDAC tissue from 1.5 month vehicle and FAKi-treated KPC mice. Scale bar, 100 µm. Right, the percentage of Trichrome+ area in tumour from each treatment group (n=7 mice per group). Error bars represent mean±SEM. *P<0.05 by Student’s t-test. (H) mRNA level of TGF-β1 in KP cells and fibroblasts cultured alone or cocultured with each other (n=3). Error bars represent mean±SEM. *P<0.05 by Student’s t-test. (I) mRNA level of TGF-β1 in fibroblasts and KP cells cultured on different density of collagen (n=3). Error bars represent mean±SEM. *P<0.05 by Student’s t-test. (J) Representative immunohistochemistry staining for pSMAD3 in tumour from end-stage vehicle and FAKi-treated KPC mice. Scale bar, 100 µm. Right, The mean pSMAD3+ area in tumour from end-stage vehicle and FAKi- treated KPC mice. Error bars represent mean±SEM. *P<0.05 by Student’s t-test. (K) Representative immunofluorescence staining for pSTAT3 and immunohistochemistry staining for pSMAD3 in PDAC tissue from end-stage vehicle and FAKi-treated KPC mice. Scale bar, 100 µm. Right, scatter plot showing Spearman’s correlation between the percentage of pSTAT3+ area and percentage of pSMAD3+ area in PDAC tissue from end-stage vehicle and FAKi- treated KPC mice. FAKI, focal adhesion kinase; FAKi, focal adhesion kinase inhibitor; ISH, in situ hybridisation; mRNA, messenger RNA; PDAC, pancreatic ductal adenocarcinoma; pSTAT3, phosphorylated signal transducer and activator of transcription 3; TGF-β1, transforming growth factor beta 1.
Because FAK inhibitor treatment leads to both stromal depletion and STAT3 activation, we hypothesised the two might be linked through TGF-β1. We first verified, in concordance with our published data, that FAK inhibition led to reduced collagen density and SMA+ fibroblast presence in the PDAC TME at time points corresponding to reduced TGF-β1 expression (figure 3E and G). Next, we evaluated the relative expression of TGF-β1 in PDAC cells and SMA +fibroblasts in PDAC tissue using RNA ISH and found that the TGF-β1 transcript was expressed at higher levels in SMA+ fibroblasts (figure 3F). Consistent with this result, in vitro studies demonstrated that the mRNA levels of TGF-β1 in pancreatic fibroblasts were higher than those in corresponding PDAC cells, and increased significantly when cocultured with PDAC cells (figure 3H). Additionally, we observed that collagen density, which is reduced in vivo by FAK inhibition (figure 3G), significantly increased TGF-β1 expression in fibroblasts compared with their PDAC cell counterparts (figure 3I). Notably, FAK inhibition did not alter TGF-β1 mRNA expression in either fibroblasts or PDAC cells (see online supplementary figure 3J). Taken together, these results suggest that prolonged FAK inhibition reduces TGF-β1 in the PDAC TME by reducing αSMA +fibroblast number and collagen density.
In conjunction with TGF-β1 loss and STAT3 activation, we also observed decreased pSMAD3 levels in PDAC cells, but not stromal cells, in end-stage FAKi-treated tumours (figure 3J and online supplementary figure 3H). Additionally, the expression levels of pSTAT3 were inversely correlated with the expression of pSMAD3 but not of pSMAD2 (figure 3K, online supplementary figure 4A-D), suggesting SMAD3 may be a critical mediator of STAT3 activation in PDAC cells.
High levels of pFAK1 and pSMAD3 predict unfavourable prognoses in patients with pancreatic cancer
Next, we investigated the preponderance and impact of FAK and SMAD3 pathway upregulation in human PDAC patients. The Cancer Genome Atlas database revealed that elevated expression of pFAK or pSMAD3 in human PDAC tumours independently defined a subset of patients with worse prognosis (figure 4A). To confirm these findings, we stained pancreatic cancer TMAs for pFAK or pSMAD3 by immunohistochemistry. Consistent with our findings in KPC mice, pSMAD3 is expressed in both the tumour and stroma, whereas pFAK is mainly upregulated in ductal tumour cells, and a statistically significant positive correlation was observed between pFAK and pSMAD3 (figure 4B, online supplemental figure 4E, 5A and B and B), indicating FAK and SMAD3 might be key mediators of clinical outcomes in pancreatic cancer patients.

pSTAT3 is suppressed by TGF-β1/SMAD3 pathway. (A) Kaplan-Meier survival curves for FAK and SMAD3 mRNA expression in the TCGA patient dataset for pancreatic adenocarcinoma (PAAD). (B) Representative immunohistochemistry staining for pFAK and pSMAD3 in human pancreatic cancer tissue microarray. Scale bar, 100 µm. Right, scatter plot showing Spearman’s correlation between the percentage of pFAK+ cells and percentage of pSMAD3+ cells in human pancreatic cancer tissue samples. (C) Representative western blot for pSTAT3, total STAT3, pSMAD3, total SMAD3 in KP cells treated with the denoted dosages of TGF-β1 for 1 hour. (D) Representative immunoblot for pSTAT3, total STAT3, pSMAD3, total SMAD3 and β-actin (loading control) in KI cells treated with 5 ng/mL TGF-β for 1 hour. (E) Representative immunoblot for pSTAT3, total STAT3, pSMAD3, total SMAD3 and β-actin (loading control) in Panc-1 cells treated with 5 ng/mL TGF-β for 1 hour. (F) Histogram showing the percentage of growth inhibition in KP cells. Cells were grown on 7.5 mg/mL basement membrane extract and treated with 5 ng/mL TGF-β1 in the presence or absence of 1 µM FAKi for 4 days. Error bars represent mean±SEM. *P<0.05 by Student’s t-test. (G) Representative immunoblot for pSTAT3, total STAT3, pSMAD3, total SMAD3 and β-actin (loading control) in KP cells transiently transfected with control siRNA (siNC) or siRNA targeting SMAD3 in the presence or absence of 5 ng/mL TGF-β for 1 hour. (H) Histogram showing the percentage of growth inhibition in KP cells. Cells were grown on 7.5 mg/mL basement membrane extract and transiently transfected with control siRNA (siNC) or siRNA targeting SMAD3. Then cells were treated with 5 ng/mL TGF-β1 in the presence or absence of 1 µM FAKi for 4 days. Error bars represent mean±SEM. *P<0.05 by Student’s t-test. (I) Representative immunoblot for pSTAT3, total STAT3, pSMAD3, total SMAD3 and β-actin (loading control) in KP cells cultured alone or cocultured with fibroblasts in the presence or absence of 4 µg/mL TGF-β neutralising antibody for 48 hours. (J) Representative immunoblot for pSTAT3, total STAT3, pSMAD3, total SMAD3 and β-actin (loading control) in KI cells cultured alone or cocultured with fibroblasts in the presence or absence of 4 µg/mL TGF-β neutralising antibody for 48 hours. FAK, focal adhesion kinase; FAKi, focal adhesion kinase inhibitor; mRNA, messenger RNA; pSTAT3, phosphorylated signal transducer and activator of transcription 3; siRNA, small interfering RNA; TGF-β1, transforming growth factor beta 1; TCGA, The Cancer Genome Atlas.
TGF-β1/SMAD3 signaling represses activation of STAT3 signalling
Next, we sought to test whether SMAD3 activation suppresses STAT3 signalling in pancreatic cancer cells. To accomplish this, we treated KP2 cells growing on collagen-I with TGF-β1. Intriguingly, TGF-β1 preferentially activated pSMAD3 and suppressed pSTAT3 in a time and dose-dependent manner (figure 4C and online supplementary figure 5C). This signalling regulation was further confirmed in KI (figure 4D), Panc-1 (figure 4E) and Capan-1 cells (see online supplementary figure 5D). To explore whether TGF-β1 inhibited pSTAT3 through SMAD3, we knocked down SMAD3 in KP2 and Panc-1 cells and observed that TGF-β1 no longer inhibited pSTAT3 expression (figure 4G and online supplementary figure 5G). Additionally, we observed that TGF-β1 increased the growth inhibition sensitivity of KP2 cells to FAK inhibitor in an SMAD3-dependent manner (figure 4F,H). These data suggest a critical role for the TGF-β/SMAD3 signalling in FAKi response through STAT3. We also observed that after 1 hour of TGF-β1 exposure, pJAK1 is downregulated in an SMAD3-dependent manner (see online supplementary figure 5G), suggesting direct signalling inhibition. Exploring this further, we found that when Ruxolinitib, a JAK1/2 inhibitor, was given to Panc-1 cells, TGF-β1 could not further inhibit pSTAT3 expression (see online supplementary figure 5H). As demonstrated in the online supplementary figure 5E and F, we concluded that the non-canonic TGF-β signalling pathway was not required in FAKi resistance. Based on our in vivo data, which implicate SMA +fibroblasts in the production of TGF-β1, we sought to determine whether fibroblast-secreted TGF-β1 regulated pSMAD3/pSTAT3 signalling in vitro. As seen in figure 4I,J, neutralising TGF-β in the media of tumour cells had no impact on either pSMAD3 or pSTAT3. In contrast, coculture with fibroblasts increased pSMAD3 and decreased pSTAT3 levels in both KP2 and KI cells, and TGF-β neutralisation abolished these effects. These data suggest that fibroblast- secreted TGF-β1 suppresses pSTAT3 signalling in PDAC cells and thus mediates FAKi sensitivity.
Pharmacological inhibition of JAK/STAT signalling improves response to FAK inhibition
Given the fact that genetic knockdown of STAT3 improves response to FAK inhibition, we sought to test the ability of pharmacological inhibition of STAT3 to improve FAK inhibitor efficacy both in vitro and in vivo. To target STAT3 signalling, we used ruxolitinib (JAK1/2 inhibitor) and Stattic (STAT3 inhibitor). We first treated human cell lines (Panc-1, Capan-1) or murine PDAC lines (KP2) with control, ruxolitinib or Stattic in the presence or absence of FAKi. We found that single-agent ruxolitinib or Stattic had little impact on cell proliferation, whereas FAKi significantly inhibited cell proliferation (see online supplementary figure 6A,B). By contrast, the combination of FAK inhibitor with ruxolitinib or Stattic suppressed cell proliferation synergistically in vitro (figures 5A–D and online supplementary figures 6C–D).

Synergism of FAK inhibitor and ruxolitinib/Stattic. (A–D) Median effect analysis showing the interaction between FAKi and ruxolitinib or Stattic in Panc-1 (A–B) or KP2 (C–D), analysed using Compusyn software. Data represent the combined mean±SEM of three independent experiments each performed in duplicate. Horizontal dotted lines indicate the boundaries for each interaction classification. FAK, focal adhesion kinase; FAKi, focal adhesion kinase inhibitor.
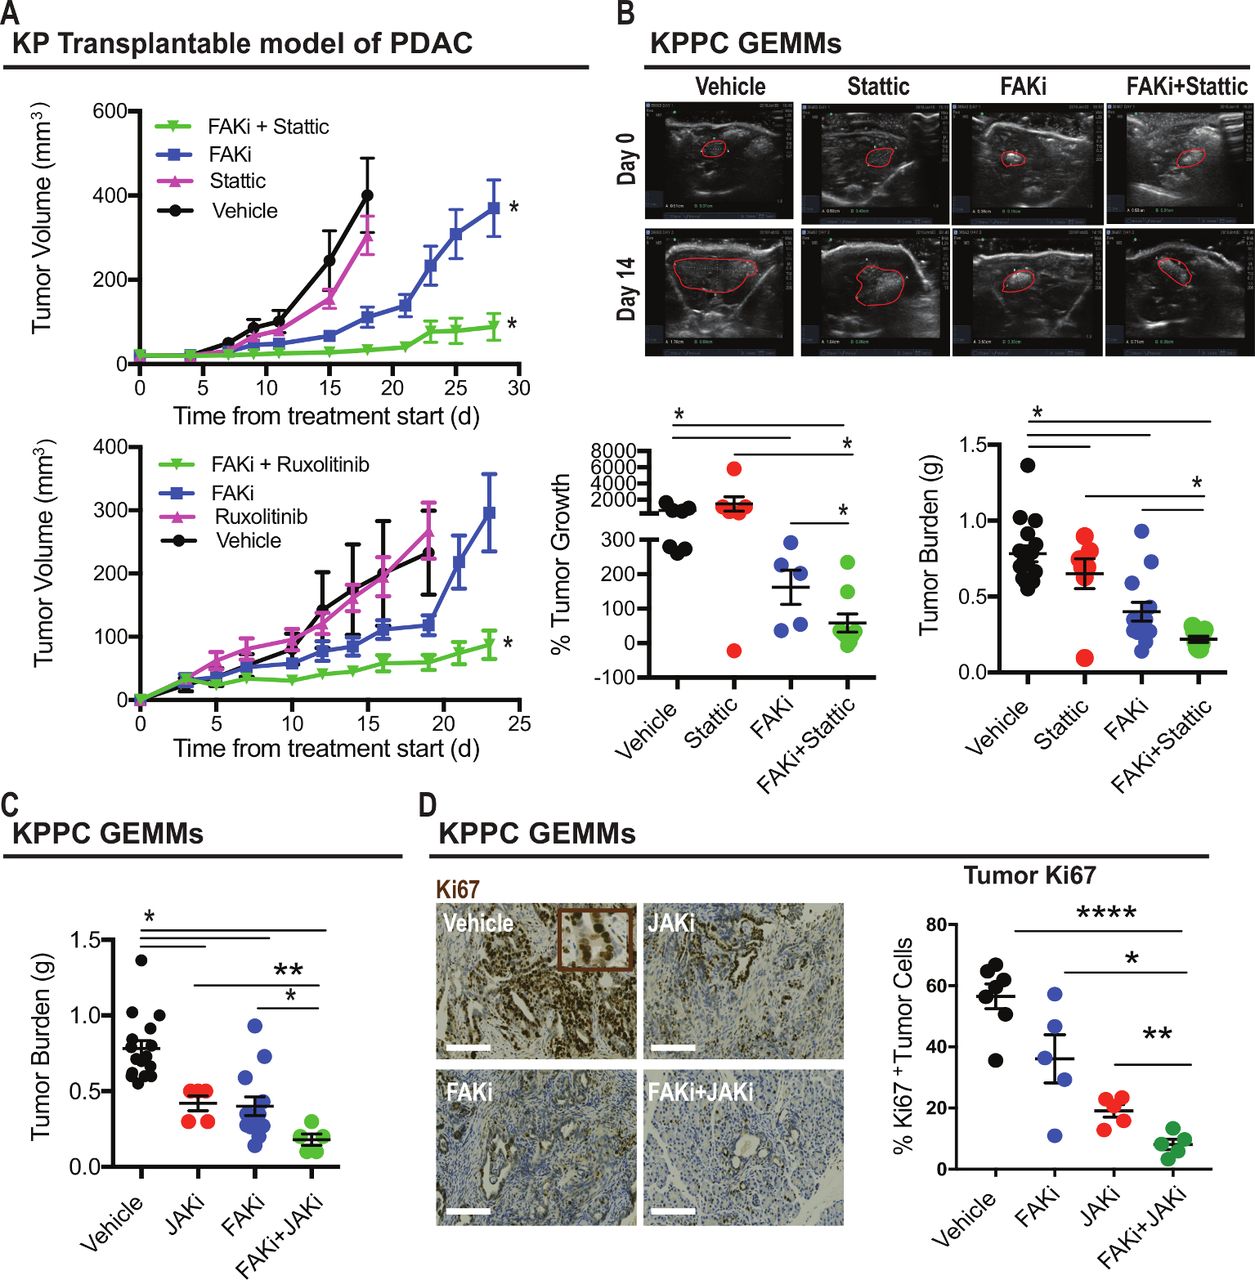
We next tested the ability of FAKi and either JAK or STAT3 inhibitors to restrain tumour growth in vivo using syngeneic transplantable tumours and the genetic KPPC PDAC model. We found that single-agent Stattic or ruxolitinib did not markedly alter tumour progression in either model, but the combination of these agents synergised to enhance the ability of FAKi to restrain tumour progression in both model systems (figure 6A-C). To better understand how the combination of FAKi and Stattic regulated cell fate in vivo, we evaluated cell proliferation and apoptosis in tumours from mice treated with vehicle, ruxolitinib, FAKi or the combination of ruxolitinib and FAKi. We found that ruxolitinib combined with FAKi dramatically suppressed cell proliferation when compared with FAKi alone (figure 6D). Neither FAKi nor the combination of FAKi and JAKi induced apoptotic cells (see online supplementary figure 7A). To investigate the impact of FAK plus JAK inhibition on the TME, we evaluated collagen density and T cell infiltration and found that in contrast to PDAC cell proliferation, there were no synergistic effects of adding JAK inhibitors to FAK blockade (see online supplementary figure 7B, C). Further, depletion of CD4+ or CD8+ T cells did not impact the efficiency of the combination (see online supplementary figure 7D). Taken together, these findings suggest that pharmacological inhibition of JAK/STAT3 signalling sustains PDAC responsiveness to FAK inhibitor via suppression of tumour cell proliferation.
Pharmacological inhibition of STAT3 improves tumour responsive to FAKi. (A) Tumour growth curve of KP tumour-bearing mice treated with vehicle, Stattic, FAKi or Stattic +FAKi (upper panel). Lower panel, tumour growth curve of KP tumour-bearing mice treated with vehicle, ruxolitinib, FAKi or ruxolitinib+FAKi. All graphs depict mean±SEM. *Indicates P<0.05 by one-way analysisi of variance with Tukey’s method for multiple comparisons. (B) Representative ultrasound images of tumours for KPPC mice treated with vehicle, Stattic, FAKi or FAKi+Stattic, with tumour outlined in red (upper panel). Lower panel, scatter dot plots showing the percentage of tumour outgrowth and tumour weight (in grams) for each treatment group (n=5–16 mice per group). Error bars represent mean±SEM. *P<0.05 by Student’s t-test. (C) Scatter dot plots showing tumour weight (in grams, right) for KPPC mice treated with vehicle, ruxolitinib, FAKi or FAKi+ruxolitinib (n=5–16 mice per group). All graphs depict mean±SEM. *Indicates P<0.05 by unpaired two-sided Student’s t-tests. (D) Representative immunohistochemistry staining for Ki67 in tumour from KPPC mice treated with vehicle, ruxolitinib, FAKi or FAKi+ruxolitinib. Scale bar, 100 µm. Scatter dot plots (right) showing the number of Ki67+ tumour cells for each treatment group (n=5–7 mice per group). Error bars represent mean±SEM. *P<0.05 by Student’s t-test. FAKi, focal adhesion kinase inhibitor; STAT3, signal transducer and activator of transcription 3 .
Discussion
In this study, we demonstrate that prolonged FAK inhibition leads to STAT3 hyperactivation and resistance to FAK-targeted therapy. Ironically, this resistance is incurred by the stromal-depleting activity of FAK inhibitors, which leads to loss of stromal TGF-β1-mediated antagonism of STAT3 activation. We find this is an intriguing concept, whereby a targeted agent causes alterations in stromal desmoplasia, leading to eventual therapeutic resistance. Nonetheless, in these studies, we found that this could be overcome by dual inhibition of FAK and JAK/STAT3 signalling to induce more durable suppression of PDAC progression.
FAK signalling has been heavily studied in the context of cancer cell migration, proliferation and survival,10 suggesting that FAK might be a potential therapeutic target. We recently found that FAK functions as a central driver of the fibrotic and immunosuppressive microenvironment that protects tumours from immune surveillance and drives resistance to immunotherapy.11 Although single-agent FAK inhibition caused dramatic survival extension in genetic mouse models of PDAC, we observed that some tumours progressed rapidly on FAK inhibition, indicating that these FAKi-treated tumours acquired resistance. Here, we have discovered that FAK inhibition results in activation of STAT3 signalling through downregulation of the TGF-β pathway. We have shown that TGF-β1 originates from the stroma, and we have demonstrated that FAK inhibition can reduce TGF-β1 expression at the mRNA level. Furthermore, knockdown of SMAD3 in tumour cells abolished the inhibitory effects of TGF-β1 on pSTAT3 expression levels. We also found that pSMAD3 is positively correlated with pFAK in human PDAC patients, suggesting that the TGF-β pathway might be a new target in PDAC. Interestingly, we found that SMAD2 was upregulated in tumour cells on FAK inhibition (see online supplementary figure 4C), suggesting that SMAD2 activation might induce STAT3 activation. Consistent with our findings, previous studies reported that phosphorylation status determines the opposing functions of SMAD2/SMAD3 as STAT3 cofactors in TH17 differentiation.15 The mechanism by which SMAD2 and SMAD3 might function in opposite ways during PDAC progression needs to be further explored. The interplay between TGF-β signalling and STAT3-dependent signalling exists in various physiological and pathophysiological contexts, such as tumour development,16 as well as murine embryonic stem cell self-renewal and differentiation.17 Further study is needed to better understand how this direct interplay between StAT3 and SMAD3 impacts these biological functions.
Drug resistance is a common issue when targeted therapy is deployed in both preclinical areas and in clinical settings.18 When advanced cancers are treated with targeted agents acting on an oncogenic driver, resistance emerges almost invariably, either through acquired resistance or intrinsic resistance.19 20 Acquired drug resistance is often the result of clonal selection of a pre-existing population of cancer cells that circumvents the targeted agent, often through an additional genetic alteration or bypass of cell signalling. Constitutive activation of STAT3 has frequently been observed in a variety of tumours, including melanoma, pancreatic cancer, lung cancer, colorectal cancer, breast cancer, brain cancer, prostate cancer, glioma, lymphoma and leukaemia.3 Increasing evidence has implicated STAT3 in resistance to conventional chemotherapy and immunotherapy.21 In the present study, we have uncovered a tumour-intrinsic escape mechanism in response to FAK inhibition. We provide new evidence that STAT3 activation in tumour cells is critical for driving the FAK inhibitor response.
STAT3 is largely believed to be a key oncogene, and intensive efforts have been devoted to developing STAT3 inhibitors. However, no inhibitor that directly targets STAT3 has yet been approved by the Food and Drug Administration for clinical use. As proof of concept, in this study, we used Stattic and ruxolitinib to target different levels of the STAT3 signalling cascade. Surprisingly, both Stattic and ruxolitinib showed a strong synergism with FAKi in vitro and in vivo. Stattic is a non-peptidic small molecule that selectively inhibits the STAT3 SH2 domain regardless of STAT3 activation state in vitro. Stattic selectively inhibits the activation, dimerisation and nuclear translocation of STAT3 and has been shown to increase the apoptosis of STAT3-addicted breast cancer cell lines.22 In our hands, Stattic has shown high potency and efficacy in cell lines and tumours in vivo. However, we have observed toxicity of Stattic in mice (body weight loss, data not shown). By contrast, mice tolerated either single-agent ruxolitinib or a combination of ruxolitinib and FAKi quite well. Our observations raise concerns about the use of Stattic in a clinical setting. There remains an unmet need to develop selective and safe STAT3 inhibitors.
Taken together, these findings provide evidence that feedback activation of STAT3 signalling in response to decreased stromal desmoplasia contributes to single-agent FAKi therapy resistance. Moreover, these data suggest there might be additional mechanisms by which stromal depleting agents can lead to unforeseen resistance to either targeted or cytotoxic agents, which warrant further exploration.
Acknowledgments
The authors would like to thank Dr James Fitzpatrick from the Washington University Center for Cellular Imaging (WUCCI). The authors would like to thank Dr Greg Williams from the Department of Surgery, Washington University School of Medicine for assistance with TMA analysis. SH is supported by a fellowship award from the National Cancer Institute (F99 CA223043).
References
Footnotes
HJ and XL contributed equally.
Contributors DGD, HJ and XL conceived and designed the project. HJ conducted transgenic and transplant mouse experiments and treatments. BLK aided with FAK inhibitor and STAT3 inhibitor treatments. HJ and BLK provided KPC and KPPC mice. HJ, XL and KBL performed histology, immunohistochemistry and immunofluorescence on murine and human samples and related analyses. HJ and XL performed RNA interference, MTT, three-dimensional collagen assays, immunoblotting and related analyses. SH and XL performed RNA in situ hybridisation and post-hoc analyses. BLK performed ultrasound detection and real-time PCR. XL, HJ and K-HL performed synergism experiments and analysis. RCF provided TMA samples. JAP provided FAK inhibitor VS-4718 and intellectual input on the project. HJ and XL wrote the manuscript, and DGD and SH revised it.
Funding This work was supported by funding awarded to DGD from the National Cancer Institute (P50 CA196510, R01 CA177670, R01 CA203890).
Competing interests None declared.
Ethics approval The protocol was approved by the Ethics Committee of Washington University School of Medicine.
Provenance and peer review Not commissioned; externally peer reviewed.
Patient consent for publication Not required.