Article Text

Abstract
Background and Aims: The gold standard treatment of chronic hepatitis C (CHC) is combined pegylated interferon and ribavirin. Considering side effects and treatment cost, prediction of treatment response before therapy is important. The aim of this study was to identify a liver gene signature to predict sustained virological response in patients with CHC.
Methods: Group A (training set) comprised 40 patients with CHC including 14 non-responders (NRs) and 26 sustained virological responders (SVRs). Group B (validation set) comprised 29 patients including 9 NRs and 20 SVRs. Eleven responder–relapsers were also included. A total of 58 genes associated with liver gene expression dysregulation during CHC were selected from the literature. Real-time quantitative RT-PCR assays were used to analyse the mRNA expression of these 58 selected genes in liver biopsy specimens taken from the patients before treatment.
Results: From the Group A data, three genes whose expression was significantly increased in NRs compared with SVRs were identified: IFI-6-16/G1P3, IFI27 and ISG15/G1P2. These three genes also showed significant differences in their expression profiles between NRs and SVRs in the independent sample (Group B). Supervised class prediction analysis identified a two-gene (IFI27 and CXCL9) signature, which accurately predicted treatment response in 79.3% (23/29) of patients from the validation set (Group B), with a predictive accuracy of 100% (9/9) and of 70% (14/20) in NRs and SVRs, respectively. The expression profiles of responder–relapsers did not differ significantly from those of NRs and SVRs, and 73% (8/11) of them were predicted as SVRs with the two-gene classifier.
Conclusion: NRs and SVRs have different liver gene expression profiles before treatment. The most notable changes occurred mainly in interferon-stimulated genes. Treatment response could be predicted with a two-gene signature (IFI27 and CXCL9).
Statistics from Altmetric.com
Chronic hepatitis C (CHC) is among the leading causes of chronic liver disease worldwide, with a prevalence of approximately 170 million people. The severity of disease varies from asymptomatic chronic infection to cirrhosis and hepatocellular carcinoma.1–3 The main treatment goal in CHC is the prevention of cirrhosis and hepatocellular carcinoma by eradicating the virus. Recently, advances have been made in treatment with the combination of pegylated interferon (PEG-IFN) and ribavirin.4–8 Despite this progress, treatment failure still occurs in about half of the patients. Furthermore, therapy results in several side effects. Premature withdrawal due to adverse events was required in 10–14% of participants in registration trials.5–8 Considering side effects and treatment cost, prediction of virological non-response before therapy with more reliable markers is mandatory.1 2
The recent development of effective tools for the large-scale analysis of gene expression has provided new insights into the involvement of gene networks and regular pathways in various disease processes.9 These methods include microarrays to analyse the expression of thousand of genes at a time, and real-time RT-PCR assays for more accurate and quantitative expression analysis of smaller numbers of candidate genes.10 Using large-scale real-time quantitative RT-PCR, we have shown that several altered molecular pathways are involved in CHC compared with normal liver11 and in the progression of fibrosis.10 Real-time RT-PCR is also more appropriate than microarrays for analysing weakly expressed genes such as genes encoding cytokines.
We hypothesised that non-responders (NRs) and sustained virological responders (SVRs) might have different liver gene expression patterns prior to treatment. The aim of our study was to predict treatment outcome using real-time PCR in patients with CHC before treatment. We selected 58 genes from the literature involved in various cellular and molecular mechanisms associated with liver gene expression during CHC.10–17 We then built prediction models using supervised class prediction algorithms for gene signature discovery. A two-gene subset (IFI27 and CXCL9) accurately predicted treatment response (79.3%) in the validation set. This signature might help predict response to PEG-IFN plus ribavirin therapy in CHC.
PATIENTS AND METHODS
Chronic hepatitis C patients
Percutaneous liver biopsy specimens were selected from a cohort of adult patients with CHC followed at Beaujon Hospital (Clichy, France). Pretreatment liver biopsies from patients who were subsequently treated and for whom treatment responses were known were used for the study. In each case, both immediately frozen liver tissue (stored at −80°C) and fixed paraffin-embedded tissue (for histology) were available. Participants gave their informed consent. The study conformed to the ethical guidelines of the 1975 Declaration of Helsinki.
Patients were included in this study if they met the following criteria.
An established diagnosis of CHC with detectable anti-hepatitis C virus (HCV) antibodies, and detectable serum HCV RNA with RT-PCR (HCV Amplicor 2.0; Roche Diagnostics, Mannheim, Germany).
Absence of other causes of chronic liver disease (undetectable hepatitis B surface antigen (HBs-Ag), no excessive alcohol consumption (<30 g/day), haemochromatosis, autoimmune hepatitis, Wilson disease, α-1 antitrypsin deficiency, primary sclerosing cholangitis or primary biliary cirrhosis).
Standard treatment regimen: all were naïve patients and received the same complete treatment of PEG-IFNα-2b (Viraferon-peg, 1.5 μg/kg/week; Schering Corp.) and ribavirin (dose adjusted to body weight: <65 kg, 800 mg/day; 65–85 kg, 1000 mg/day; >85 kg, 1200 mg/day). Duration of treatment was 24 weeks for genotypes 2 or 3, and 48 weeks for genotypes 1 or 4. NRs were treated for a full course of therapy.
Adequate follow-up: detection of serum HCV RNA by RT-PCR was performed at week 24, at the end, and 6 months after the end of treatment.
Patients were selected based on their treatment response. Sustained virological response was defined as undetectable HCV RNA 6 months after completion of treatment.1 2 Non-response was defined as detectable serum HCV RNA at the end of treatment.
We first built a gene signature on a training set with 40 patients with CHC including 14 NRs and 26 SVRs (Group A). We then validated the gene signature on an independent validation set of 29 patients including 9 NRs and 20 SVRs (Group B), to confirm that it would generalise to new data. Baseline characteristics of groups A and B are shown in tables 1 and 2.
A group of 11 responder–relapsers (RRs) was also included in the study. Relapse was defined as the reappearance of detectable serum HCV RNA after treatment cessation in patients with no detectable serum HCV RNA at the end of treatment. They have been included with the same criteria as previous CHC patients. In particular, they were all naïve patients and received the same complete treatment of PEG-IFNα-2b (Viraferon-peg, 1.5 μg/kg/week; Schering Corp.) and ribavirin (dose adjusted to body weight: <65 kg, 800 mg/day; 65–85 kg, 1000 mg/day; >85 kg, 1200 mg/day). Baseline characteristics of RR patients are shown in table 3.
Histologically normal controls
Percutaneous liver biopsy specimens were taken from eight adults with mildly elevated alanine aminotransferase (ALT) activity with no cause of liver disease (medication, alcohol, chronic viral hepatitis, autoimmune processes and metabolic disease). All these adults gave their informed consent for the study. All these eight liver tissue specimens were histologically normal (ie, absence of inflammation, fibrosis and pathological pattern).
Real-time RT-PCR
In previous studies using the same technological approach, we have shown that several altered molecular pathways are involved in hepatitis C compared with the normal liver11 and in the progression of liver fibrosis.10
Theoretical basis
The theoretical and practical aspects of real-time quantitative RT-PCR using the ABI Prism 7900 Sequence Detection System (Perkin-Elmer Applied Biosystems, Foster City, CA) have been described in detail elsewhere.10
The precise amount of total RNA added to each reaction mix (based on optical density) and its quality (ie, lack of extensive degradation) are both difficult to assess. We therefore also quantified transcripts of two endogenous RNA control genes involved in two cellular metabolic pathways, namely TBP (GenBank accession no. NM_003194), which encodes the TATA box-binding protein (a component of the DNA-binding protein complex TFIID), and RPLP0 (also known as 36B4; NM_001002), which encodes human acidic ribosomal phosphoprotein P0. Each sample was normalised on the basis of its TBP (or RPLPO) content. Results, expressed as n-fold differences in target gene expression relative to the TBP (or RPLPO) gene, and termed “Ntarget”, were determined as Ntarget = 2ΔCtsample, where the ΔCt value of the sample was determined by subtracting the average Ct value of the target gene from the average Ct value of the TBP (or RPLP0) gene.
The Ntarget values of the samples were subsequently normalised such that the median of the normal histological liver Ntarget values was 1.
Selection of genes
By studying the literature, we selected 58 genes involved in various cellular and molecular mechanisms associated with liver gene expression dysregulation during CHC in humans.10–17 We especially focused on genes whose expression was dysregulated during HCV infection compared with the normal histological liver (n = 37),11 genes involved in the progression of fibrosis in CHC (n = 7),10 those recently associated with treatment outcome (n = 18)12 and genes associated with the immune response to HCV.17 These genes mainly encode proteins involved in the immune response and interferon signalling pathways (table 4).
Primers and controls
Primers for TBP, RPLP0 and the 58 target genes were chosen with the assistance of the Oligo 5.0 computer program (National Biosciences, Plymouth, MN). We conducted searches in the dbEST and nr databases to confirm the total gene specificity of the nucleotide sequences chosen as primers, and the absence of single nucleotide polymorphisms. In particular, the primer pairs were selected to be unique in relation to the sequences of closely related family member genes or of the corresponding retropseudogenes. To avoid amplification of contaminating genomic DNA, one of the two primers was placed at the junction between two exons, if possible. In general, amplicons were between 70 and 120 nucleotides long. Gel electrophoresis was used to verify the specificity of PCR amplicons.
For each primer pair, no-template control (NTC) and no-reverse transcriptase control (RT negative) assays were performed and produced negligible signals (usually >40 in Ct value), suggesting that primer dimer formation and genomic DNA contamination effects were negligible. The RNA extraction, cDNA synthesis and PCR conditions are described elsewhere.10
Significance testing, clustering and supervised class prediction
Genes differentially expressed between SVRs and NRs were identified using the signal-to-noise (SNR) and Student t test statistics. p Values were estimated using 10 000 permutations of the sample status (SVR/NR), and genes with an adjusted p value <0.05 were considered to be significantly differentially expressed. p Values were corrected using the Benjamini and Hochberg false discovery rate (FDR) method18 to control false-positive results from multiple testing.
Unsupervised hierarchical clustering of expression data was performed using average linkage clustering with cosine distance as the similarity metric.
Supervised class prediction analysis was performed using k nearest neighbour (KNN) and weighted voting (WV) prediction algorithms to achieve optimal predictive accuracy for sample classification with a minimal set of predictors. Briefly, a KNN classifier19 is based on a distance function between pairs of observations and identifies the class of a testing sample by determining its k nearest neighbours in the training data set and by choosing the most common class of those k neighbours. Our KNN classifier used a distance-weighted voting scheme with cosine distance. The number of k neighbours was chosen by cross-validation (CV) on the training set, and the k yielding the smallest CV error rate was retained for use on the test set. The WV classifier makes a weighted linear combination of relevant marker genes obtained in the training set to provide a classification scheme for new samples. The selection of classifier input features was performed by computing the SNR statistic.
Prediction models were built using gene expression data from Group A samples, which served as a training set. Models containing increasing numbers of genes were evaluated by leave-one-out cross-validation (LOOCV) to identify the smallest predictive model yielding the most accurate class assignments. In LOOCV, one sample from the training set is excluded, and the rest of the training samples are used to build the classifier. Then the classifier is used to predict the class of the one that was left out, and this is repeated for each sample in the training set. The LOOCV estimate of classification accuracy is the overall number of correctly classified samples, divided by the number of samples in the training set. Thereafter, a validation analysis of the predictive classification model was performed using an independent test set (Group B), and the overall accuracy of class assignment for samples in the test set was reported.
All analyses were performed using GenePattern version 2.0 (http://www.broad.mit.edu/cancer/software/genepattern).20
RESULTS
Identifying significantly differentially expressed genes between SVRs and NRs
We first examined whether there were significant differences in individual gene expression between SVR and NR liver tissue specimens. Table 5 shows the results of the Student t tests when applied to Group A. Similar results were obtained with the SNR statistic, pointing to the same differentially expressed genes, although not ranked exactly in the same order. Genes correlated with SVR/NR status were identified by sorting all of the genes according to the t test statistic. Ten genes displayed a non-adjusted p value <0.05. Although this does not strictly assess significance, these non-adjusted p values are useful to identify genes that should be studied further. From the Group A data, we identified three genes whose expression differed significantly between SVRs and NRs (FDR <0.05): IFI-6-16 (previously named G1P3), IFI27 and ISG15 (previously named G1P2) (table 5). Note that ISG15 and IFI-6-16 were already identified as differentially expressed genes between SVRs and NRs (p<0.001) in an independent study.12
When the gene expression profiles of the 10 genes displaying a non-adjusted p value <0.05 in Group A were compared between NR and SVR patients from Group B, 6 out of 10 genes (IFI27, ISG15, IFI-6-16, OAS2, HERC5 and IFIT1) were found to be differentially expressed in this independent data set (FDR <0.05) (table 6). Among these six genes, five (IFI27, ISG15, IFI-6-16, OAS2 and IFIT1) were also identified as differentially expressed in a previous study.12 The three genes shown to be significant (FDR <0.05) in Group A (IFI-6-16, IFI27 and ISG15) also showed significant differences in their expression profiles between SVRs and NRs in Group B and displayed the highest level of significance.
Selection of the most useful gene subsets for gene expression-based classification
Exploratory data analysis using unsupervised hierarchical clustering was performed on both Group A and Group B using the whole set of genes (n = 58). No distinctive clusters were identified between the SVR and NR groups by this analysis. This was expected since most of the genes considered were not correlated with NR/SVR status. Hence, the SVR and NR patients could not be differentiated by unsupervised data analysis.
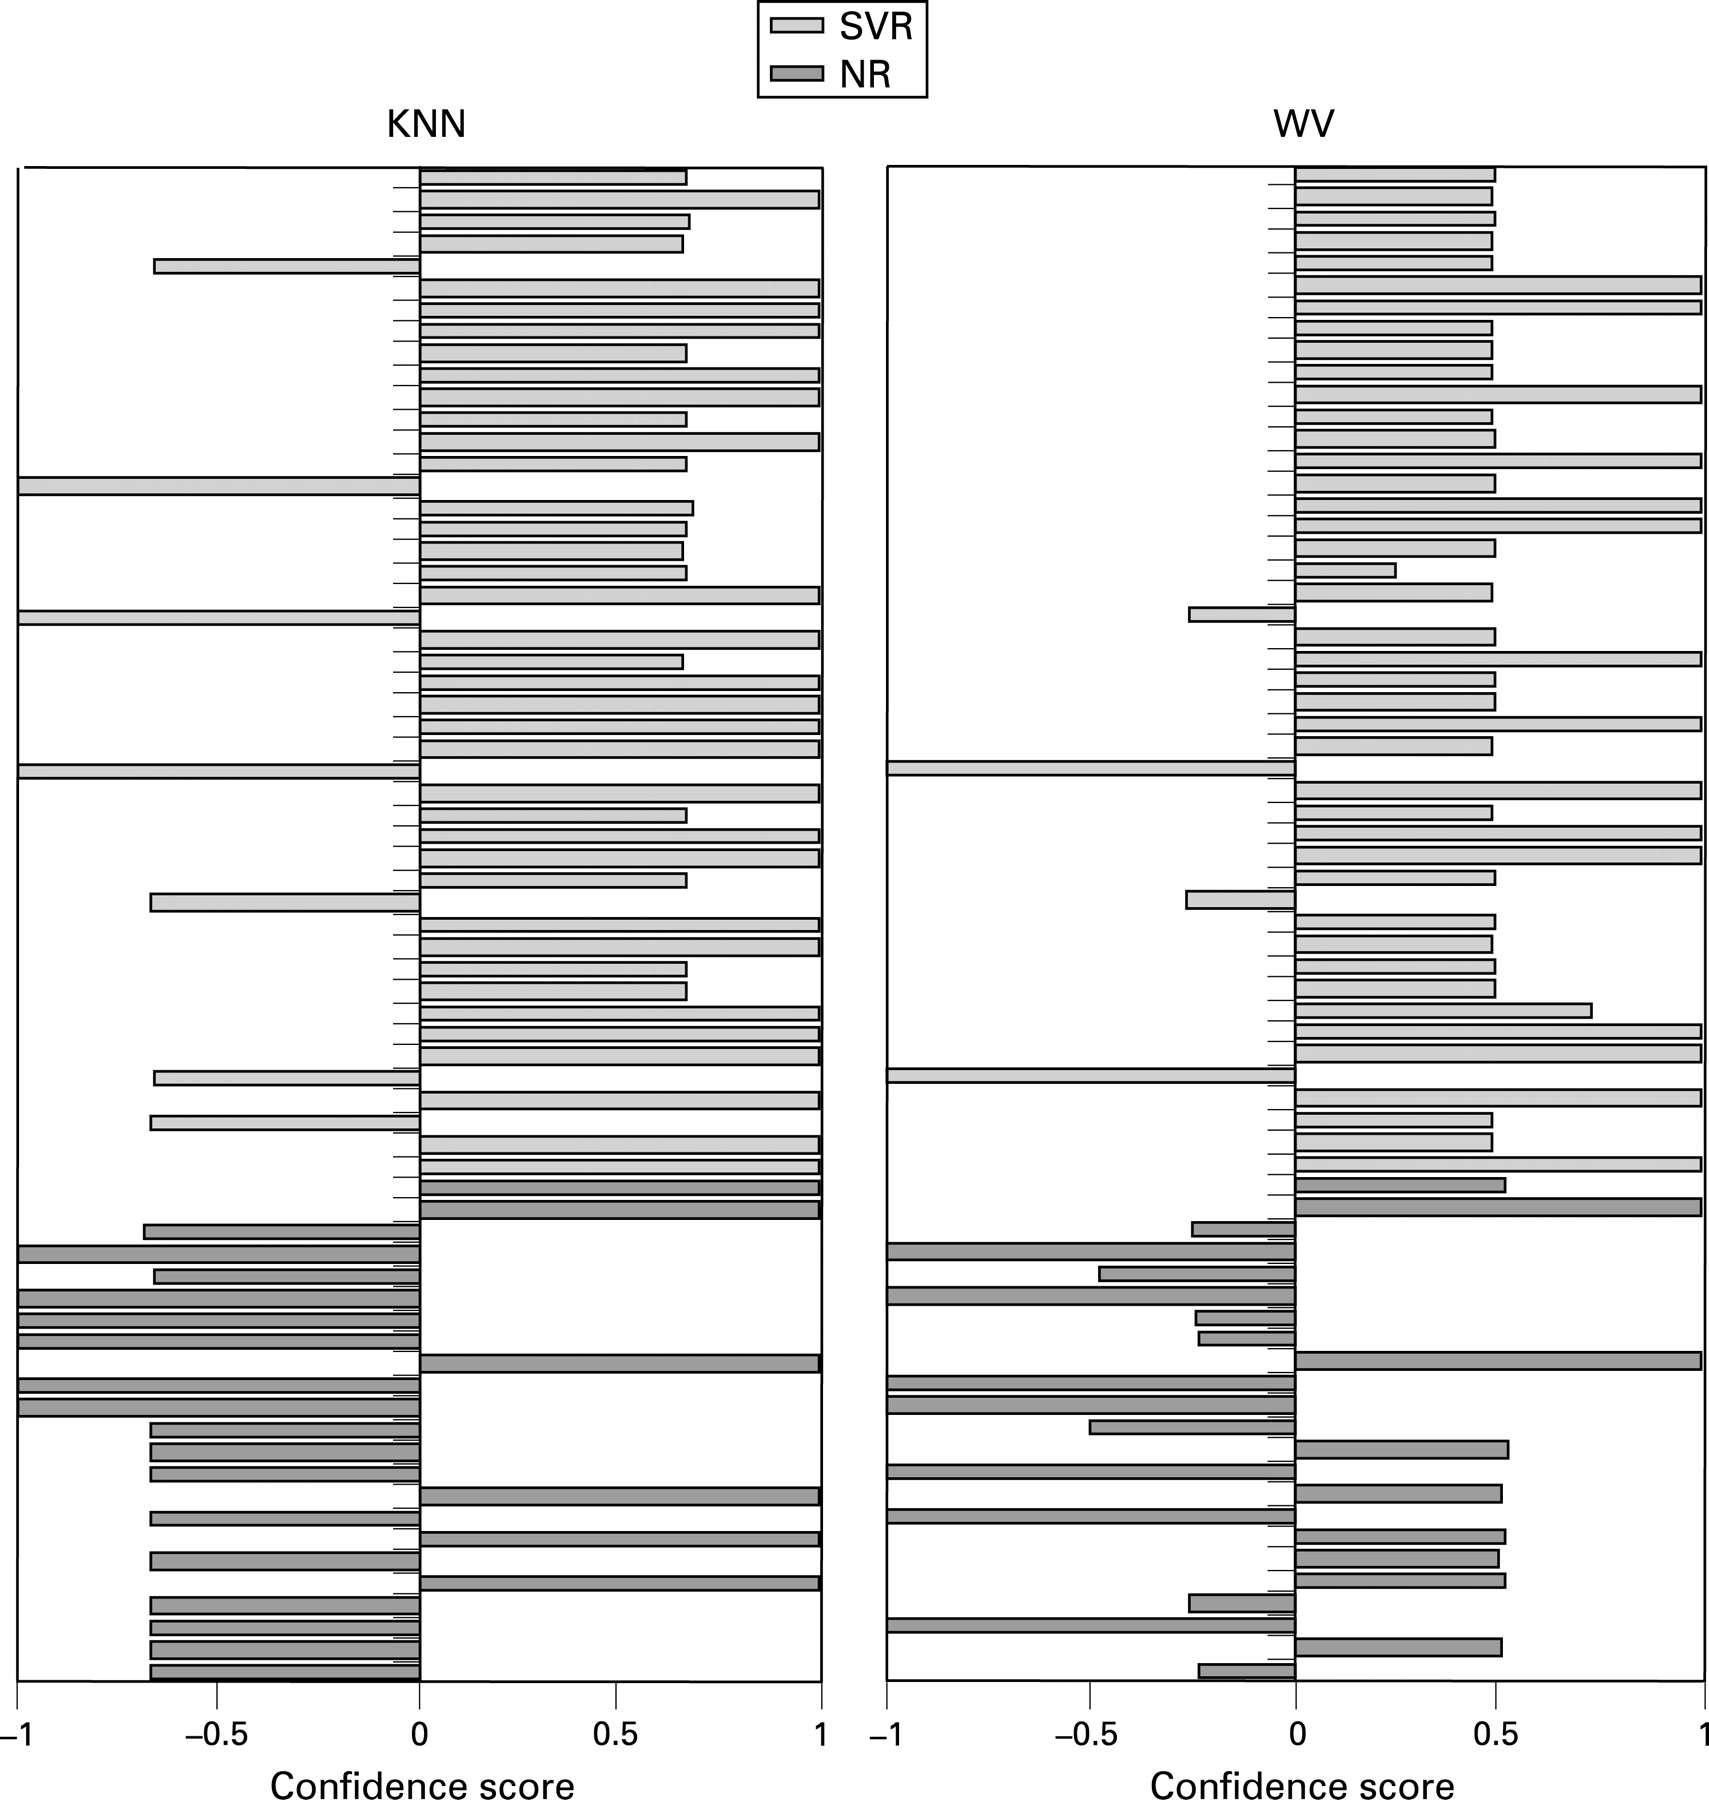
Prediction models were built using two supervised learning classifiers, KNN and WV, for gene signature discovery. Since good predictors do not necessarily have low type 1 errors when the null hypothesis of no association with the clinical outcome is tested for each of the investigated variables,21 the analysis was not restricted to the statistically significant discriminatory genes but was performed using the entire set of genes. The KNN algorithm identified a two-gene classifier (IFI27 and CXCL9, using k = 3) that gave the highest overall accuracy (77.5%) in distinguishing between SVR and NR gene expression profiles as evaluated by LOOCV of Group A, used as a training set (fig 2). Increasing the size of the classifier set did not increase accuracy. This two-gene signature correctly classified 23 of 26 SVR patients (88.5%) and 8 of 14 NR patients (57.1%) (table 7). It was validated on an independent test set (Group B) consisting of 29 patients, 23 of whom were correctly classified (79.3%): treatment response was correctly predicted for all NR patients (100%) and 14 of 20 SVR patients (70%). With the WV classifier, the highest classification accuracy (80.0%) was obtained using a three-gene subset (IFI27, CXCL9 and IFI-6-16) in Group A, and the results did not improve when additional genes were included (fig 2 and table 7). This predictive gene signature also showed good predictive accuracy in the independent test set (Group B), with 72.4% (21/29) of samples correctly assigned. Interestingly, among the genes selected as good predictors for gene expression-based classification of treatment outcomes, CXCL9 was not shown to be differentially expressed between SVR and NR patients (FDR >0.05).
When we tested the two-gene (IFI27 and CXCL9) and the three-gene (IFI27, CXCL9 and IFI-6-16) signatures in the group of patients composed only of individuals with genotype 1 infection, both signatures correctly classified 31 of 41 patients (75.6%). The predictive accuracy was of 71.4% (15/21) and 80% (16/20) in NR and SVR patients, respectively, with the two-gene signature, and it was of 66.7% (14/21) and 85% (17/20) in NR and SVR patients, respectively, with the three-gene signature.
The 69 patients from Group A and Group B were grouped into two distinct samples according to their liver fibrosis stage, and the performance of the proposed gene signatures was evaluated separately in the “mild/moderate fibrosis” group (F1–F2; n = 48) and in the “severe fibrosis/cirrhosis” group (F3–F4, n = 21)(Metavir).22 In our experience, the majority of patients with CHC have mild to moderate fibrosis (87%) in comparison with a minority having advanced fibrosis/cirrhosis (13%).23 Both signatures accurately predicted treatment outcome in either group (table 8).
It is interesting to note that when we built predictive models using the entire data set (69 samples from Group A and Group B pooled together), the best results were obtained using a two-gene (IFI27 and CXCL9, with k = 3) and a three-gene (IFI27, CXCL9 and ISG15) subset using the KNN and WV classifier, respectively. Both predictive models accurately predicted treatment response for 56 of 69 patients (81.2%) with CHC. However, while the prediction errors within the NR and SVR groups of patients were similar with the two-gene signature KNN classifier (26.1 and 15.2%, respectively), they were markedly unbalanced when training the WV algorithm with the three-gene subset (39.1 and 8.7%, respectively) (fig 2).
Results obtained with the 11 RR samples
Besides the 69 NR and SVR patients included in the two independent Groups A and B, we analysed 11 additional RR patients. Compared with the normal liver controls, the three genes IFI27, IFI-6-16 and CXCL9 were all upregulated in the 11 RR samples: their liver expression values were 29.1 (SD 25.0), 32.6 (29.4), and 49.4 (46.8), respectively, after normalisation such that the median of the normal histological liver values was 1. Neither unsupervised hierarchical clustering nor supervised class prediction analysis could distinguish the RR samples from NRs or SVRs: instead of being assigned to a new group, they all clustered with either the NR or the SVR samples. Once trained on the pooled data from Group A and Group B, the two-gene classifier (IFI27 and CXCL9) predicted 8 out of 11 RRs (73%) as SVRs, and 10 out of 11 RRs (91%) were predicted as SVRs with the three-gene classifier (IFI27, CXCL9 and IFI-6-16). The sole RR sample classified as NR with the three-gene signature was included in the three RR samples classified as NRs with the two-gene signature.
DISCUSSION
In this study, we used large-scale real-time quantitative RT-PCR to predict treatment outcome in patients with CHC receiving PEG-IFN plus ribavirin. We examined the expression level of 58 genes known to be involved in various cellular and molecular mechanisms associated with response to treatment. All patients were well defined; all were naïve patients and received the same complete treatment of PEG-IFNα-2b with ribavirin.
Real-time quantitative RT-PCR is a promising alternative to microarrays for gene profiling. In particular, real-time RT-PCR is far more precise, reproducible and quantitative than microarrays. Using this approach, we have shown that several altered molecular pathways are involved in the progression of fibrosis in CHC.10 Real-time RT-PCR is also more useful for analysing weakly expressed genes such as cytokines in the present study.
The best classification results were obtained using a two-gene (IFI27 and CXCL9) and a three-gene (IFI27, CXCL9 and IFI-6-16) subset when performing KNN and WV analyses, respectively (fig 1). The identified two-gene and three-gene signatures accurately predicted treatment response for 79.3 and 72.4% of patients from the validation set, respectively (table 7).

As patients with genotype 1 infection are less likely to respond to antiviral therapy, we verified that the selected gene signatures still perform well in this subgroup of patients and observed that 75.6% (31/41) of the genotype 1 patients were correctly classified. The signatures also performed well whatever the degree of fibrosis: they predicted treatment outcome with a high classification accuracy in both the “mild/moderate fibrosis” (F1 and F2; n = 48) and the “severe fibrosis/cirrhosis” (F3 and F4, n = 21) groups of patients (table 8). Note that the IFI-6-16 (G1P3) liver gene expression has been shown to be increased in patients with moderate fibrosis (F2) compared with those with mild fibrosis (F1).10 This gene, in combination with others, also appears in the present report to enable the prediction of treatment response.
In a large randomised study, the proportion of patients with a sustained virological response was 54% among 511 CHC patients treated with PEG-IFNα-2b (1.5 μg/kg/week) plus ribavirin, and the proportion of patients with response–relapse was found to be low (<18%).5 In the present study, the RR patients could not be distinguished from SVR and NR patients on the basis of their liver gene expression profiles, and most of them clustered with the SVR patients. Once trained on the pooled data from Group A and Group B, the two-gene classifier (IFI27 and CXCL9) predicted 8 out of 11 RRs (73%) as SVRs, and 10 out of 11 RRs (91%) were predicted as SVRs with the three-gene classifier (IFI27, CXCL9 and IFI-6-16). Interestingly, in a previous study which evaluated the efficacy of IFN-PEGα-2b plus ribavirin in the retreatment of 154 unselected patients with CHC who previously failed to respond or relapsed after a standard combination therapy, relapsers achieved higher response rates than non-responders (58.5% vs 13%).24
Since a significant number of patients will fail to respond to treatment and will develop significant side effects, it is of major interest, both for patient care and economically, to predict non-response as early as possible, ideally before treatment. For this purpose, the best signature to predict non-response is the two-gene (IFI27, CXCL9) subset, which correctly classified 100% of NR patients in the validation set, using the KNN classifier. This two-gene signature also displayed the highest overall predictive accuracy in the validation set (79.3%). Both IFI27 and CXCL9 genes belong to the IFN-stimulated genes family.
Many of the genes that were found to be differentially expressed between SVRs and NRs in both the training and the validation set (IFI-6-16, IFI27, ISG15, OAS2 and IFIT1) belong to IFN-inducible genes. Interestingly, all these genes were upregulated in both SVR and NR samples compared with normal liver. It was proposed that IFN-inducible genes are expressed during CHC via direct activation of IRF3, NFKB1 or JUN through IFN-dependent signalling events in host cells.14 Interestingly, the three genes included in the identified signatures (IFI27, CXCL9 and IFI-6-16) were found to be strongly upregulated in CHC (with mild disease) in comparison with normal liver.11 IFI27 and IFI-6-16 are IFNα/β-inducible genes with unknown function.25 CXCL9 is an IFNγ-inducible gene.
In a recent study, 18 genes were found to be differentially expressed in the liver between 15 NRs and 16 SVRs.12 Interestingly, five of these genes (IFI27, ISG15, IFI-6-16, OAS2 and IFIT1) were also identified in our study as being differentially expressed between NRs and SVRs. Using a number of independent classifier analyses, the authors12 identified an eight-gene subset that predicted treatment response for 30 of the 31 patients; and another analysis from the same data using different methods found that the best prediction results were obtained using a 24-gene signature,26 which correctly classified 28 of 31 patients. The predictive models identified in the present study involved a smaller number of genes which could be used as useful predictors. Moreover, the predictive accuracy of the signatures identified in our study was assessed using an independent validation set, and not only by performing a supervised LOOCV analysis on a single data set.
In another study, liver tissue samples prior to treatment by IFN or IFN/ribavirin were analysed by microarray.27 In the IFN treatment group, the differentially expressed genes were mainly IFN-, lipid metabolism-, complement- and oxidoreductase-related genes. For the IFN/ribavirin combination treatment, a different set of genes was identified including cyclophilin A and multidrug resistance protein. Surprisingly the discriminatory family genes that were identified were different in the two groups receiving either IFN or IFN/ribavirin.
Finally, another study analysing gene expression patterns in peripheral blood mononuclear cells during IFN therapy confirmed upregulation of genes thought to be IFN-stimulated genes as well as genes involved in antigen processing and presentation.28
These three studies have some limitations. First, only a few patients were analysed without a validation set. Secondly, patients were heterogenous according to treatment (IFN monotherapy, PEG-IFN, ribavirin, etc.). Thirdly, compliance with treatment was not assessed, and NR groups included patients without a complete course of treatment. Moreover, the diversity of microarray platforms used and the variability of microarray data emphasise the need for quality assurance. High quality RNA samples are essential, and must be rigorously assessed. Careful measures must be taken throughout RNA extraction to prevent the RNA from degrading. Furthermore, improved analytical procedures and the use of large numbers of patients are needed for validation.29
Many of the genes found to be upregulated between NRs and SVRs encode molecules secreted in the serum (cytokines, IFN pathway, IFI27 and ISG15) and provide a logical functional approach for the development of serum markers to predict treatment response. For instance, one study examined the levels of chemokines (CXCL9, CXCL10 and CXCL11) that bind to CXC chemokine receptor 3 (CXCR3) to determine whether these chemokines might play a role in the failure of the immune system to clear HCV infection.30 The baseline level of CXCL10 (before treatment) was highest in patients who did not respond to therapy. These results suggest that plasma concentrations of immunoreactive CXCL10 may predict non-responsiveness to antiviral therapy. Another recent study revealed that pretreatment IP-10 levels might help to predict sustained virological response in patients with HCV genotype 1 infection.31
In conclusion, our study demonstrated that NR and SVR patients have different gene expression profiles prior to treatment. The most notable changes in gene expression were mainly observed in the IFN-stimulated genes. We used two independent groups of patients (training set and validation set) and we could predict treatment response with a two-gene signature (IFI27 and CXCL9). The majority of RR patients clustered with SVR patients. Interestingly, the basal liver levels of expression of IFN-stimulated genes were higher in NRs in comparison with SVRs. In NRs, the failure to respond to exogenous PEG-IFN could indicate a blunted response to IFN. This raises the possibility that, in NRs, the IFN-stimulated genes are already maximally induced. The genes included in the signature encode molecules secreted in the serum and provide a logical functional approach for the development of serum markers to predict response to treatment.
REFERENCES
Footnotes
Funding: This study was supported by the French National Agency for Aids and Viral Hepatitis (ANRS). TA was supported by the French Association for the Study of the Liver (AFEF). AS was supported by the French Fondation pour la Recherche Médicale.
Funding: None.