Article Text

Abstract
Objective An epidemic of acute hepatitis C virus (HCV) infection in HIV-positive men-who-have-sex-with-men (MSM) is emerging in Europe, Australia and the USA. The aim of this study was to characterise the natural history of primary HCV in this setting and to assess host and viral factors which predict spontaneous clearance.
Methods This prospective longitudinal cohort study was carried out in 112 HIV-positive patients who were followed in a single centre (the St Mary's Acute HCV Cohort). Plasma and peripheral blood mononuclear cells (PBMCs) were obtained at monthly intervals for 3 months and at 3-monthly intervals thereafter for a median of 45 months (IQR=29–69 months). The primary end point was spontaneous clearance of HCV. Cox regression was used to assess the impact of clinical and virological variables on outcome, including liver function, CD4 count, rate of HCV RNA decline, T cell response and clonal sequence evolution within the HCV E2 envelope gene.
Results 15% of patients cleared HCV spontaneously, while 85% progressed towards chronicity. The latter group included a significant proportion of ‘fluctuating’ progressors (37.5%), in whom a fall followed by a rise (>1 log10) in viraemia was observed. This was associated with superinfection with new HCV strains and partially effective T cell responses. Spontaneous clearance was strongly associated with a 2.2 log10 viral load drop within 100 days of infection (HR=1.78; p<0.0001), elevated bilirubin (≥40 μmol/l; HR=5.04; p=0.006), elevated alanine aminotransferase (ALT; ≥1000 IU/ml; HR=2.62; p=0.048) and baseline CD4 count ≥650×106/l (HR=2.66; p=0.045), and only occurred in patients with genotype 1 infection. Evolution to spontaneous clearance occurred in patients with low viral diversity in the presence of an early multispecific T cell response.
Conclusions Spontaneous clearance of acute HCV in HIV-positive men can be predicted by a rapid decline in viral load, high CD4 count, elevated bilirubin and ALT, and is associated with low viral diversity and strong T cell responses.
- HIV
- HCV
- E2 HVR-1
- T cell
- viral dynamics
- acute hepatitis
- hepatitis C
- HIV/AIDS
- T lymphocytes
This is an open-access article distributed under the terms of the Creative Commons Attribution Non-commercial License, which permits use, distribution, and reproduction in any medium, provided the original work is properly cited, the use is non commercial and is otherwise in compliance with the license. See: http://creativecommons.org/licenses/by-nc/2.0/ and http://creativecommons.org/licenses/by-nc/2.0/legalcode.
Statistics from Altmetric.com
Significance of this study
What is already known about this subject?
Acute HCV is an emerging epidemic in HIV-positive MSM in Europe, Australia and the USA.
Clinical measures such as elevated bilirubin and symptomatic disease have been associated with spontaneous clearance (SC) in small cohorts of patients.
Small studies in HIV-negative individuals indicate that SC may be predicted by viral diversification and host T cell function.
What are the new findings?
Three patterns of infection occur in HIV-infected patients with acute HCV infection: SC, fluctuating viraemia (FV) and plateau viraemia (PV).
SC may be predicted by a 2.2 log10 viral load (VL) drop within 100 days of infection. FV patients have a slower rate of VL decline than SC patients, even if a negative VL is achieved.
A low rate of viral diversification associated with an early multispecific T cell response is predictive of SC in HIV-positive MSM.
HCV superinfection (resulting in multiple HCV strain infections) is common in HIV-positive MSM.
How might it impact on clinical practice in the foreseeable future?
Currently available treatment for HCV (pegylated interferon α and ribavirin) is toxic and expensive.
Early identification of individuals likely to progress to chronic infection using sequential viral load measurements is useful in decisions regarding the necessity and timing of treatment.
Measures of viral diversity and T cell function are also predictive of outcome and may be useful in the future for identifying patients at high risk of progressing to chronicity.
Once infected with HCV, HIV-positive MSM are at risk of superinfection with new HCV strains. Patients should be encouraged to use condoms with sexual partners (even if already HIV and HCV infected) and to use clean needles and injection equipment if they use intravenous or intramuscular drugs.
Twenty-one years after the discovery of the hepatitis C virus (HCV) genome,1 the asymptomatic nature of early infection has meant that its natural history has only been partially described. Exposure to the virus is usually unnoticed by patients until they develop cirrhosis of the liver or hepatocellular carcinoma following many years of silent infection. Thus, while large cohorts of patients with chronic infection have been extensively described, insights into early host–virus dynamics have been less well characterised. Follow-up of point-source outbreaks—for example, nosocomial infection in hospitals and rhesus-negative women who received contaminated immunoglobulin during pregnancy—have provided valuable insights into transmission risks and the likelihood of spontaneous clearance.2 3 One large multicentre community-based study of patients mainly infected by iatrogenic exposure or intravenous drug use revealed that viral clearance usually occurs within 3 months.4 This was recently observed in another longitudinal study of intravenous drug users in whom female sex was also associated with spontaneous clearance.5
Very little is known about early HCV in HIV-infected individuals, in whom HCV is emerging as a major concern, with liver disease now a major cause of mortality in patients with access to highly active antiretroviral therapy.6 Globally, 4–5 million people are infected with both viruses, due to shared routes of transmission.7 An emerging epidemic of acute HCV infection in HIV-positive men in urban centres in Europe,8 9 Australia10 and the USA11 has provided a rare opportunity to study the progression of early disease prospectively in a large number of individuals. Patients are identified early in infection, despite lack of symptoms, due to the detection of abnormal liver function tests at routine clinic follow-up.
The majority of patients infected acutely with HCV progress to chronic infection (55–90%). A number of mechanisms may be responsible for the persistence of virus in these individuals. The virus has an extremely rapid generation time—producing on average, a trillion viral particles every day. Furthermore, the viral genome is copied imperfectly due to the lack of proofreading function of the viral RNA polymerase.12 The result is the production of a swarm of related, but genetically different viral sequences that circulate at any given time; the quasispecies. The ability of the host immune system to recognise and eliminate each variant strain is highly likely to influence the final outcome. In a small, well-characterised cohort (n=12) of HIV-negative individuals, it has been shown that those who progress to chronicity have higher viral diversity than those who clear the virus spontaneously.13 Evolution of the hypervariable region-1 (HVR-1) of the viral envelope-2 (E2) protein, which contains both B and T cell epitopes, is associated with progressive disease, while a narrowed quasispecies repertoire occurs in patients who subsequently spontaneously clear infection. Spontaneous clearance (SC) of virus in HIV-negative individuals is accompanied by the emergence of strong multispecific CD8+ and CD4+ cell responses targeting a broad range of viral epitopes.14–17 Less is known about the natural history of early HCV infection in HIV-positive individuals despite the fact that dual infection is commonplace due to shared routes of transmission.
In this study, a cohort of 112 prospectively followed HIV-positive patients infected with acute HCV was used to characterise clinical patterns of infection and identify parameters predictive of SC, based on host factors such as CD4 count, liver function and sequential viral load (VL) sampling. Longitudinal genetic sequence analysis and T cell function determination was carried out in 50 patients (10 clearers and 40 progressors) at multiple time points. We hypothesised that rapid diversification of virus would be expected in patients who progress to chronicity, while SC of disease would be predicted by limited quasispecies diversity accompanied by strong T cell responses.
Materials and methods
Patient cohort
Informed consent in writing was obtained from each patient, the study protocol conformed to the ethical guidelines of the 1975 Declaration of Helsinki and ethical approval was granted by the Riverside Research Ethics Committee.
A cohort of 112 patients with HIV and acute HCV (102 with chronic HIV/acute HCV and 10 with acute HIV/acute HCV co-infection) were prospectively recruited from 2005 to 2009 in a single centre (the St Mary's Acute Hepatitis C Cohort). Plasma and peripheral blood mononuclear cell (PBMC) samples were obtained prospectively at monthly intervals for 3 months and at 3-monthly intervals thereafter for a median of 3 years. Stored frozen samples (HIV VL samples obtained every 3 months between 1994 and 2009) were also tested retrospectively by HCV reverse transcription–PCR (RT–PCR) in order to date the length of HCV infection. The date of infection was calculated as the midpoint between the last negative PCR or antibody test and first positive HCV PCR.
Patients were offered 48 weeks of treatment with pegylated interferon α and weight-based ribavirin (800–1200 mg) 12 weeks following HCV diagnosis unless this was contraindicated or SC occurred.
Case definition and end points
Acute HCV diagnosis was defined by a positive HCV RNA RT–PCR test within 6 months of a preceding negative RT–PCR or antibody test.
The primary end point of the study was SC of HCV, defined as two successive negative RT–PCR tests (<12 IU/ml) 3 months apart.
Sustained virological response (SVR) was defined as HCV RNA negativity (<12 IU/ml) 24 weeks after the end of 48 weeks of treatment with pegylated interferon α and ribavirin.
VL dynamics, liver function, viral diversity following clonal analysis and T cell responses were also assessed at multiple time points. VL observations were censored at the time of treatment.
Amplification of E2 HVR-1 and NS5B
Viral RNA was extracted using the QIAamp Viral RNA kit (Qiagen, Crawley, UK). Amplification of a 220 bp region including the E2 HVR-1 and a 376 bp region from NS5B was carried out by nested RT–PCR using a combination of genotype-specific primers18 19 and a One-Step RT-PCR kit (Qiagen). The HVR-1 is the most heterogeneous section of the HCV genome and can therefore be used to determine intragenotype differences in HCV strains.20 Purified PCR products were cloned into TOPO-4 vector (Invitrogen, Paisley, UK) and. following bacterial transformation, 20 colonies per plate were selected and used for plasmid DNA preparation and sequencing.
Sequence analyses
Sequences were aligned using Clustal W. Phylogenetic trees were constructed with MEGA 4.0 using the Neighbor–Joining method and Kimura two-parameter distance for all substitutions, and the inferred phylogenies were tested with 1000 bootstrap replications. Genetic diversity was calculated using the Hamming distance, which is defined as the number of amino acid differences between two sequences using the formula (1−s)×100, where s is the fraction of shared sites in two aligned nucleotide sequences. Genetic distance was calculated as the mean percentage difference between all samples at any time point.
Unique strains were defined as those originating from a distinct branch on the phylogenetic tree with a bootstrap value of >70 and a >10% genetic distance when compared with other strains derived from the same patient. Superinfection was defined as evidence of unique strains not present at baseline sampling, but evident at a later time point. Mean intrastrain corrected genetic distance and Hamming distances were calculated for all patients.
Non-synonymous substitutions per non-synonymous site divided by synonymous substitutions per synonymous site (dN/dS) ratios were calculated using MEGA 4.0. dN/dS values >1 were considered as evidence of positive selection.
Genetic sequence data
All viral sequences have been submitted to EMBL (accession numbers: HQ616913-HQ619203).
ELISpot assays
PBMCs were separated from whole blood by density gradient centrifugation and stored in liquid nitrogen. Thawed PBMCs were added to 96-well plates coated with mouse antihuman interferon γ (IFNγ) antibody. Peptides were added and the cells were incubated overnight. These were then washed off and mouse antihuman-IFNγ monoclonal antibody and alkaline phosphatase-conjugated antibiotin monoclonal antibody were added followed by incubation with 5-bromo-4-chloro-indolylphosphate-nitroblue-tetrazolium. Spot-forming units (SFUs) were counted on an ELISpot reader. Further details are given in Appendix 1 available online.
Error rates
In order to exclude contamination error as the mechanism for superinfection events, multiple time points were assessed and amplification of NS5B was carried out at different time points. In order to distinguish superinfection from co-infection with varying dominance of virus, PCR amplification was carried out using strain-specific primers. Further methodology details, including measures taken to prevent error, are available in Appendix 2 online.
Statistical analyses
As appropriate, Cox regression survival analysis, Kaplan–Meier survival plots, Mann–Whitney, χ2 and Fisher exact tests were used to analyse the significance of observations using the statistical computer package STATA 10.0. VL observations were right-censored at the time of treatment or end of follow-up. HRs were calculated with 95% CIs. p Values of ≤0.05 were considered to be statistically significant.
Results
Cohort characteristics
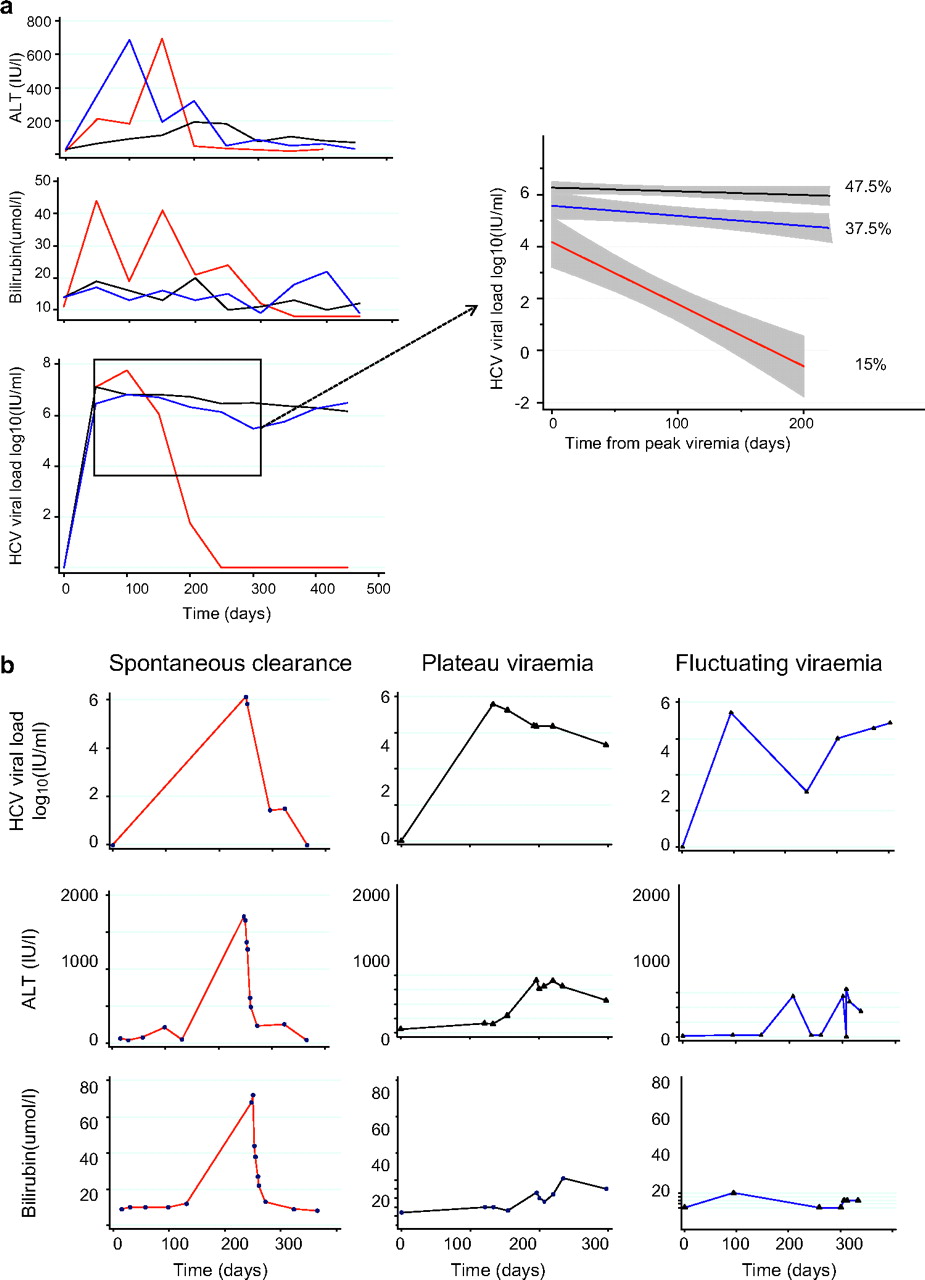
A total of 112 patients were recruited to the study and followed-up for a median of 45 months (IQR=29–69 months; figure 1). Sequential VL measurements revealed three patterns of infection (figure 2); progression to chronicity with an initial peak viraemia and chronic plateau viraemia (PV) phase (47.5%), fluctuating viraemia (FV) defined as a fall followed by a rise in VL of >1 log10 IU/ml (37.5%); and SC (15%). Demographic and clinical parameters are shown in table 1.

Patient cohort diagnosis, treatment and follow-up. A total of 112 HIV-positive patients with acute hepatitis C virus (HCV) were recruited to the the St Mary's Acute HCV Cohort study of whom 17 spontaneously cleared HCV. Treatment with pegylated interferon α (IFNα) and ribavirin was given for 48 weeks to 62 patients and withheld or delayed in a further 26. The sustained virological response rate was 66%. Ab, antibody; LFTs, liver function tests; RT-PCR, reverse transcription–PCR.

Clinical measures and outcome in (A) the whole cohort and (B) representative individual patients. Longitudinal hepatitis C virus (HCV) viral load measurements taken prior to treatment revealed three patterns of infection: spontaneous clearance (SC; 15%, red) and two patterns of progression (85%); peak and plateau (PV; 47.5%, black) or fluctuating viraemia (FV; 37.5%, blue) defined as a viral load peak followed by a decline (>1 log10) and subsequent rise in viraemia (>1 log10). Viral loads (VLs) obtained from spontaneous clearers (red), plateau progressors (black) and fluctuating progressors (blue) groups were pooled and plotted using a linear fit model from the time of peak viraemia to 300 days (insert). VL data were right-censored at the time of treatment for HCV. Grey shading indicates 95% CIs.
Clinical measures and outcome (spontaneous clearance vs progression)
Sequential bilirubin and alanine aminotransferase (ALT) measurements and outcome
Early infection in progressors (PV and FV groups) and spontaneous clearers (SC) was associated with a rise in ALT and bilirubin. The peak SC bilirubin and ALT levels were significantly higher than in the progressor groups (table 1; figure 2).
Viral dynamics and outcome
SC was associated with an initial increase followed by a rapid fall in VL (2.2 log10 drop within 100 days and 3.46 log10 drop within 200 days; table 2) leading to clearance at a median of 108 days (95% CI 38 to 170 days). Thirteen FV patients became transiently PCR negative, but took on average 154 days to reach negativity (95% CI=113, 323 days; p=0.04). Of the 35 patients who achieved a 2.2 log10 drop in VL, 17 (49%) spontaneously cleared infection and 18 (51%) did not. Those who spontaneously cleared infection took a median of 45 versus 120 days to achieve a 2.2 log10 drop in VL (p=0.01).
Median viral load (VL) drop in untreated spontaneous clearers and progressors
Genetic sequence and phylogenetic analyses
Phylogenetic analysis of majority quasispecies compared with reference sequences revealed several monophyletic clusters of infection within genotype 1a (77%), 4d (15%), 3a (7%) and 1b (4%), indicating several introductions of the virus into the MSM population (Appendix 3 online). Six per cent were infected with two genotypes and 2% had three genotypes (1a, 3a and 4d). SC occurred only in patients with genotype 1a infection, and this was significantly associated with outcome (p=0.04).
In order to determine which phylogenetic factors predicted SC, Hamming distance (diversity), number of quasispecies and dN/dS ratios were calculated in 50 patients (40 progressors and 10 clearers) at multiple (median=3) time points (table 3).
Viral sequence analyses and predictors of spontaneous clearance
Initially, genetic diversity was noted to vary considerably over time in all groups (Appendix 4 online) but did not correlate with VL. In order to investigate if this variation was the result of superinfection events, Neighbor–Joining phylogenetic analyses of all longitudinally acquired E2 HVR-1 sequences (n=2291) were next carried out, revealing three groups of patients (figure 3); those who spontaneously cleared infection (n=10; 20%), those who progressed to chronicity with increasing quasispecies diversity but no evidence of superinfection (n=20; 40%); and those who progressed to chronicity with evidence of superinfection events (n=20; 40%; figure 5). A number of supplementary analyses were carried out to confirm these results (Appendix 2 online).
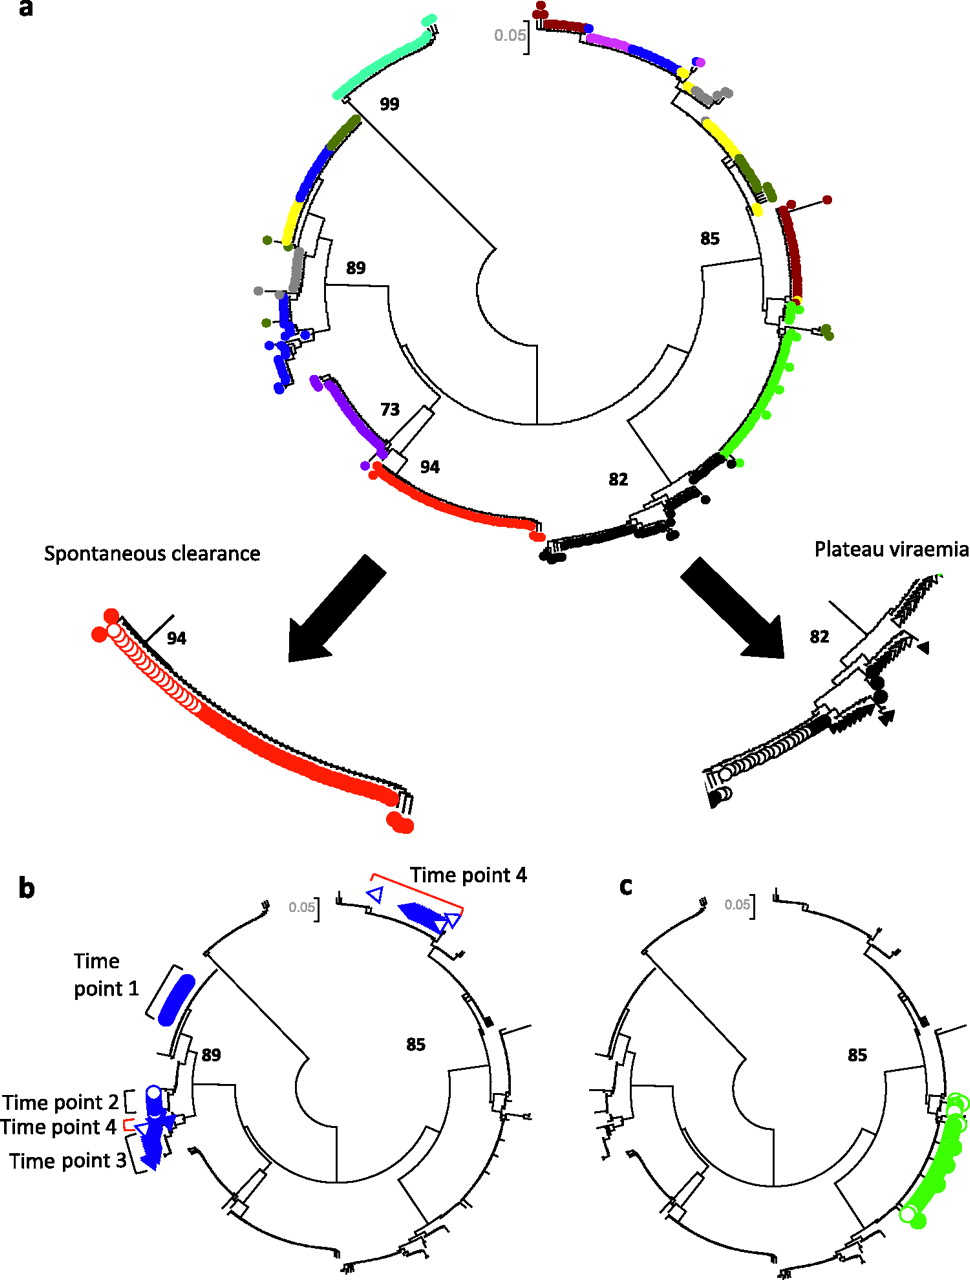
Patterns of acute HCV based on phylogenetic analysis in subjects 1–10. (A) Spontaneous clearance and plateau progression, (B) fluctuating viraemia associated with superinfection and (C) reactivation. A circular neighbour-joined phylogenetic tree analysis (Kimura 2-parameter model) of 305 HVR-1 sequences derived from subjects 1–10 at 2–4 time points is shown in order to illustrate patterns observed in different patient groups. Similar trees were created for 50 patients. Clones derived from each patient are given a different colour and those from two representative patients are shown in further detail (filled circles represent time point 1, clear circles time point 2, filled triangles time point 3 and clear triangles time point 4). (A) A gradual increase in genetic diversity can be seen in the progressor patient (black), while clones derived from the spontaneous clearer (red) reveal a narrower repertoire. Bootstrap values greater than 70% are shown. (B) A patient with evidence of superinfection is highlighted. Sequences from time point 4 (clear triangles, red brackets) consist of a dominant superinfecting strain (one clone related to the previous lineage is also present). This patient had a fluctuating viral load, with a negative HCV PCR (limit of detection=12 IU/ml) between time points 3 and 4. (C) A case of HCV reactivation is shown. The patient had a sustained virological response (PCR negative 6 months post-treatment) following 48 weeks of IFNα and ribavirin. One year later, he developed a rapid decrease in CD4 count (nadir 106x106/l) and was hospitalised with Pneumocystis jeroveci pneumonia. During this time, his ALT became elevated and HCV RNA was once again detected in his blood. He denied any risk factors for reacquisition of HCV. Branches derived from patient HVR-1 sequences (n=56) are coloured in filled green (baseline sample) and open green (3 years later). These samples derive from the same lineage.
Mean intrastrain calculations of genetic diversity and dN/dS ratios were used for patients found to have multiple strains of infection. Following this correction, diversity and dN/dS ratios increased gradually with time in progressors, but decreased in clearers (table 3, figure 4).

T cell responses and genetic variation within the E2 hypervariable region-1 (HVR-1) over time. Cumulative genetic variation (corrected Hamming distance and dN/dS ratio (non-synonymous substitutions per non-synonymous site divided by synonymous substitutions per synonymous site)) and T cell responses (interferon γ (IFNγ) spot-forming units (SFU)/106 cells) were assessed in each group of patients at two time points (sample 1, range 28–189 days; and sample 2, range 115–246 days from the last negative PCR test).
T cell responses
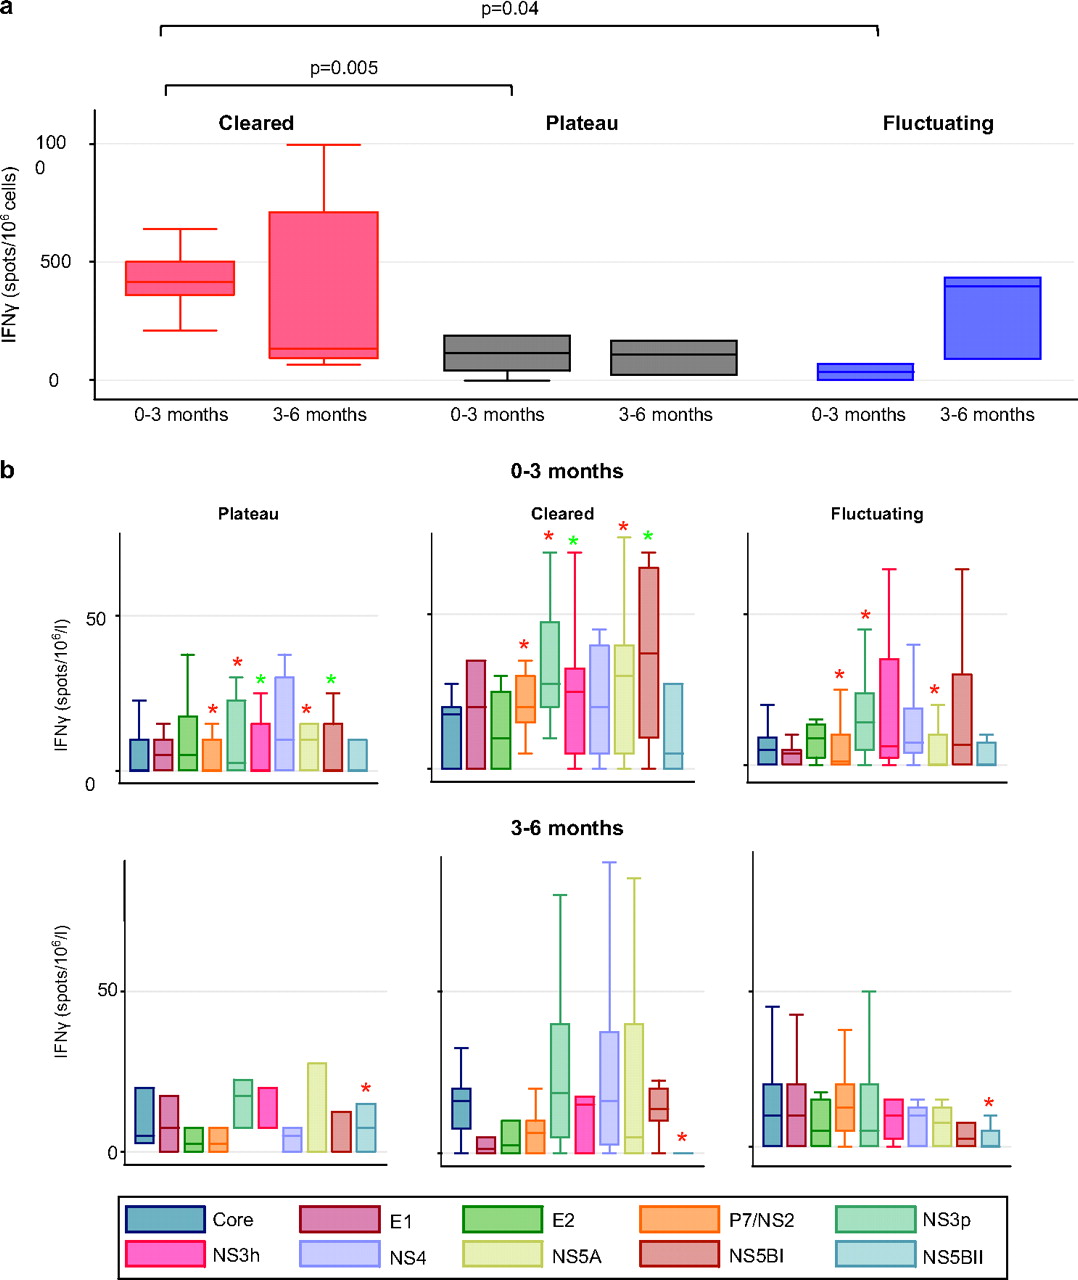
IFNγ production in response to pooled peptides spanning the entire viral genome were measured by ELISpot at two time points in 40 patients with genotype 1a infection. Total responses at baseline were significantly higher in SC versus PV (415 versus 115 SFU/million cells; p=0.005) and FV (415 versus 50 SFU/million cells; p=0.04) patients while responses were not significantly different by 3–6 months. In FV patients, transient viral control was associated with strong T cell responses. while viral relapse was often associated with loss of T cell response (Appendix 5 online).
SC was associated with significantly increased early responses to NS2/p7, NS3 protease and NS5A when compared with both PV and FV progressors (figure 5). SC patients also had significantly increased responses to NS3 helicase and NS5B than PV patients but not FV patients.
T cell responses across the hepatitis C virus (HCV) genome at baseline and 3–6 months. (A) Total T cell responses and (B) T cell responses across the HCV genome. T cells responses to pooled peptides spanning the entire HCV genome were assessed by ELISpot in 40 patients with genotype 1a infection at two time points. Significant results (p<0.05) are highlighted with asterisks (red indicates significant difference between SC and both FV and PV patients; green indicates significant difference between SC and PV patients). These responses were measured in total (A) and to 10 overlapping peptide pools (B) from across the entire HCV genome.
Fluctuating viraemia
Patients with a fluctuating VL were more likely to have evidence of superinfecting strains than those with plateau persistence (63% vs 29% p=0.04). However, not all FV patients had evidence of superinfection. Among those with single strain infection, persons with recrudescent viraemia had similar dN/dS ratios at baseline but higher cumulative ratios following a second sample than plateau progressors (1.78 vs 0.76; p=0.02). At baseline, those with single strain recrudescent viraemia had higher viral diversity (Hamming distance 2.84 vs 0.49; p=0.04). Peak bilirubin, ALT and number of quasispecies did not differ between these groups. One patient showed evidence of reactivation of HCV 2 years after successful treatment (figure 3C).
Response to treatment
Patients who did not achieve spontaneous clearance 12 weeks following diagnosis were offered treatment with 48 weeks of IFNα and ribavirin, and 66% achieved an SVR.
Discussion
An emerging epidemic of acute HCV in HIV-positive MSM has for the first time allowed characterisation of the natural history of early HCV infection in a large number of HIV-positive patients. Unravelling the determinants of spontaneous clearance of HCV is crucial in order to increase our understanding of the biological mechanisms which define protective immunity and to improve the management of patients who face a lengthy course of treatment which is toxic, expensive and not always effective. HCV infection in HIV-positive individuals is a growing clinical problem associated with an increased rate of disease progression and reduced response to treatment.21 In this longitudinal study of 112 HIV-positive patients with acute HCV, the key predictors of spontaneous clearance were VL dynamics, liver function, viral diversity and T cell response.
Three courses of infection were observed, based on VL changes over time (figure 2). SC (15%) was associated with a rapid decrease in VL. Patients who progressed towards chronicity exhibited two patterns of viraemia; the majority (47.5%) had an initial rise in VL followed by a PV phase, analogous to that seen in other chronic viral infections when the rate of viral clearance equilibrates with the rate of viral production. Some patients, however, developed a pattern of FV (37.5%) characterised by an initial decline and subsequent rise in VL (>1 log10). This pattern of viraemia has been observed in HIV-negative individuals and experimentally infected chimpanzees, but has not previously been correlated with superinfection and loss of T cell control in a large longitudinal study.
We aimed to employ the viral kinetics of early HCV infection to predict subsequent outcome. SC patients had a 2.2 log10 VL drop versus a 0.03 log10 drop in PV and 0.58 log10 drop in FV within 100 days of infection (HR=1.78, p<0.0001; table 2), increasing to a 3.46 versus 0.17 (PV)/0.85 (FV) log10 drop by 200 days (HR=1.68; p<0.0001).
Cox regression analysis indicated that the best diagnostic tests for the prediction of SC were the maximum log10 drop in VL within 100 days, peak bilirubin (≥40 mmol/l), peak ALT(≥1000 IU/l) and baseline CD4 count (≥650×106/l) (tables 1, 2).
A difficulty encountered in predicting the outcome of infection is in distinguishing between those who will develop a FV and those who will go on to spontaneously clear infection, particularly those patients who become transiently RNA negative. Survival analysis was used to compare the time taken to a 2.2 log10 drop or a negative VL in FV and SC patients. The time to a 2.2 log10 drop was significantly shorter in SC versus FV patients (45 vs 120 days; p=0.01) as was the time to a negative VL in the 13 FV patients who did not spontaneously clear infection (108 vs 154 days); thus the rate of decline of viraemia is key in predicting outcome.
A detailed phylogenetic and genetic sequence analysis of 2291 longitudinally acquired clonal E2 HVR-1 sequences allowed us to track the impact of superinfection, and to assess whether measurements of viral diversity and selection had predictive value. Several monophyletic clusters were present (Appendix 3 online), in keeping with multiple transmission events in the MSM population, as previously described.22 Within individuals, the presence of superinfection was suggested by marked non-linear variation in genetic distance over time (Appendix 3 online). Phylogenetic tree analyses (figure 3) revealed evidence of the introduction of new infecting strains in 40%, both of the same genotype and with new genotypes. This high rate of superinfection is in keeping with the likely ongoing high risk behaviour of this group of patients22 and the observation of reinfection events in other cohorts.23 The majority of patients with FV had evidence of reinfection with new strains of HCV (63%). Strain-specific PCR was carried out to reduce overestimation of superinfection due the limitations of clonal analysis.
In order to investigate the influence of positive selection on the diversification of viral strains, mean intrastrain Hamming distance and dN/dS ratios were calculated. Both were significantly higher in progressors by 150 days of infection, consistent with similar observations in HIV-negative individuals.13 In the main, a gradual increase in viral diversity and dN/dS ratio was observed over time in PV patients as a result of generation of positively selected variants associated with a significantly weaker T cell response. In contrast, viral diversity and the dN/dS ratio decreased gradually in SC patients (table 3, figure 4) in association with a strong, multispecific T cell response.
When patients with superinfection were excluded from the analysis, genetic diversity at baseline was greater in the FV group than in the PV group, possibly reflecting a more diverse infecting quasispecies.
FV patients as a group displayed a slow rise in diversity over time and a rise followed by a fall in the dN/dS ratio. However, T cell responses, viral diversity and VL were highly variable in individuals within this group. This variation in FV patients would be in keeping with a model of partial immune control and may reflect within some individuals a delayed partially effective immune response and in others the emergence of escape variants or an unsustained protective immune response due to B or T cell failure, for example as a consequence of PD-1 receptor upregulation (a marker of T cell exhaustion and disease progression both in HIV-positive individuals and in acute HCV infection24 25). Alternatively, it could represent reinfection with the same strain of virus, which has been experimentally demonstrated in the chimpanzee model.26 A third explanation would be the persistence and re-emergence of virus from sites outside the bloodstream, for example the liver, PBMCs or the central nervous system.27 28
Changes observed within the E2 HVR-1 region may reflect direct antibody-driven responses13 29 and indirectly reflect T cell responses to other parts of the genome such as the non-structural proteins.30 Protective immunity in HIV-negative individuals is known to be associated with broad and multispecific CD4 and CD8 T cell responses.14–17 A higher baseline CD4 count (≥650×106/l) was noted in SC patients in this cohort (table 1). We therefore aimed to ascertain if decreased dN/dS ratios and viral diversity within E2 in SC and FV patients were related to a protective T-cell response, by measuring IFNγ responses to overlapping pooled peptides spanning the entire HCV genome. We found that SC patients exhibited significantly stronger multispecific IFNγ responses within 3 months of infection than either progressor group (PV, p=0.006; FV, p=0.01; figure 5). In particular, significant differences in response to NS2/p7, NS3 protease and NS5A were detected (SC vs FV and PV groups). SC patients also had significantly increased responses to NS3 helicase and NS5B than PV progressors. Further studies to characterise specific epitopes within these regions are needed.
One unusual case within the cohort suggested that reactivation of HCV may rarely occur in immunosuppressed individuals. This patient had evidence of reactivation of HCV 2 years after successful treatment for acute disease (figure 5C). This coincided with a period of severe immunosupression (nadir CD4 count 106×106/l and Pneumocystis jerovecii infection) requiring hospitalisation and may have been the result of loss of T cell control of a virus present in the liver but not in the bloodstream, or extremely low level viraemia below the limit of detection. Such cases are rare but have been previously reported in the literature.31
This study is the first longitudinal and detailed analysis of clinical outcome of acute HCV in a large cohort of HIV-positive patients, incorporating viral dynamics, detailed viral sequence evolution and T cell responses. It has a number of limitations. First, it is restricted to an HIV-positive population, although patterns of evolution during early infection may also apply to those with HCV monoinfection. Steps were taken to minimise error rates attributable to PCR contamination and clonal analysis, as detailed in the Supplementary information online. In order to overcome the problem of delayed HCV seroconversion in HIV-positive individuals, as previously reported in this cohort18 (to avoid the inclusion of chronically infected patients), we used retrospective PCR testing on stored HIV VL samples to date the time of infection. More work is needed to further define specific T cell targets and class I/II restriction of these responses, as well as the impact of viral escape.
Acute HCV infection is an emerging global epidemic in HIV-infected men and requires new public health planning and treatment strategies. These data suggest that the outcome of infection can be predicted by the measurement of VL dynamics as well as CD4 count and liver function. Lower genetic diversity and stronger T cell responses are also associated with SC, but were less useful than clinical measures in predicting outcome. Targeting of high risk patients—for example, with no evidence of rapid decline in VL within 100 days—may increase the efficacy of treatment while those more likely to clear infection spontaneously could be monitored for a longer period of time, thus avoiding a rigorous and expensive treatment.
Acknowledgments
Hitesh Mistry and David Muir are acknowledged for the location and provision of backdated HIV VL samples.
References
Supplementary materials
Online only appendix
Files in this Data Supplement:
Footnotes
Funding This research was supported by a clinical research training fellowship from the Wellcome Trust (ECT), the Mason Medical Foundation and the NIHR Biomedical Research Centre.
Competing interests None.
Ethics approval This study was conducted with the approval of the Riverside Research Ethics Committee, Charing Cross Hospital, London, UK.
Provenance and peer review Not commissioned; externally peer reviewed.