Article Text

Abstract
Objective The gut microbiota, which is considered a causal factor in metabolic diseases as shown best in animals, is under the dual influence of the host genome and nutritional environment. This study investigated whether the gut microbiota per se, aside from changes in genetic background and diet, could sign different metabolic phenotypes in mice.
Methods The unique animal model of metabolic adaptation was used, whereby C57Bl/6 male mice fed a high-fat carbohydrate-free diet (HFD) became either diabetic (HFD diabetic, HFD-D) or resisted diabetes (HFD diabetes-resistant, HFD-DR). Pyrosequencing of the gut microbiota was carried out to profile the gut microbial community of different metabolic phenotypes. Inflammation, gut permeability, features of white adipose tissue, liver and skeletal muscle were studied. Furthermore, to modify the gut microbiota directly, an additional group of mice was given a gluco-oligosaccharide (GOS)-supplemented HFD (HFD+GOS).
Results Despite the mice having the same genetic background and nutritional status, a gut microbial profile specific to each metabolic phenotype was identified. The HFD-D gut microbial profile was associated with increased gut permeability linked to increased endotoxaemia and to a dramatic increase in cell number in the stroma vascular fraction from visceral white adipose tissue. Most of the physiological characteristics of the HFD-fed mice were modulated when gut microbiota was intentionally modified by GOS dietary fibres.
Conclusions The gut microbiota is a signature of the metabolic phenotypes independent of differences in host genetic background and diet.
- Gut microbes pyrosequencing
- metabolic heterogeneity
- high-fat diet responsiveness
- type 2 diabetes
- bacterial translocation
- intestinal barrier function
- intestinal bacteria
- bone marrow transplantation
- diabetes mellitus
- gastrointestinal physiology
- diabetes mellitus
- ANAL
- diabetes mellitus
- diabetes mellitus
This is an open-access article distributed under the terms of the Creative Commons Attribution Non-commercial License, which permits use, distribution, and reproduction in any medium, provided the original work is properly cited, the use is non commercial and is otherwise in compliance with the license. See: http://creativecommons.org/licenses/by-nc/2.0/ and http://creativecommons.org/licenses/by-nc/2.0/legalcode.
Statistics from Altmetric.com
- Gut microbes pyrosequencing
- metabolic heterogeneity
- high-fat diet responsiveness
- type 2 diabetes
- bacterial translocation
- intestinal barrier function
- intestinal bacteria
- bone marrow transplantation
- diabetes mellitus
- gastrointestinal physiology
- diabetes mellitus
- ANAL
- diabetes mellitus
- diabetes mellitus
Significance of this study
What is already known about this subject?
Gut microbiota alterations have been shown to be associated and causally linked to metabolic diseases such as type II diabetes and obesity in humans and mice.
A high-fat diet is able to unbalance the gut microbiota and impair the gut barrier resulting in increased endotoxaemia and metabolic diseases in mice.
A core gut microbiome has been shown to exist and divergences from this core define a healthy (ie, lean) versus diseased (ie, obese) status.
What are the new findings?
A change in the ratio of Firmicutes to Bacteroidetes characterises the different metabolic phenotypes independently from the genetic background or the diet during the metabolic adaptation of mice to the dietary treatment.
Direct treatment of the gut microbiota using dietary fibres (gluco-oligosaccharide) affects the metabolic adaptation of the mice independently from their genetic background or their diet.
Different gut microbial community profiles can sign the same metabolic phenotype such as the resistance to diabetes.
Gut physiology and white adipose tissue mainly affect the responsiveness of mice to the high-fat diet independently from their genetic background or the diet.
How might it impact on clinical practice in the foreseeable future?
Bacterial markers could predict the occurrence of a given metabolic phenotype (ie, diabetes) and, furthermore, the treatment of apparently healthy patients with nutritional additives targeting intestinal microbiota might prevent the occurrence of metabolic diseases independently from risk factors such as a fat-enriched diet or a genetic background.
Introduction
The increasing fat-to-fibre ratio in the Western diet is now considered among the major triggering factors of metabolic impairments such as obesity and type II diabetes.1 2 Using axenic mice,3–6 a key advancement has been made during the last decade when the gut microbiota was first associated with, and then causally involved in, the regulation of metabolic diseases. Furthermore, next generation sequencing techniques have allowed a more detailed study of gut microbes by avoiding laboratory cultivation. Pyrosequencing has permitted the identification of the so-called ‘bacterial signature’ of obesity—an increased Firmicutes to Bacteroidetes ratio in humans7 and mice.8
We were the first to link the gut microbiota to inflammation-driven9 10 insulin resistance by showing the lipopolysaccharide (LPS) as an initiator of metabolic impairment.11 A continuous infusion of low-dose LPS induced low-grade chronic inflammation and most of the features of the early onset of metabolic diseases such as visceral fat deposition, glucose intolerance and hepatic insulin resistance.11 Several studies subsequently showed gut microbiota-driven modifications of white adipose tissue (WAT) plasticity by regulating fat storage,12 energy harvesting,13 diet-induced obesity14 and adiposity,15 presenting WAT as a major target of gut microbes.
However, both the genetic background of the host and the dietary environment are responsible for the occurrence of metabolic diseases by shaping the gut microbiota, even if this concept can be challenged by the notion of diabetic-sensitive and diabetic-resistant mice.16 We first showed that, in inbred male C57Bl/6 mice fed a high-fat carbohydrate-free diet (HFD) for 9 months, most of the mice became diabetic and obese but some remained lean and non-diabetic or diabetic but with a lean phenotype.16 Importantly, the metabolism of each phenotype was different, showing that, despite an unchanged genetic background and diet, a metabolic adaptation occurred. We therefore postulated that a different gut microbiota could be associated with the metabolic phenotypes. In this study we focus on the occurrence of diabetes, without obesity as a confounding factor, by pyrosequencing gut microbiota from mice fed a HFD for 3 months and comparing lean diabetes-sensitive (HFD-D) mice with lean diabetes-resistant (HFD-DR) mice. Moreover, to understand whether the gut microbiota directly affected the metabolic phenotypes, another group of mice was given a gluco-oligosaccharide (GOS)-supplemented HFD (HFD+GOS) for 3 months. Our results showed that a phenotype-specific gut microbiota signature exists, characterising the metabolic heterogeneity of mice aside from changes in genetic background and diet.
Materials and methods
Animal model and dietary treatment
A cohort of 100 C57Bl/6 4-week-old male mice was fed a HFD (approximately 72% fat (corn oil and lard), 28% protein and <1% carbohydrate; SAFE, Augy, France) for 3 months. In addition, another group of 10 mice was fed a α1-2-GlucoOligoSaccharide17 (O-α-D-glcp(1-2)-O-α-D-glcp(1-6)n-O-α-D-glcp(1–4) where (2<n<7), GOS)-supplemented HFD (500 mg/mouse/day, 10% of daily intake) (HFD+GOS) for 3 months. Mice were group-housed (five mice per cage) in a controlled environment (inverted 12 h daylight-cycle, light off at 10:00 h). Mice were fasted for 6 h and killed by cervical dislocation; the tissues were collected and snap-frozen in liquid nitrogen. All animal experimental procedures were approved by the local ethical committee of Rangueil University Hospital (Toulouse).
Glucose tolerance test, plasma non-esterified fatty acids and triglyceride
After 3 months of HFD, an intraperitoneal glucose tolerance test (IPGTT) was performed to phenotype the mice as diabetes resistant (HFD-DR) or diabetic (HFD-D). Briefly, mice fasted for 6 h were injected with glucose (1 g/kg) into the peritoneal cavity as previously described.11
Plasma levels of non-esterified fatty acids (NEFA) and triglycerides were measured using commercial kits (Wako Diagnostics, Richmond, Virginia, USA and Triglycerides enzymatiques PAP 150, Biomerieux, Marcy l'Etoile, France, respectively).
Luminex analysis
Simultaneous ELISA assays (tumour necrosis factor α (TNFα), interleukin 6 (IL-6), plasminogen activator inhibitor 1 (PAI-1), insulin, leptin, resistin) were performed with 10 μl plasma and analysed by a continuous flux fluorimeter using Multiplex Immunoassays, Xmap technology (Luminex Corporation, Austin, Texas, USA).
WAT morphometry and F4/80 staining
Adipocyte numbers were classified according to size, estimated by a point counting technique on paraffin-embedded H&E counterstained sections, and expressed as a percentage of the total population counted, as previously described.11 The total count ranged from 3275 to 7052 cells per condition. The mean surface area (μm2) of the adipocytes was calculated using image analyser software (ImageJ). F4/80 staining was performed as follows. Ethanol-fixed paraffin-embedded adipose tissue sections were deparaffinised and rehydrated. Sections were blocked in normal serum and incubated overnight with primary rat anti-mouse F4/80 monoclonal antibody (1/1000; Serotec, Oxford, UK). Endogenous peroxidase activity was quenched when incubated with 3% hydrogen peroxide for 20 min. Secondary antibody staining was done using goat anti-rat biotinylated Ig antibody (1/500, 30 min, room temperature (RT)) and streptavidin-conjugated horseradish peroxidase (1/500, 30 min, RT) and detected with 3,3′-diaminobenzidine. Sections were counterstained with haematoxylin before dehydration and coverslip placement. The number of F4/80 positive cells per microscope field was counted and divided by the total number of adipocytes in the section; 5–12 fields were counted per sample.
FACS analysis
Cells from the stroma vascular fraction (SVF) were obtained after collagenase digestion of fresh mouse visceral WAT, as previously described.18 Murine SVF cells (100 000 cells) were incubated with fluorescein isothiocyanate (FITC)-conjugated antibodies (CD4, F4/80), PE-conjugated antibodies (CD3, CD34), PercP-Cy5.5-conjugated antibody (CD11b), APC-conjugated antibody (CD8, CD31) or respective isotype controls. Analyses were performed using a FACS Calibur flow cytometer as previously described.18
DNA denaturing gradient gel electrophoresis (DNA DGGE)
Total DNA was extracted from frozen caecum contents using the TriPure reagent (Roche Diagnostics, Meylan, France) according to the manufacturer's protocol. 200 ng DNA were amplified by PCR using a Taq Polymerase (Sigma Aldrich, St Louis, Missouri, USA) and 300 nM denaturing gradient gel electrophoresis (DGGE)-specific 16S rRNA universal primers (forward primer 5′-CGCCCGGGGCGCGCCCCGGGCGGGGCGGGGGCACGGGGGGAC TCCTACGGGAGGCAGCAGT-3′; reverse primer 5′-GTATTACCGCGGCTGCTGGCAC-3′), carrying (forward primer only) a GC-enriched region (GC clamp), generating 233 bp amplicons. The size of the latter was checked by 2% agarose gel electrophoresis. 80 ng of amplicons were loaded on 8% acrylamide gel with a 35–55% (w/v) urea denaturant gradient. The gels were run overnight in TAE 1X at 60°C. The following day the gels were stained for 30 min in TAE 1X-SYBR safe DNA gel staining and scanned with a Typhoon 9400 instrument (Amersham Biosciences, GE Healthcare Europe GmbH Branch France, Velizy-Villacoublay, France). The band profile was analysed using PermutMatrixEN software Version 1.9.3.0.19
RNA extraction and real-time PCR
Total RNA was extracted from frozen subcutaneous or visceral WAT using the RNeasy mini kit (Qiagen, Courtaboeuf, France). 500 ng RNA were retrotranscripted for 2 h at 37°C using Superscript II reverse transcriptase (Invitrogen, Cergy Pontoise, France) with random hexamers. Real-time PCR was performed with 12.5 ng cDNA and 900 or 300 nM concentrations of forward and reverse primers in a final volume of 20 μl using the SYBR green or TaqMan Universal PCR Master Mix (Applied Biosystems, Courtaboeuf, France). Fluorescence was monitored and analysed in a GeneAmp 7500 detection system instrument (Applied Biosystems). Analysis of the 18S ribosomal RNA was done in parallel using the primers and probe of the ribosomal RNA control Taqman Assay Kit (Applied Biosystems) to normalise gene expression. The results are expressed as 2(Ct18S-Ctgene), where Ct corresponds to the number of cycles needed to generate a fluorescent signal above a predefined threshold. Primers were designed using the Primer Express software (Applied Biosystems).
Bacterial RT-PCR
Total RNA was extracted from frozen caecum contents using the TriPure reagent according to the manufacturer's protocol. 1 μg total RNA was retrotranscripted for 2 h at 37°C using the High-Capacity cDNA Reverse Transcription Kit (Applied Biosystems, Villebon-sur-Yvette, France). 10 ng cDNA were amplified using sense and antisense primers at a concentration of 300 nM and the Power SYBR Green PCR Master Mix (Applied Biosystems). The bacterial primer sequences are reported in table 2 in the online supplement.
Gut paracellular permeability assay
Ileum, caecum and colon were collected from fed mice and strips mounted in Easymount Ussing-type chambers (Physiologic Instruments, San Diego, California, USA) with a flux area of 0.3 cm2, as previously described.20 After 15 min, one-fifth of the initial volume of the apical compartment (mucosal side) buffer solution was replaced with FITC-labelled dextran (4000 Da, 0.022 g/ml, Sigma). After 1 h the fluorescent intensity was measured on the serosal side of the chamber.
Protein extraction and western blot analysis
WAT, liver and skeletal muscle lysates were prepared as described elsewhere.21 The following antibodies were used: pSer536NF-kB, NF-kB, pSer2448mTOR, mTOR, pSer307IRS-1, IRS-1, IRS-2, pSer473Akt, Akt, β-actin, pThr172AMPKα, AMPK, pSer79ACC, ACC, pSer9GSK-3β, GSK-3β, pThr183/Tyr185SAPK/JNK, SAPK/JNK, SOCS-3 (Cell Signaling Technology, Ozyme, Saint Quentin, France), PKCε and PKCθ (Santa Cruz, Heidelberg, Germany).
Intestinal tight junction proteins: western blot analysis
Ileal and caecal samples were homogenised in RIPA buffer (1% Igepal, 0.5% deoxycholic acid, and 0.1% SDS in Tris buffered saline solution 1X, pH 7.4) with protease inhibitors (Roche Diagnostics, Meylan, France) and centrifuged at 10 000g for 10 min (4°C). Protein concentrations were assayed using the BC Assay Uptima kit (Interchim, Montluçon, France). Equal amounts of protein per lane were separated by SDS-PAGE and transferred onto nitrocellulose membranes (Optitran, Schleicher 1 Schuell Biosciences, Dassel, Germany). Membranes were blocked with 5% dry milk or 10% FCS in 0.1% Tween in TBS (TBS-T) for 2 h (RT) and then incubated overnight at 4°C with primary antibodies. Immunoblotting was performed using polyclonal rabbit anti-occludin antibody (Zymed Laboratories, South San Francisco, California, USA) diluted 1:500 in 5% dry milk in TBS-T or polyclonal rabbit anti-ZO-1 (Zymed Laboratories) diluted 1:1000 or anti-GAPDH (Cell Signaling) diluted 1:1000 or anti-JAM-A (Abcam, Cambridge, UK) diluted 1:2500 in 10% FCS in TBS-T. After washing in TBS-T the membranes were incubated for 1 h at RT with secondary antibodies conjugated to IRDye 800CW (Li-COR). After washing again in TBS-T the membranes were briefly rinsed in TBS and scanned and analysed by an Odyssey IR scanner using Odyssey imaging software 3.0. Scan settings were medium or high image quality, 169 μm resolution and intensity 3.0–6.0 for both channels with no offset. Antibody signals were analysed as integrated intensities of regions defined around the bands of interest in either channel.
Pyrosequencing
Extraction and amplification of DNA
DNA was extracted from frozen caecum contents using the QIAamp DNA mini stool kit (Qiagen, Courtaboeuf, France), slightly modified by adding a bead (≤106 μm diameter) beating step (6500 rpm, 3×30 s). 200 ng DNA were amplified by PCR using the Pfu DNA Polymerase (Fermentas, Saint-Rémy-lès-Chevreuse, France). The 16S rRNA V2 region was targeted by using the forward primer 8F 5′-AGAGTTTGATCMTGGCTCAG-3′ and reverse primer 338R 5′-GCTGCCTCCCGTAGGAGT-3′.22 Pyrosequencing was carried out on a multiplexed GS FLX-Ti, following the manufacturer's recommendations (454 Life Sciences, Roche). Six mice per group were sequenced in six runs (three mice per run).
Bioinformatic analysis
2 969 179, 2 533 380 and 2 403 166 raw sequence reads were first processed with 16SCleaner (https://mulcyber.toulouse.inra.fr/plugins/mediawiki/wiki/ng6/index.php/16Scleaner) to yield a total of 2 059 967, 1 479 791 and 1 591 906 reads from the HFD-DR, HFD-D and HFD+GOS groups, respectively. The Mothur package23 was used, following the Costello stool analysis pipeline (http://www.mothur.org/wiki/Costello_stool_analysis), to further filter reads and generate taxonomic classification information (using the Silva database, http://www.arb-silva.de/) for a final set of 1 626 411, 959 215 and 1 182 616 reads. PermutMatrixEN software version 1.9.3.019 was used to identify clusters at the level of both mice groups and taxa.
Statistical analysis
The results are presented as means ± SEM. Statistical analysis was performed by one-way or two-way ANOVA followed by post hoc tests (Tukey or Bonferroni test, as reported) or by unpaired Student t test, using GraphPad Prism Version 5.00 for Windows Vista (GraphPad Software, San Diego, California, USA). p Values <0.05 were considered significant.
Results
Metabolic adaptation to high-fat feeding after 3 months
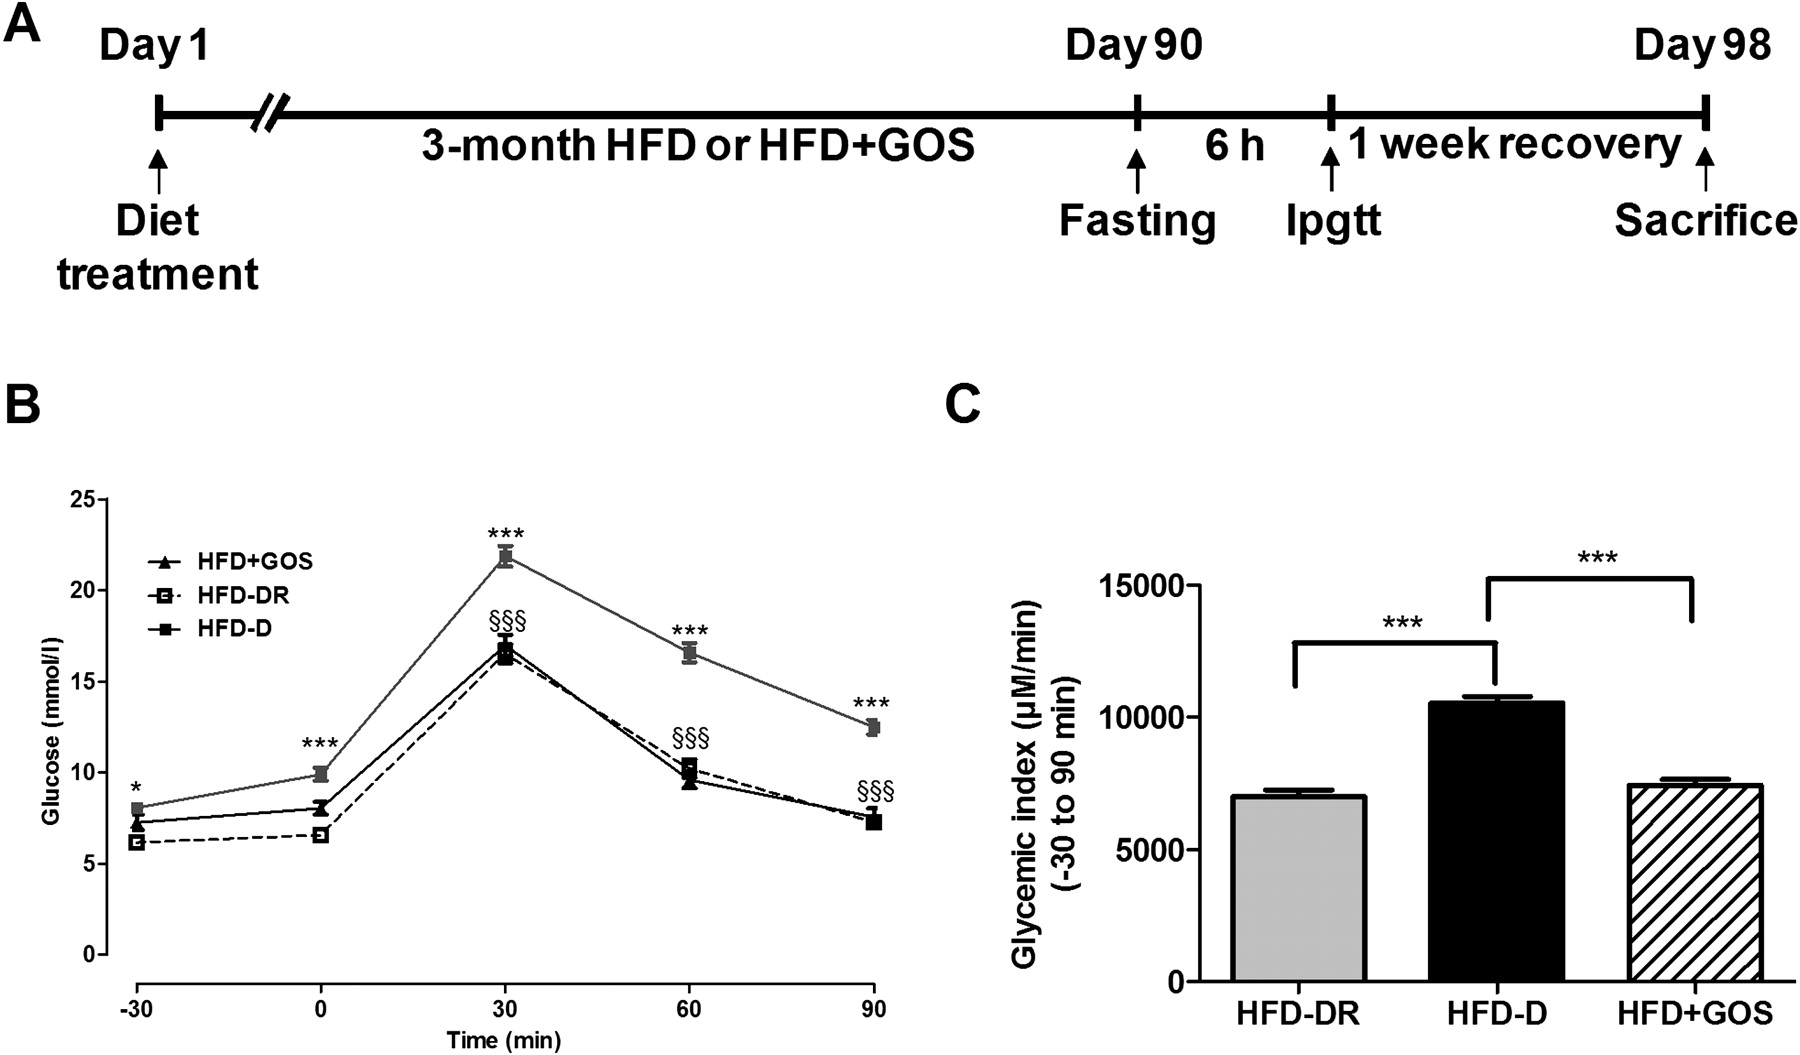
To test whether metabolic phenotypes in HFD-fed mice were linked to a specific gut microbial signature, 100 4-week-old C57Bl/6 male mice were fed a diabetogenic/non-obesogenic carbohydrate-free (<1%) HFD for 3 months (figure 1A). An IPGTT was then performed and the mice were separated according to their resistance (HFD-DR) or sensitivity (HFD-D) to HFD-induced diabetes. HFD-D mice were characterised by higher glycaemia at all time points compared with HFD-DR mice (figure 1B), as also shown by the glycaemic index (figure 1C). To modify the gut microbiota directly, an additional group of 10 mice was fed HFD+GOS for 3 months. HFD+GOS mice showed a similar degree of glucose tolerance to HFD-DR mice (figure 1B,C) and to previously published results in a different glucose-intolerant model.24

Metabolic adaptation after 3 months of high-fat diet (HFD) and change in phenotype by supplementation of HFD with gluco-oligosaccharides (GOS). (A) Timeline of the experimental protocol. (B) Intraperitoneal glucose tolerance test (IPGTT) in HFD-fed mice that became diabetic (HFD-D, closed squares, n=24), diabetes-resistant (HFD-DR, open squares, n=10) or fed a GOS-supplemented HFD (HFD+GOS, closed triangles, n=10). Data are shown as mean ± SEM; *p<0.05, ***p<0.001 (HFD-D vs HFD-DR) and §§§p<0.001 (HFD-D vs HFD+GOS) (two-ANOVA and Bonferroni post test). (C) Glycaemic index; ***p<0.001 (unpaired Student t test).
Analysis of multiple metabolic parameters
The metabolic adaptation to HFD was associated with numerous metabolic parameters. In plasma, fasting levels of NEFA increased in HFD-DR mice compared with HFD-D and HFD+GOS mice (see table 1 in online supplement). Conversely, plasma fasting and fed triglyceride levels increased in HFD-D mice compared with HFD-DR and HFD+GOS mice (see table 1 in online supplement). Fasting insulin was lower in HFD-D and HFD+GOS mice than in HFD-DR mice, whereas fed insulin levels did not vary significantly (see table 1 in online supplement). Body weight was recorded twice per month to ensure a lack of diet-induced obesity. As expected, no statistically significant change was observed (HFD-DR 26.5±0.3 g, HFD-D 27.8±0.3 g, HFD+GOS 28.4±0.4 g; p>0.05).
Metabolic adaptation to HFD is associated with metabolic phenotype-specific gut microbiota
To investigate the gut microbiota from metabolic phenotypes we first performed a DGGE on subsets of three mice per group as a primary validation of our hypothesis. DGGE data showed that the intestinal microbial profiles were considerably different among all metabolic phenotypes (see figure 2 in online supplement). Importantly, it was possible to cluster the three metabolic phenotypes according to Pearson tree analysis. However, HFD-DR and HFD-D mice were still characterised by some degree of similarity. Conversely, the gut microbial profile of HFD+GOS mice was even more different from HFD-DR and HFD-D mice (see figure 2 in online supplement).
We next quantified living bacteria in the caecum. Since up to 90% of gut microbiota is composed of Firmicutes and Bacteroidetes (two major bacterial phyla), we focused mostly on bacteria from these divisions. Quantitative RT-PCR was used to measure the 16S rRNA concentration of bacteria found modulated during altered metabolism (see table 2 in online supplement). The results showed that the microbial composition varied according to the different metabolic phenotypes. The main significant differences between HFD-D and HFD-DR mice concerned the C leptum cluster IV (figure 3A in online supplement), Enterococcus spp (figure 3C in online supplement) and Nitrospira spp (figure 3D in online supplement), which were significantly decreased in HFD-D mice compared with HFD-DR mice. Interestingly, GOS supplementation of HFD generally reduced the count of the overall bacteria analysed except Bifidobacterium spp (figure 4A in online supplement) and Bacteroides prevotella (figure 4C in online supplement), although the differences were not statistically significant (p=0.098 and p=0.099, respectively).
Pyrosequencing of the gut microbiota identifies bacterial genera associated with metabolic phenotypes
To analyse the metagenomic signature, the overall caecal microbiota from each metabolic phenotype was sequenced. The operational taxonomic unit (OTU) count was higher in HFD-D mice than in HFD-DR mice while the read counts varied in the opposite direction (figure 1A,B in online supplement). Importantly, GOS treatment affected both parameters.
The data also showed an inverted Bacteroidetes to Firmicutes ratio between HFD-D and HFD-DR mice (figure 2A). We then analysed the corresponding families and genera in more detail. The Lachnospiraceae family (Firmicutes) was reduced by 28% in the HFD-D group compared with the HFD-DR group (figure 2C). In addition, the Oscillibacter genus was also reduced by 54% (figure 3A). The Ruminococcaceae family (Firmicutes) was slightly reduced (2%) in HFD-D mice compared with HFD-DR mice (figure 2C).

Caecum microbial profiles vary according to metabolic phenotypes. Pyrosequencing analysis of (A, B) phyla and (C–E) taxa families in mice fed a high-fat diet (HFD) which became diabetic (HFD-D) or diabetes-resistant (HFD-DR) or mice fed HFD supplemented with gluco-oligosaccharides (HFD+GOS). Data are shown as a percentage of the total identified sequences per group.

Caecum microbial genera of different metabolic phenotypes. (A-E) Pyrosequencing of genera in mice fed a high-fat diet (HFD) that became diabetic (HFD-D), diabetes-resistant (HFD-DR) or mice fed a diet supplemented with gluco-oligosaccharides (HFD+GOS). Data are shown as a percentage of the total identified sequences per group.
Within the Bacteroidetes, the proportion of the S24-7 family almost tripled in the HFD-D group (figure 2D) as well as the Deferribacteres phylum (figure 2B). Furthermore, the genus Parasutterella remained unchanged and the Helicobacter genus (both Proteobacteria) was dramatically reduced (figure 3D).
Interestingly, the Bacteroidetes to Firmicutes ratio was dramatically increased in HFD+GOS mice and the Actinobacteria phylum almost totally disappeared (0.1%) (figure 2A). Altogether, numerous other families and genera were affected. In particular, HFD+GOS mice had increased S24-7 family (figure 2D) and Parabacteroidetes genus (figure 3B) whereas the Coriobacteriaceae family (figure 2E) and Olsenella (figure 3C) and the Mucispirillum genera (figure 3E) disappeared. The gut microbial signature of each metabolic phenotype is summarised in figure 4.

Cluster identification of gut microbial profiles of the different metabolic phenotypes: (A) phyla, (B) families, (C) genera and (D) overall taxa shown according to metabolic phenotypes for mice fed a high-fat diet (HFD) that became diabetic (HFD-D, closed squares), diabetes-resistant mice (HFD-DR, open squares) and mice fed a diet supplemented with gluco-oligosaccharides (HFD+GOS, closed triangles). Pearson tree analysis was performed to cluster groups (top) and taxa (left side) of each heat map.
Plasma inflammation and gut paracellular permeability are associated with metabolic phenotypes
To further determine whether changes in the gut microbiota could be associated with bacterial inflammatory factors, we measured the plasma concentration of LPS. Fasting LPS plasma levels increased in HFD-D mice compared with HFD-DR mice but were reduced when the gut microbiota was challenged by GOS treatment (figure 5A). Measurement of circulating cytokines showed that, of the cytokines TNFα, IL-6 and PAI-1, the latter was significantly increased in HFD-D mice compared with HFD-DR mice and GOS treatment significantly modified this parameter (figure 5B).
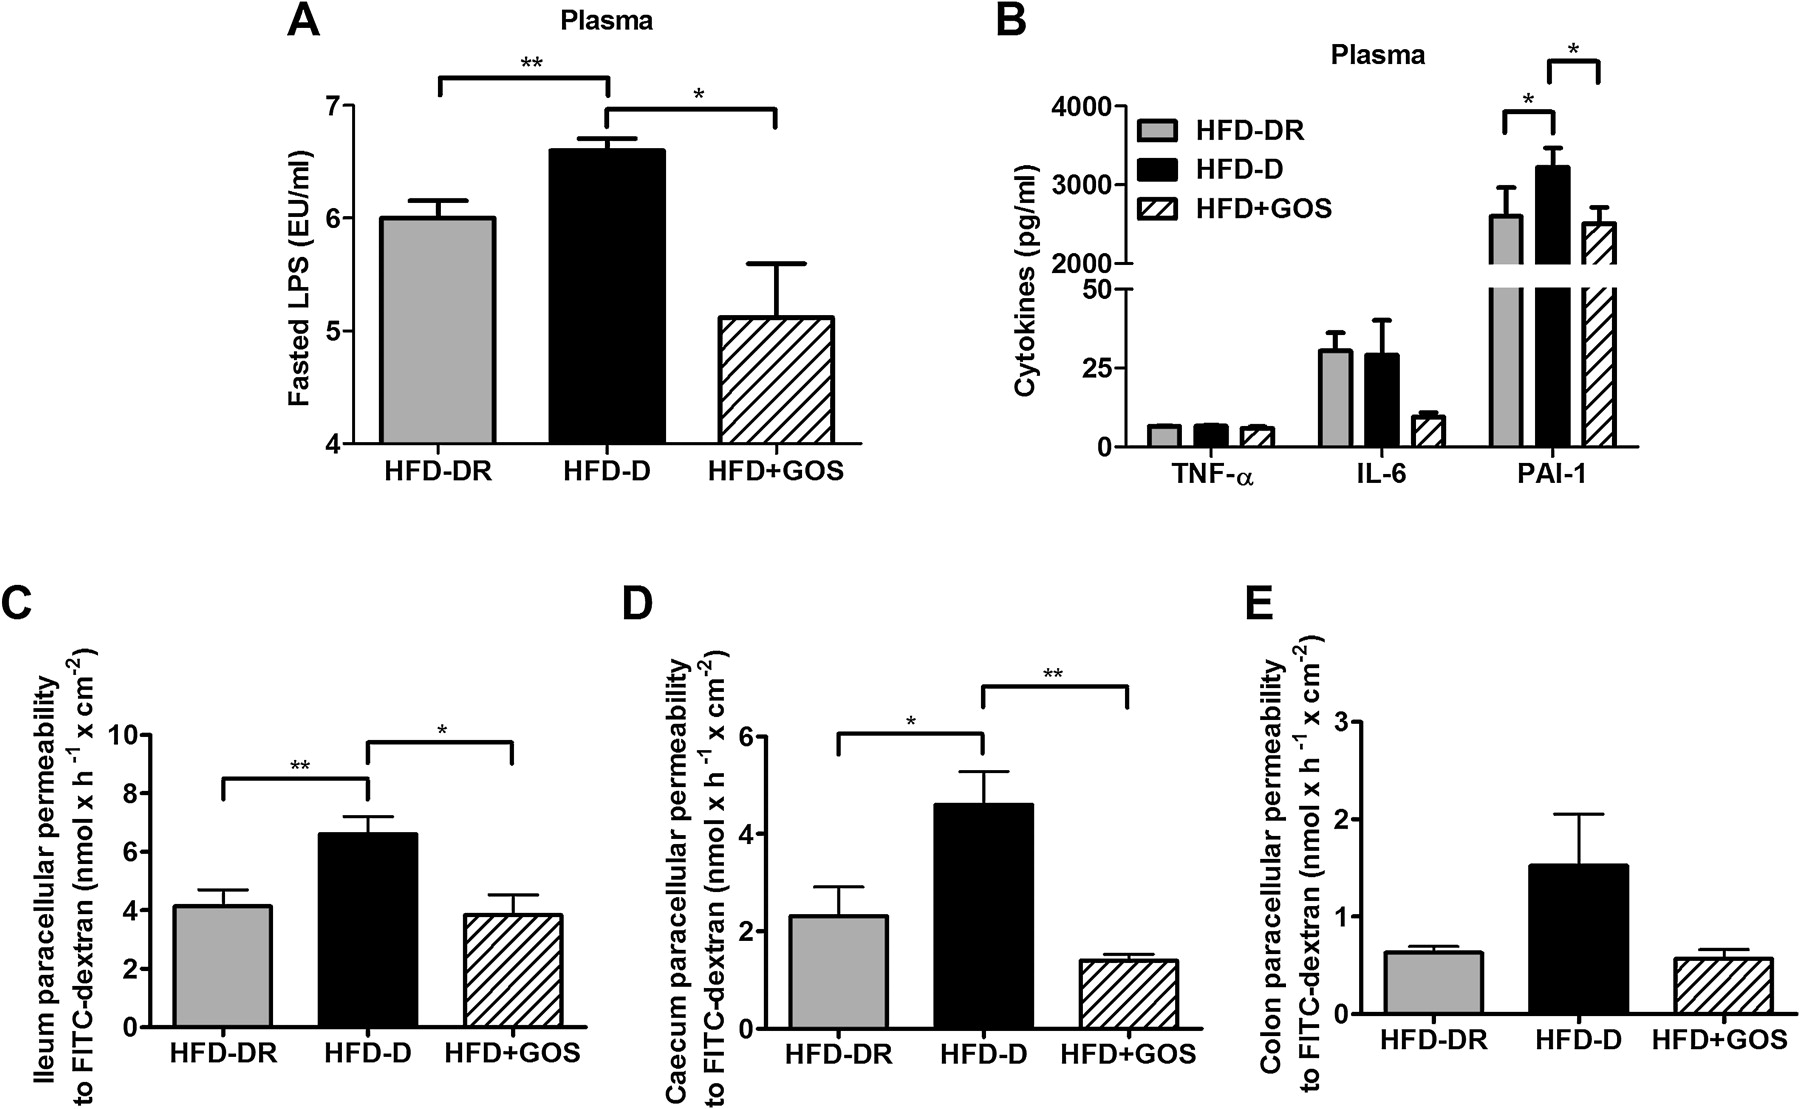
Plasma inflammation and gut paracellular permeability. (A) Fasting plasma lipopolysaccharide (LPS) levels, (B) cytokine concentrations in plasma and (C–E) intestinal paracellular permeability in the ileum (C), caecum (D) and colon (E) in mice fed a high-fat diet (HFD) that became diabetic (HFD-D), diabetes-resistant (HFD-DR) and in mice fed a diet supplemented with gluco-oligosaccharides (HFD+GOS). Data are shown as mean ± SEM; *p<0.05, **p<0.01 (unpaired Student t test; n=6–12 per group). IL, interleukin; PAI-1, plasminogen activator inhibitor 1; TNFα, tumour necrosis factor α.
To understand whether a different endotoxaemia could be related to altered gut permeability, as already reported,4 we measured permeability using Ussing's chambers. Paracellular permeability in the ileum and caecum was significantly increased in HFD-D mice compared with all the other groups (figure 5C,D), but not significantly (p>0.05) in the colon (figure 5E). In the ileum this was coupled to a reduction in occludin and junctional adhesion molecule A (JAM-A) compared with HFD-DR mice but not ZO-1 (p>0.05, figure 5A in online supplement). Conversely, HFD+GOS mice showed an increase in all the studied proteins compared with the other groups (figure 5A in online supplement). Similar results were obtained in the caecum, except for ZO-1 which did not vary significantly (p>0.05) between all the groups (figure 5B in online supplement).
WAT and metabolic adaptation
We then focused on subcutaneous and visceral WAT as a major target of gut microbiota.12–15 The weight of both subcutaneous and visceral WAT depots increased in HFD-D mice compared with HFD-DR mice. GOS treatment prevented this increase (figure 6A in online supplement). Plasma leptin and resistin were increased in the HFD-D metabolic phenotype as well as subcutaneous mRNA concentrations of both, and the increases were prevented by GOS treatment (figure 6B,C in online supplement). Apelin expression was increased in HFD-D subcutaneous and visceral WAT whereas the adiponectin mRNA was not changed in any group (figures 6D and 7B in online supplement).
In all the groups the mRNA concentration of metabolic genes (GLUT4, FAS, AP2) was similar (p>0.05; figures 6E and 7C in online supplement). No relevant differences (p>0.05) were observed in inflammatory marker mRNAs among all groups in subcutaneous (figure 6F in online supplement) or visceral WAT (figure 7D in online supplement).
The adipocyte area increased in HFD-D mice compared with HFD-DR mice but GOS treatment did not significantly affect this parameter (p>0.05, figure 6A,B). Subsequently, cells from the SVF were isolated and studied by FACS analysis. The total SVF cell number was increased in HFD-D mice compared with HFD-DR mice and GOS treatment prevented the occurrence of the diabetic metabolic phenotype (figure 6C). Furthermore, we characterised different SVF cell populations. Preadipocytes, macrophages and lymphocytes were increased in the HFD-D group compared with the HFD-DR group. HFD+GOS mice had a reduced overall lymphocyte cell count (notably T lymphocytes) compared with HFD-DR mice, although the difference was not statistically significant (figure 6D).

Cell architecture and inflammation in visceral white adipose tissue (WAT). (A) Adipocyte area and distribution, (B) mean adipocyte area, (C) total cell count of the stroma vascular fraction (SVF)/g visceral WAT, (D) endothelial (CD31+), preadipocytes (CD34+), macrophages (F4/80/CD11b+), total lymphocytes and T cells (CD3+), (E) macrophage immunostaining and number (%) per adipocyte count, (F) western blot analysis of phosphorylated and total proteins involved in inflammatory pathways in mice fed a high-fat diet (HFD) which became diabetic (HFD-D), diabetes-resistant (HFD-DR) and mice fed a diet supplemented with gluco-oligosaccharides (HFD+GOS). Data are shown as mean ± SEM; *p<0.05, **p<0.01, ***p<0.001 (unpaired Student t test; n=5–12 per group).
Immunohistochemistry confirmed the FACS data, showing a significant increased percentage of macrophages per adipocyte count in HFD-D mice compared with HFD-DR mice and no significant differences compared with HFD+GOS mice (figure 6E).
In agreement with increased immunoinflammatory cell accumulation, both NF-κB and mTOR phosphorylation increased in HFD-D mice compared with HFD-DR mice. Conversely, HFD+GOS mice showed a reduced non-significant trend for NF-κB and a similar trend, but to a lesser extent, for mTOR activation (figure 6F). In addition, no significant changes (p>0.05) were observed in any groups in insulin signalling and energy metabolic pathways, except for the activation of AKT which was significantly increased in HFD+GOS mice compared with HFD-D mice (figure 7 in online supplement).
Changes in the gut microbiota slightly affected liver and skeletal muscle during metabolic adaptation
To determine whether the metabolic endotoxaemia also affected other insulin-responsive organs, we quantified proteins involved in liver and skeletal muscle metabolism. Notably, HFD-D mice had a significant increase in liver weight compared with HFD-DR mice (figure 7A). Surprisingly, HFD+GOS mice also showed a significant increase in liver weight compared with HFD-DR mice, and to the same extent as HFD-D mice (figure 7A). Moreover, TNFα and IL-6 mRNA concentrations did not vary significantly (p>0.05) whatever the group, whereas PAI-1 mRNA significantly increased in HFD-D mice compared with HFD-DR and HFD+GOS mice (figure 7B). Surprisingly, liver insulin (figure 7C), energy (figure 7D) and inflammatory pathways (figure 7E) did not show significant changes (p>0.05) between all the groups.

Liver weight, inflammation, insulin and energy pathways during metabolic adaptation. (A) Liver weight; (B) TNFα, IL-6 and PAI-1 mRNA concentrations; (C–E) western blot analysis of phosphorylated and total proteins involved in (C) insulin signalling, (D) energy metabolism and (E) inflammation from mice fed a high-fat diet (HFD) which became diabetic (HFD-D), diabetes-resistant (HFD-DR) or mice fed a diet supplemented with gluco-oligosaccharides (HFD+GOS). Data are shown as mean ± SEM; *p<0.05, ***p<0.001 (unpaired Student t test; n=4 per group). IL, interleukin; PAI-1, plasminogen activator inhibitor 1; TNFα, tumour necrosis factor α.
We subsequently investigated skeletal muscle and found that only TNFα mRNA increased in HFD-D mice compared with HFD-DR and HFD+GOS mice (figure 8A in online supplement). Again there were no major changes (p>0.05) in insulin, energy and inflammatory pathways between all the groups (figure 8B in online supplement).
Discussion
In this study we have shown that diabetes-sensitive (HFD-D) and diabetes-resistant (HFD-DR) metabolic phenotypes are associated with a specific gut microbial profile, aside from changes in genetic background and diet. Moreover, targeting the gut microbiota of HFD-fed mice with dietary fibres prevented the occurrence of the diabetic phenotype and showed a specific microbial signature. Our data further corroborate increased gut permeability and WAT plasticity during type II diabetes.
The microbial diversity of different metabolic phenotypes displayed a wider variation in OTUs than read counts, suggesting that a given metabolic phenotype (ie, HFD+GOS) could be selecting specific bacterial populations (ie, Bacteroidetes), as shown for prebiotics.25 A meticulous examination revealed that the Bacteroidetes to Firmicutes ratio increased in the diabetic phenotype, confirming the results reported in patients with type II diabetes26 but contrasting with findings reported by Gordon et al.7 However, we aimed to study type II diabetes per se, intentionally lacking obesity, which explains the aforementioned mismatch. In fact, obesity has been shown as a main driving factor of changes in the gut microbiome between lean and obese twins where, despite different microbe assembly, a core microbiome exists and divergence from it leads to a pathological state (ie, lean vs obese).22
Indeed, we identified specific changes in genera (Oscillibacter, Parabacteroidetes, Alistipes and Olsenella, Helicobacter and Mucispirillum) as a signature of the metabolic phenotype. The reasons for the changes in the gut microbiota remain unclear, despite unchanged genetic background and diet. Furthermore, this result is specifically linked to caecal microbiota. We cannot exclude the possibility that a different outcome could have occurred in other gut regions. A different food intake and/or the immune system could also have contributed to shape the microbiota, as reported in other studies.27–30 To determine whether gut microbiota is the cause or consequence of the metabolic phenotypes, we specifically modified it with dietary fibres.25 31 This treatment dramatically changed the gut microbiota and then the metabolic phenotype, suggesting that it could be causal, although demonstration of the causality needs further evaluation in germ-free mice. In addition, despite the diabetic state being normalised, the HFD+GOS microbiota still remained different from the non-diabetic HFD-DR mice, suggesting that several gut microbiota profiles could be a signature for the same metabolic phenotype. The pathophysiological mechanisms involved in the induction of different metabolic phenotypes might differ. To gain some information on the link between microbial profiles and metabolic phenotypes we characterised numerous tissue features.
Our data suggest that the impact of the specific microbiota was facilitated by increased gut permeability in both the ileum and caecum of HFD-D mice, resulting in increased endotoxaemia. This change could indeed dramatically affect metabolism since the intestinal barrier plays a critical role in the transport of nutrients and macromolecules and, at the same time, provides an effective barrier to harmful macromolecules and microorganisms.32 Loose tight junctions could therefore allow nutritional and other microbial substances to cross the intestinal epithelium and target WAT, resulting in increased adipokine production (leptin and resistin), adipose cell size and SVF cell number, thus confirming the literature.12–15
Conversely, neither liver nor skeletal muscle showed major metabolic modulations besides an increased TNFα mRNA concentration in HFD-D mice, suggesting that these organs do not play a pivotal role during metabolic adaptation as an early event shaping the metabolic phenotypes.
On the other hand, WAT is an important player in the control of metabolic inflammation leading to insulin resistance.9 33 34 Here we show that HFD-D mice were characterised by a large increase in SVF cell number. In addition, most of the cellular populations including macrophages, preadipocytes and lymphocytes tended to increase. Such changes could be responsible for the diabetic phenotype under the control of the gut microbiota, and may even explain the increased inflammatory tone observed in HFD-D mice via the slight but significant increased activation of NF-κB and mTOR pathways which are upregulated during metabolic diseases.
We conclude that a specific gut microbiota, aside from changes in genetic background and diet, is a signature of the different metabolic phenotypes of ‘diabetic’ versus ‘diabetes-resistant’ during metabolic adaptation to HFD. We cannot exclude the possibility that subtle changes in the microbiota occurred before the HFD treatment and/or that epigenetic mechanisms could have oriented a given phenotype. However, mice from the same cage do not have completely similar gut microbiota (as occurs in mono-colonised axenic mice).
Our data suggest that the gut microbiota could affect WAT biology, essentially affecting the SVF. Consequently, modulating the gut microbiota by appropriate dietary fibres represents a promising strategy to control or prevent metabolic diseases.
Acknowledgments
We would like to thank the GenoToul Anexplo core facility (Dr Legonidec) in Toulouse (France) and John Woodley for editing the English.
References
Supplementary materials
Supplementary Data
This web only file has been produced by the BMJ Publishing Group from an electronic file supplied by the author(s) and has not been edited for content.
Files in this Data Supplement:
- Data supplement 1 - Online figure 1
- Data supplement 2 - Online figure 2
- Data supplement 3 - Online figure 3
- Data supplement 4 - Online figure 4
- Data supplement 5 - Online figure 5
- Data supplement 6 - Online figure 6
- Data supplement 7 - Online figure 7
- Data supplement 8 - Online table 1
- Data supplement 9 - Online table 2
Footnotes
See Commentary, p 474
Funding This work was supported by grants from Agence Nationale pour la Recherche (ANR) to RB and collaborators (ANR-Florinflam and Transflora); in part, by the European Commission's Seventh Framework programme under grant agreement No 241913 (FLORINASH) to RB and by the Benjamin Delessert Foundation to MS.
Competing interests None.
Provenance and peer review Not commissioned; externally peer reviewed.
Linked Articles
- Commentary