Article Text

Abstract
Objective Gastric cancer is a major gastrointestinal malignancy for which targeted therapies are emerging as treatment options. This study sought to identify the most prevalent molecular targets in gastric cancer and to elucidate systematic patterns of exclusivity and co-occurrence among these targets, through comprehensive genomic analysis of a large panel of gastric cancers.
Design Using high-resolution single nucleotide polymorphism arrays, copy number alterations were profiled in a panel of 233 gastric cancers (193 primary tumours, 40 cell lines) and 98 primary matched gastric non-malignant samples. For selected alterations, their impact on gene expression and clinical outcome were evaluated.
Results 22 recurrent focal alterations (13 amplifications and nine deletions) were identified. These included both known targets (FGFR2, ERBB2) and also novel genes in gastric cancer (KLF5, GATA6). Receptor tyrosine kinase (RTK)/RAS alterations were found to be frequent in gastric cancer. This study also demonstrates, for the first time, that these alterations occur in a mutually exclusive fashion, with KRAS gene amplifications highlighting a clinically relevant but previously underappreciated gastric cancer subgroup. FGFR2-amplified gastric cancers were also shown to be sensitive to dovitinib, an orally bioavailable FGFR/VEGFR targeting agent, potentially representing a subtype-specific therapy for FGFR2-amplified gastric cancers.
Conclusion The study demonstrates the existence of five distinct gastric cancer patient subgroups, defined by the signature genomic alterations FGFR2 (9% of tumours), KRAS (9%), EGFR (8%), ERBB2 (7%) and MET (4%). Collectively, these subgroups suggest that at least 37% of gastric cancer patients may be potentially treatable by RTK/RAS directed therapies.
- Barrett's carcinoma
- Barrett's metaplasia
- cancer
- cell signalling
- chemotherapy
- colorectal cancer screening
- copy number alterations
- gastric cancer
- gastric carcinoma
- gastric pre-cancer
- gastrointestinal cancer
- gastrointesinal endoscopy
- gastroscopy
- gene expression
- gene mutation
- molecular pathology
- oesophageal cancer
- receptor tyrosine kinases
- targeted therapies
This is an open-access article distributed under the terms of the Creative Commons Attribution Non-commercial License, which permits use, distribution, and reproduction in any medium, provided the original work is properly cited, the use is non commercial and is otherwise in compliance with the license. See: http://creativecommons.org/licenses/by-nc/2.0/ and http://creativecommons.org/licenses/by-nc/2.0/legalcode.
Statistics from Altmetric.com
- Barrett's carcinoma
- Barrett's metaplasia
- cancer
- cell signalling
- chemotherapy
- colorectal cancer screening
- copy number alterations
- gastric cancer
- gastric carcinoma
- gastric pre-cancer
- gastrointestinal cancer
- gastrointesinal endoscopy
- gastroscopy
- gene expression
- gene mutation
- molecular pathology
- oesophageal cancer
- receptor tyrosine kinases
- targeted therapies
Significance of this study
What is already known about this subject?
Gastric cancer patients with ERBB2-amplified tumours can clinically benefit from ERBB2-targeted therapies. Similar to ERBB2, several other molecularly targeted therapies are currently being evaluated in gastric cancer.
Little is known regarding which molecular targets are concurrently expressed in the same gastric tumours, or independently in different tumours.
Unlike other cancer types, activating mutations in KRAS are also rarely observed in gastric cancer.
What are the new findings?
This study identified 22 recurrent genomic alterations in gastric cancer, comprising both known gastric cancer targets (FGFR2, ERBB2) and genes not previously reported to be amplified in gastric cancer (KLF5, GATA6).
Genes related to RTK/RAS signalling, in particular FGFR2, KRAS, ERBB2, EGFR and MET are frequently amplified in gastric cancer in a mutually exclusive manner.
FGFR2-amplified gastric cancers exhibited sensitivity to dovitinib, an orally bioavailable targeted therapy.
KRAS amplifications, frequently observed in gastric cancer, are significantly associated with adverse prognosis.
How might it impact on clinical practice in the foreseeable future?
Dovitinib may represent a subtype-specific therapy for FGFR2-amplified gastric cancers.
KRAS genomic amplification status should be assessed in clinical trials involving therapies targeting upstream RTK.
Genomic amplifications in RTK/RAS components define five distinct gastric cancer molecular subgroups, to which differing therapies can be allocated. In total, 37% of the gastric cancer population may be treatable by RTK/RAS targeting agents.
Gastric adenocarcinoma, or gastric cancer is a leading cause of global cancer mortality with an overall 5-year survival rate of approximately 20%.1 2 Particularly prevalent in many Asian countries,3 most gastric cancer patients present at advanced disease stages and are treated by palliative chemotherapy, with median survival times of 11–12 months.4 In addition to standard cytotoxic regimens, targeted therapies, which are small molecules or antibodies designed to disrupt the activity of specific oncogenic signalling pathways, have recently emerged as a promising therapeutic strategy. In the recent ToGA trial,4 trastuzumab, an anti-HER2/ERBB2 targeting antibody, improved the overall survival of patients with HER2-positive tumours when combined with chemotherapy. However, because only 7–17% of gastric cancer patients are HER2 positive (either gene amplification or overexpression) and thus suitable candidates for anti-HER2 therapy,5–7 further research is warranted to increase the population of gastric cancer patients for which targeted treatments are clinical options.
Reflecting this urgency, several other targeted therapies are currently undergoing preclinical and clinical testing in gastric cancer, directed against diverse oncogenic proteins including signalling receptors, histone deacetylases and cellular proteins.8–10 However, because most of these targeted therapies were originally designed against proteins expressed or discovered in other cancers (eg, trastuzumab for breast cancer), in many cases surprisingly little is actually known either regarding the true prevalence of their oncogenic targets in primary gastric cancers, or if expression of these oncogenic targets is correlated with key clinico-pathological parameters such as patient outcome. As one example, the FGFR2 receptor tyrosine kinase (RTK) has previously been proposed as a potential therapeutic target in gastric cancer.11 However, most FGFR2-related studies in gastric cancer have been primarily restricted to in-vitro cultured cell lines,12 13 and little data is available regarding the true prevalence of FGFR2 gene amplification in primary gastric cancers particularly at the high-resolution genomic level. As such, a comprehensive and unbiased survey to identify the most prevalent molecular targets in gastric cancer could facilitate many aspects of gastric cancer translational research, for example, in focusing clinical trials efforts on those therapies that might benefit the greatest numbers of gastric cancer patients.
Besides identifying the most prevalent targets, recent findings have also highlighted the importance of determining if certain combinations of targets are expressed either independently from one another (ie, mutual exclusivity) or co-occurring in the same tumour. Knowledge of such ‘inter-target relationships’ (ITR) can shed critical insights into the signalling networks of a cancer cell, case examples being the mutual exclusivity of KRAS and BRAF activating mutations in colorectal cancer, and the exclusivity of EGFR and KRAS mutations in lung cancer.14 15 Identifying ITR may also highlight promising drug combinations for combination therapy, and suggest rational molecular criteria for patient inclusion and exclusion in clinical trials. Recent studies exemplifying both the basic and clinical importance of ITR include ERBB2 and PIK3CA, in which co-occurring PIK3CA mutations in ERBB2-positive breast cancers can modulate clinical responses to trastuzumab,16 and EGFR and MET, in which clinical resistance to gefitinib in EGFR-mutated lung cancers can be caused by co-existing MET gene amplifications.17
In this study, we sought to identify the most prevalent molecular targets in gastric cancer and to elucidate their ITR. To achieve this aim, we performed, to our knowledge, the largest and most comprehensive survey of genomic copy number alterations in gastric cancer to date, profiling more than 230 gastric cancers (>190 primary tumours and 40 cell lines) on high resolution single nucleotide polymorphism (SNP) arrays containing over 1 million array probes.
Materials and methods
Patient samples were obtained from institutional tissue repositories of the participating centres. Primary gastric tumours were collected with approvals from the respective institutional research ethics review committees and with signed patient informed consent. ‘Normal’ (ie, non-malignant) samples used in this study refer to samples harvested from the stomach, from sites distant from the tumour and exhibiting no visible evidence of tumour or intestinal metaplasia/dysplasia upon surgical assessment. Clinicopathological information of these patients including age, disease stage, histological subtype, treatment and anatomical location, are included in supplementary table S1 (available online only). Only three patients received neo-adjuvant or preoperative chemotherapy before surgery. Gastric cancer cell lines were obtained from commercial sources (American Type Culture Collection, Japan Health Science Research Resource Bank) or from collaborators (Yonsei Cancer Centre, South Korea). Genomic DNA were extracted from flash-frozen tissues or cell pellets using a Qiagen genomic DNA extraction kit (Qiagen, Hilden, Germany), and profiled on Affymetrix SNP 6.0 arrays (Affymetrix, Santa Clara, California, USA) according to the manufacturer's specifications. The array data have been deposited into the National Centre for Biotechnology Information's Gene Expression Omnibus under accession number GSE31168. Tumour-specific genomic alterations were identified by normalising the primary gastric cancer profiles against the primary matched gastric normal samples. Analyses were performed using the genomic identification of significant targets in cancer (GISTIC) algorithm18 using false discovery rate q-value thresholds of less than 0.25 for broad regions and less than 0.001 for focal regions, similar to those used in previous reports.19–21
Additional details, including methods associated with dimension reduction permutation (DRP), fluorescence in-situ hybridisation (FISH) assays, and functional assays, are presented in the supplementary materials (available online only).
Results
Genomic landscape of Copy Number Alteration (CNA) in gastric cancer
We profiled genomic DNA samples from 193 primary gastric cancers, 98 primary matched gastric normal samples and 40 gastric cancer cell lines on Affymetrix SNP6 microarrays containing approximately 1.8 million probes with a median interprobe spacing of 680 bp. To identify tumour-specific genomic alterations and exclude regions of potential germ line copy number variation, we normalised the gastric cancer profiles against the matched gastric normal samples (see the Methods section and supplementary figure S1 (available online only) for representative profiles). On average, we observed approximately 150 genomic aberrations per gastric cancer, comprising a mixture of broad and focally altered regions. Frequently amplified broad chromosomal regions included 1q, 3q, 5p, 6p, 7pq, 8q, 12pq, 13q, 18pq, 19p, 20pq and 21p (frequencies 9.8–33.7%), and frequently deleted chromosomal regions included 3p, 4pq, 5q, 6q, 8p, 9p, 9q, 11q, 12p, 14q, 16q, 17p, 18p, 18q, 19p 21q and 22q (frequencies 7.8–13.0%) (figure 1A). These results are highly concordant with previous comparative genomic hybridisation (CGH/aCGH) studies of gastric cancer.22–27

Broad and focal genomic alterations in gastric cancer. (A) Large-scale copy number alterations. The diagram shows a CNA plot where chromosomal regions of the 22 autosomes are represented on the y-axis, and genomic identification of significant targets in cancer (GISTIC) computed false discovery rate (FDR) q-values are on the x-axis. Chromosomal deletions are on the left (blue) and amplifications are on the right (red). Significantly altered regions of broad CNA are highlighted at the sides, as blue and red bars (GISTIC q value <0.25). (B) Focal alterations. Genes localised within the peaks of the focally altered regions are specified. Genes in square brackets are genes that lie immediately adjacent to the alteration peak (eg, MYC). Significantly altered focal events (GISTIC q-value <0.001) are highlighted at the sides and summarised in table 1.
Focal genomic alterations highlight 22 potential targets in gastric cancer
We identified 22 focal genomic alterations, defined as narrow regions (typically <100 kb) exhibiting high levels of copy number gain or loss (table 1). Among the amplified genes were several oncogenes previously known to be amplified in gastric cancer, including EGFR, ERBB2/HER2 and CCND1 (figure 1B).6 28 29 Among the focally deleted genes in gastric cancer, we re-identified FHIT, RB1, CDKN2A/B, and WWOX, also previously known to be deleted in gastric cancer.30–34 The re-discovery of these classic oncogenes and tumour suppressor genes supports the accuracy of the SNP6 array data. To validate the array data further, we performed ERBB2 immunohistochemistry on 146 of the 193 cases (see supplementary figure S2, available online only), and confirmed a significant association between ERBB2 copy number gain and ERBB2 protein expression (p<0.01, Fisher's exact test, supplementary table S2, available online only).
Focal regions of CNA regions in gastric cancer
Besides known genes, the analysis also revealed novel genes not previously reported in gastric cancer. These included genomic amplification of the transcription factors GATA6 and KLF5, and somatic deletions in PARK2, PDE4D, CSMD1 and GMDS. Recent data suggest that GATA factors in particular may play an oncogenic role in certain gastrointestinal cancers, for example, GATA6 has been shown to be amplified in pancreatic cancer.35 PARK2 and PDE4D deletions have also recently been observed in glioblastoma and lung adenocarcinomas.19 20 Using immunohistochemistry, we confirmed that one of these novel deleted genes, CSMD1, was downregulated or absent in approximately 40% of primary gastric cancers at the protein level, but was highly expressed in normal gastric epithelium (n=42; supplementary figure S3, available online only).
A network of non-random ITR define relationships between gastric cancer targets
A major goal of our study was to identify non-coincidental ITR between the 22 gastric cancer targets in a systematic, unbiased and statistically rigorous manner. We developed a statistical method called DRP for this purpose. Briefly, DRP identifies non-random ITR between targets by comparing the numbers of tumour samples exhibiting a particular ITR (associations between distinct alterations) against a null distribution of background ITR generated through random permutation. The supplementary information (available online only) provides a detailed description of the DRP method. Compared with other methods such as hierarchical clustering and correlation tests, DRP provides additional sensitivity in identifying ITR, without requiring a priori knowledge of specific gene functions (see supplementary figure S4, available online only).
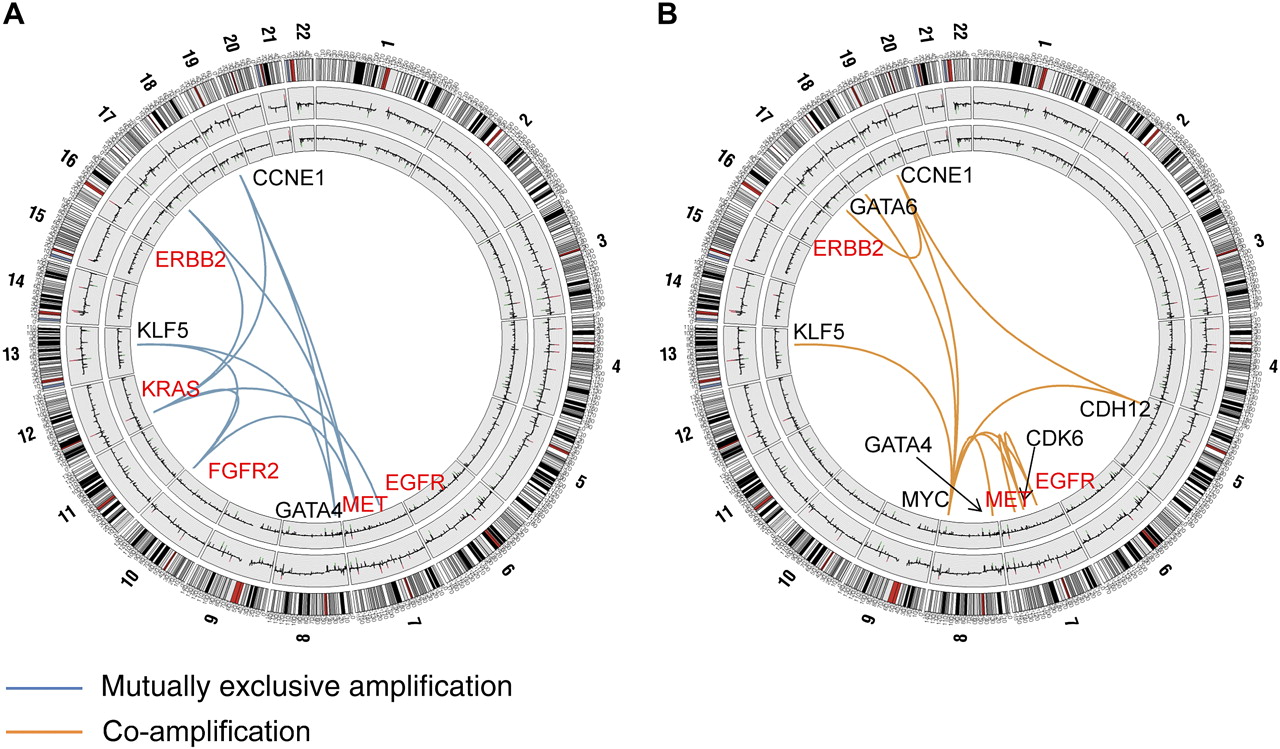
We uncovered several significant ITR associated with the 22 gastric cancer targets. These target pairs were either amplified in a mutually exclusive manner in different tumours, or co-amplified in the same tumour (figure 2 and supplementary table S3, available online only). Functionally, the gastric cancer ITR tended to involve two specific target classes—genes related to RTK/RAS signalling, including KRAS, FGFR2, ERBB2, EGFR and MET, and genes related to transcription factor biology (MYC, GATA4, GATA6 and KLF5). For example, tumours exhibiting KRAS amplifications were largely distinct from tumours exhibiting ERBB2 or FGFR2 amplification (p=0.02 and p=0.005 for KRAS/ERBB2 and KRAS/FGFR2, respectively), while tumours exhibiting MET amplifications were distinct from tumours with FGFR2 amplifications (p=0.03; figure 2A and supplementary table S3, available online only). Likewise, GATA4, GATA6 and KLF5 were significantly co-amplified with MYC (KLF5: p=0.0005; GATA4: p=0.008; GATA6: p=0.01), while KLF5 and GATA4 amplifications were mutually exclusive to one another (p=0.01).

Mutually exclusive and co-amplified genomic alterations. (A) Focal regions exhibiting mutually exclusive patterns of genome amplification. Chromosomal diagrams were created using Circos software.36 Circular tracks from outside to in: genomic positions by chromosomes (black lines are cytobands, red lines are centromeres); summarised CNA values in gastric tumours, summarised CNA values in normal gastric samples. Blue lines indicate pairs of focal regions (genes) exhibiting significant patterns of mutually exclusive genomic amplification identified by dimension reduction permutation (DRP) analysis (p<0.05; EGFR/KRAS, p=0.05). Genes involved in receptor tyrosine kinase (RTK)/RAS signalling are highlighted in red. (B) Focal regions exhibiting patterns of genomic co-amplification. Orange lines indicate pairs of focal regions (genes) exhibiting significant patterns of genomic co-amplification identified by DRP analysis (p<0.05). Genes involved in RTK/RAS signalling are highlighted in red. Supplementary table S3 (available online only) provides a complete list of significant mutually exclusive and co-alteration relationships for amplifications and deletions.
Other notable ITR included a significant co-amplification interaction between EGFR and MYC (p=0.002) and between ERBB2 and CCNE1 (p=0.05) (figure 2B), a co-amplification pattern recently linked to trastuzumab resistance in breast cancer.37 Taken collectively, these results support the existence of a complex functional network of ITR in gastric cancer. They provide evidence that instead of each target behaving independently from one another, the presence of one target in a gastric cancer is likely to exert a profound influence on the repertoire of other targets expressed in that same tumour.
Genomic alterations in RTK signaling genes—frequent, mutually exclusive and associated with patient survival in gastric cancer
Motivated by the clinical success of trastuzumab and the availability of other RTK-targeting drugs in the gastric cancer translational pipeline,38 we decided to characterise the RTK genomic alterations and their impacts on patient outcome. A heat-map representation of the SNP array data confirmed that the four amplified RTK (FGFR2, ERBB2, EGFR and MET) were mutually exclusive to one another (figure 3A). In addition, KRAS genomic amplifications were also mutually exclusive to the other RTK (figure 3A), suggesting these five components may activate the same downstream pathway in gastric cancer (see supplementary figure S5, available online only). The KRAS amplifications are examined in more detail in the next section.

Genomic alterations of receptor tyrosine kinase (RTK)/RAS signalling components in gastric cancer. (A) Mutually exclusive amplification patterns of RTK/RAS signalling components. In the heat-map, each row represents a different RTK/RAS signalling component. Each column represents an individual tumour exhibiting RTK/RAS amplification (72 tumours). The red colour gradient (top right) highlights the degree of copy number amplification. Black arrows highlight two tumours exhibiting high level amplifications in two RTK/RAS components. (B) Overall frequency of RTK/RAS genomic alterations in gastric cancer. The pie chart displays the different gastric cancer subgroups exhibiting RTK/RAS amplification. Gastric cancers exhibiting at least one RTK/RAS amplification event comprise a collective 37% of the gastric cancer cohort analysed. (C) Kaplan–Meier survival analysis comparing outcomes of patients with tumours exhibiting RTK amplification (either FGFR2, ERBB2, EGFR, or MET) amplification to patients with tumours lacking RTK amplification. Patients with tumours exhibiting focal KRAS amplifications were included in analysis, and fall into the RTK low/no CNA group. Overall survival was used as the outcome metric. (D) Kaplan–Meier survival analysis comparing outcomes of patients with tumours exhibiting KRAS amplification (15 patients) to patients with non-RTK/KRAS-amplified tumours. Overall survival was used as the outcome metric. The inset photo displays a patient tumour (ID 49375233) with KRAS amplification confirmed by fluorescence in-situ hybridisation (FISH) analysis (blue, DAPI nuclear stain; green, KRAS FISH probe; red, centromere 12 probe).
Taken collectively, RTK/RAS genomic amplifications occurred in approximately 37% of the entire gastric cancer cohort (figure 3B). The most frequently amplified RTK/RAS component was FGFR2 (9.3%), followed by KRAS (8.8%), EGFR (7.7%) and ERBB2 (7.2%). Of 72 tumours exhibiting amplification in at least one RTK/RAS component, 73.6% (53/72) exhibited amplification of only one component, and 26.4% (19/72) tumours exhibited high level amplification of one component with low level amplification of another. Only two tumours exhibited high level amplification of two RTK/RAS components (black arrows in figure 3A). Taken collectively, these results suggest that 37% of the gastric cancer population is thus potentially targetable by a RTK/RAS-directed therapy.
To assess the prognostic impact of RTK amplifications in gastric cancer, we performed a survival analysis comparing the clinical outcome of patients bearing tumours with RTK amplifications compared with patients with tumours lacking RTK amplification. In a univariate analysis, patients with RTK amplified tumours (FGFR2, ERBB2, EGFR, MET) experienced poor survival outcome compared with patients with RTK amplification-negative cancers (p=0.01, HR 1.636, 95% CI 1.101 to 2.432; figure 3C). Moreover, in multivariate Cox regression models including RTK amplification status, stage, grade and treatment status (surgery alone or 5-FU adjuvant chemoradiation), RTK amplification status was shown to be an independent prognosis predictor (p=0.01, HR 1.966, 95% CI 1.180 to 3.279; see supplementary table S4a, available online only). The adverse prognosis of RTK-amplified gastric cancers was also largely independent of chromosomal instability (p=0.07), indicating that it is not a mere consequence of increased aneuploidy (see supplementary table S4a, available online only).39
To evaluate individual RTK, we performed a follow-up univariate Cox model analysis considering the four different amplified RTK (FGFR2, ERBB2, EGFR and MET) as independent factors. Patients with ERBB2-amplified tumours and MET-amplified tumours were found to exhibit the worst prognosis (ERBB2: p=0.0006, HR 2.824, 95% CI 1.558 to 5.119; MET: p=0.002, HR 2.744, 95% CI 1.190 to 6.327; see supplementary table S4b, available online only). The adverse prognostic impact of ERBB2 amplification was also observed in a multivariate Cox model with adjustment for tumour stage and grade (see supplementary table S4c, available online only).6 7 Therefore, among the four different RTK, ERBB2 amplifications appear to exert the strongest prognostic impact in gastric cancer.
KRAS-genomic amplifications highlight a previously underappreciated gastric cancer subgroup
KRAS amplifications were frequently observed in our series, occurring in 9% of patients. This finding is of interest, because canonical activating mutations in KRAS at codons 12 and 13 are strikingly infrequent in gastric cancer, unlike other gastrointestinal cancers (eg, colorectal and pancreatic cancer).40 41 Confirming these earlier studies,41 the KRAS mutation rate in our own series was extremely low—among 139 gastric cancers genotyped for KRAS codon 12 and 13 mutations, only one tumour exhibited a KRAS mutation (G13D in 069LYk). We thus hypothesised that KRAS genome amplification, rather than mutation, may represent a predominant mechanism for KRAS activation in gastric cancer.
To obtain additional evidence that KRAS genomic amplifications represent a distinct gastric cancer molecular subgroup, we performed a Kaplan–Meier survival analysis comparing outcomes of patients with KRAS-amplified samples versus patients with tumours lacking RTK or KRAS amplification. Patients with KRAS-amplified tumours exhibited significantly poorer prognosis (p=0.01, HR 2.158, 95% CI 1.172 to 3.971; figure 3D). Supporting the robustness of this survival association, similarly significant associations were observed when patients with KRAS-amplified tumours were compared against patients lacking KRAS amplification but irrespective of RTK amplification, or when the copy number threshold defining KRAS amplification was relaxed (p=0.06, HR 1.744, 95% CI 0.973 to 3.127; p=0.01, HR 1.665, 95% CI 1.114 to 2.488; see supplementary figure S6, available online only).
To benchmark the prognostic effect of KRAS amplification against other RTK, we applied a univariate Cox regression model consisting of all five genes. Similar to ERBB2 and MET amplifications, gastric cancer patients with KRAS amplifications also exhibited significantly worse prognosis compared with patients with tumours lacking either RTK or KRAS amplifications (p=0.02, HR 2.116, 95% CI 1.155 to 6.940; see supplementary table S5a, available online only); however, this association may be related to tumour stage (p=0.2, HR 1.455, 95% CI 0.790 to 2.682; see supplementary table S5b, available online only).
Finally, to provide functional evidence that KRAS genomic amplification represents an important ‘driver’ event in KRAS-amplified gastric cancers, we performed genetic knockdown experiments. Small interfering RNA-mediated knockdown of KRAS in KRAS amplified and KRAS-mutated gastric cancer cell lines caused significant reductions in proliferation but not in KRAS wild-type lines, supporting an earlier report41 (see supplementary figure S7, available online only). These results suggest that KRAS amplification in gastric cancer probably defines a specific subgroup of poor prognosis patients for which KRAS signalling in tumours is critical.
FGFR2 amplifications in gastric cancer: relationships to gene expression, clinical outcome and drug sensitivity
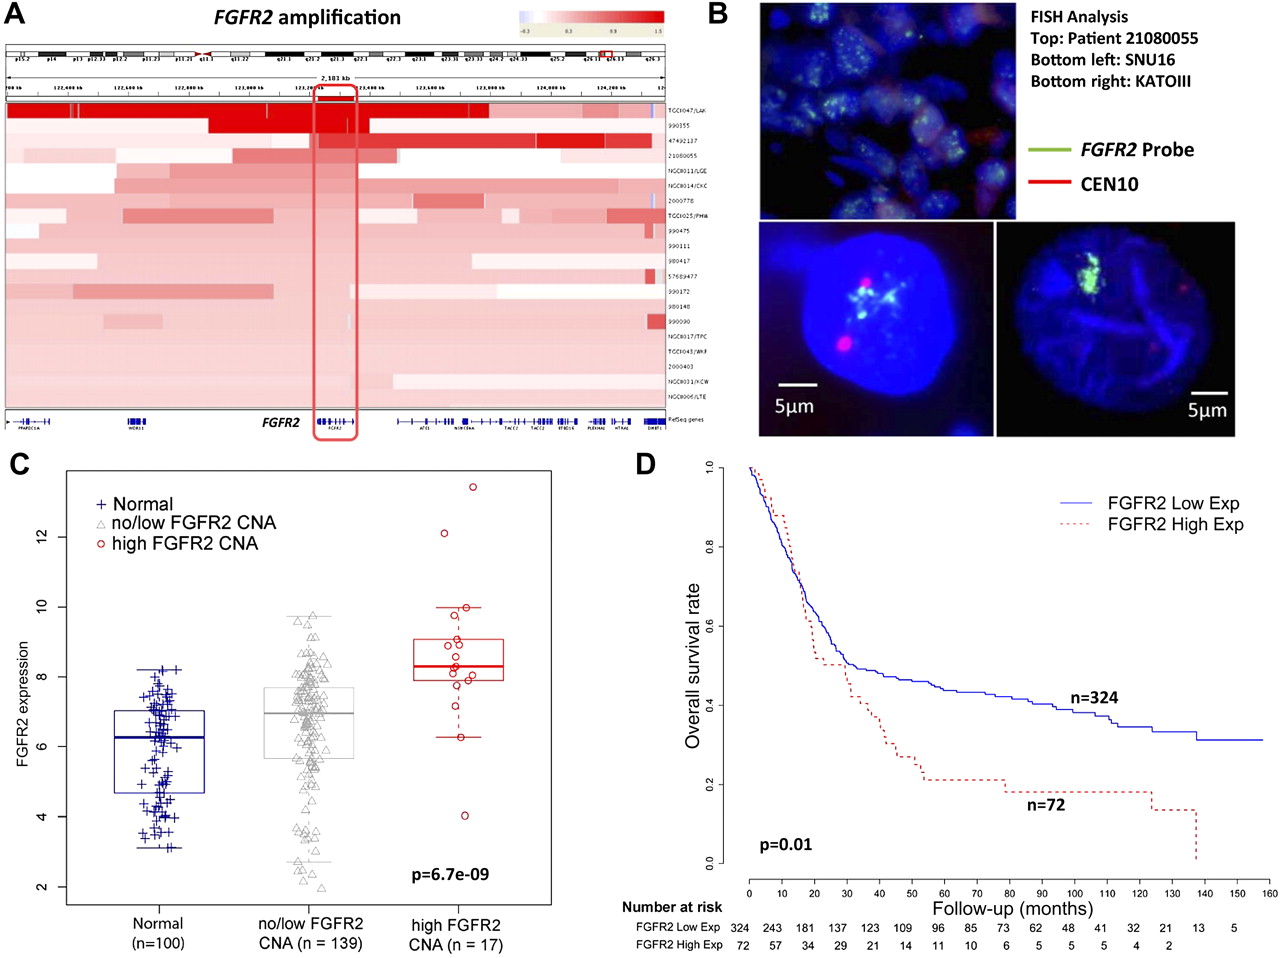
FGFR2 was being amplified in 9–10% of gastric cancers in our series (table 1). Consistent with FGFR2 being the main driver of amplification in this locus, intersection of the amplification regions across 20 FGFR2-amplified tumours confirmed that FGFR2 was the sole gene in this region exhibiting common copy number gain (figure 4A). Validating the SNP data, a quantitative PCR analysis using primers directed towards FGFR2 confirmed that samples with high FGFR2 qPCR values were associated with FGFR2 amplification. (p=0.0006, Fisher's test; see supplementary figure S8, available online only). FISH analysis using BAC probes targeting FGFR2 also confirmed FGFR2 gene amplification in patient tumours and cell lines, relative to a centromere 10 probe (figure 4B).

FGFR2 gene amplification and messenger RNA expression in gastric cancer. (A) Heat-map showing the FGFR2 gene amplification region in individual gastric cancer samples (20 tumours). Each row indicates one gastric cancer sample with the amplified region in red. Intensity of the red bar indicates the level of copy number amplification. Genes located in this region are shown at the bottom. The intersection of these amplified regions covers only the FGFR2 gene (red box, gene outlined at bottom). (B) FGFR2 genomic amplification confirmed by fluorescence in-situ hybridisation (FISH). The photo displays a patient tumour (ID 21080055) with FGFR2 amplification and two FGFR2-amplified cell lines KATO-III and SNU16 confirmed by FISH analysis. Green signals indicate the FGFR2 FISH probe, red signals probes to centremore 10. (C) FGFR2 gene expression in clinical specimens. FGFR2 gene expression was compared across three categories, each represented by a box-plot: non-malignant gastric tissues (normal) (n=100); tumours exhibiting no/low FGFR2 CNA (n=139); and tumours exhibiting high FGFR2 CNA (n=17). mRNA comparisons were based on 156 gastric cancers in which gene expression data were available, representing a subset of the 193 gastric cancers analysed by single nucleotide polymorphism arrays. FGFR2 gene expression was inferred from Affymetrix microarrays (FGFR2 probe 211401_s_at). FGFR2 mRNA levels are significantly higher in samples with FGFR2 high CNA compared with the other two categories (p=6.7e-9, Kruskal–Wallis test). Tumours exhibiting FGFR2 amplification exhibit significantly increased FGFR2 gene expression compared with tumours exhibiting no/low FGFR2 CNA or non-malignant samples (p=1.9e-5 and 1.7e-7, Wilcoxon test). (D) Kaplan–Meier survival analysis comparing patients with tumours exhibiting high FGFR2 gene expression, defined as twofold higher than the average FGFR2 gene expression level in normal samples (72 tumours), with patients with tumours exhibiting low FGFR2 gene expression (total 398 patients, the 156 patients analysed in figure 4C are a subset of these 398 patients). Overall survival was used as the outcome metric.
FGFR2 has previously been proposed as a potential therapeutic target in gastric cancer,38 but little is known regarding the impact of FGFR2 amplification on gene expression and other clinicopathological parameters. To investigate relationships between FGFR2 gene amplification and FGFR2 gene expression, we analysed gene expression profile data for 156 of the 193 gastric cancers analysed by SNP arrays in this study, which we have described in an earlier report.42 FGFR2-amplified gastric cancers indeed exhibited significantly increased FGFR2 gene expression levels (figure 4C and supplementary figure S9, available online only), when compared against a reference set of 100 normal gastric samples, or non-FGFR2-amplified tumours (Kruskal–Wallis test p=6.7e-9, Wilcoxon test p=1.7e-7 (vs normal) and p=1.9e-5 (vs non-FGFR2-amplified gastric cancers). In comparison, ATE1 and BRWD2, two genes located adjacent to FGFR2 exhibited less significant levels of copy number/gene expression correlation (p=0.004–0.3, relative to normals; supplementary figure S10, available online only), further supporting FGFR2 as the major driver gene in this region.
Examining clinicopathological variables, FGFR2-amplified gastric cancers did not exhibit any significant associations with histology (Lauren's p=0.8, grade p=0.8 or tumour stage p=0.9) or patient survival (p=0.8, see supplementary table S4b, available online only). However, in an expanded gene expression dataset of 398 gastric tumours derived from four distinct cohorts of which the previous 156 gastric cancers form a subset (see supplementary information and supplementary table S6, available online only), high FGFR2 expression (compared with normals, supplementary figure S11, available online only) was associated with poor survival outcome in a univariate analysis (p=0.01, HR 1.492, 95% CI 1.094 to 2.035; figure 4D). In a multivariate Cox regression model, samples with FGFR2 high expression tended to exhibit borderline significance after adjusting for stage and grade (p=0.08, HR 1.321, 95% CI 0.966 to 1.807; see supplementary table S7, available online only). This result suggests that FGFR2 overexpression in gastric cancer may be of prognostic relevance.
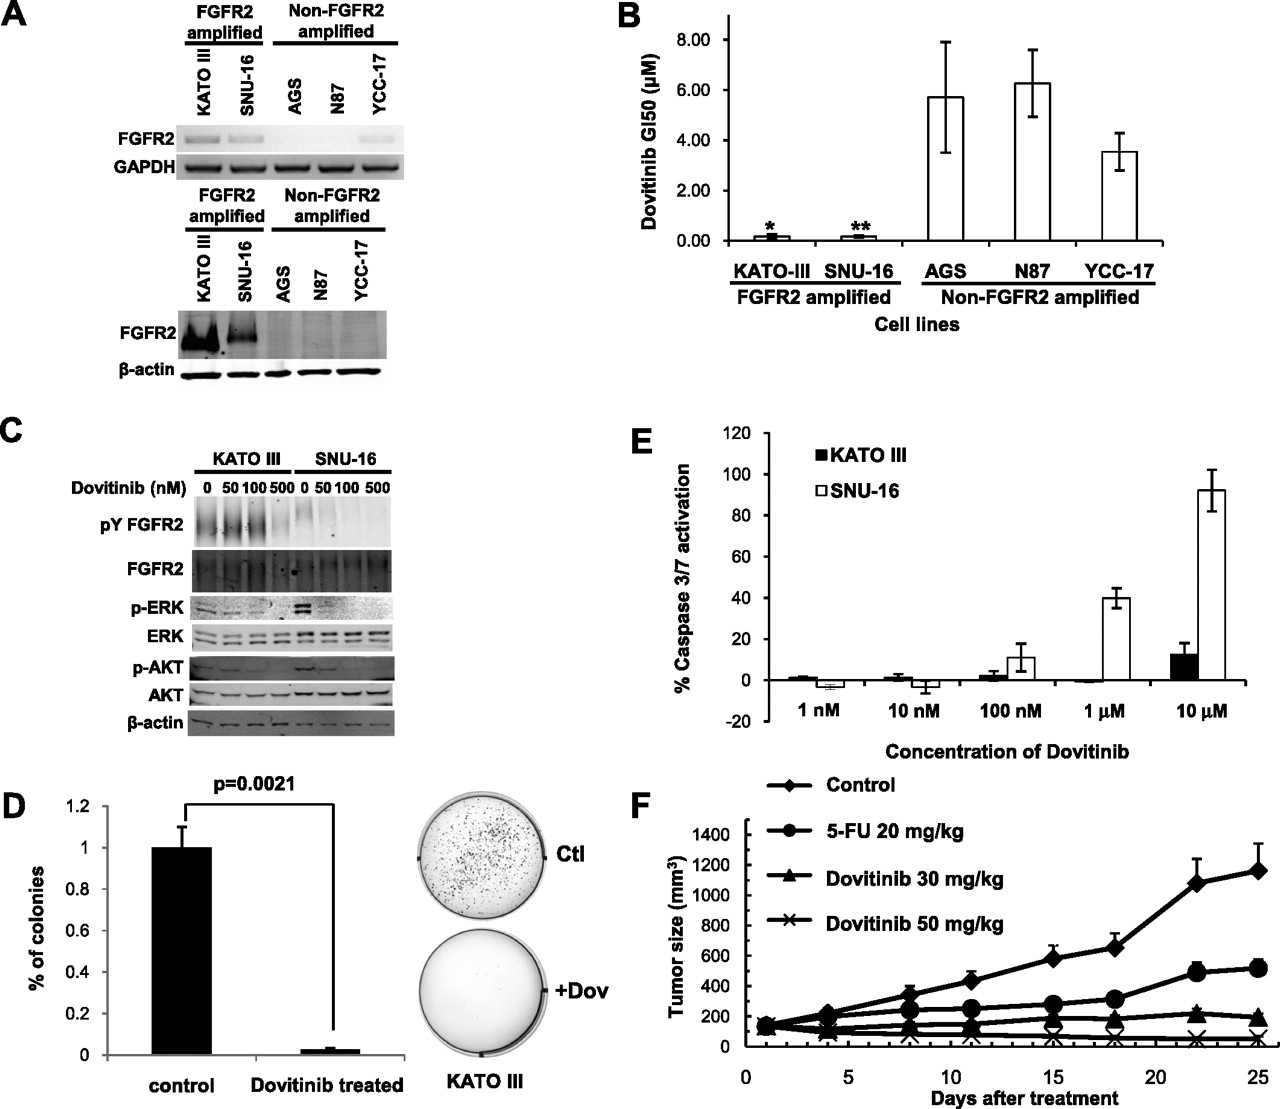
Dovitinib (TKI258) is an investigational multitargeting oral tyrosine kinase inhibitor with potent inhibitory activity against bFGF receptors 1, 2, 3, VEGF receptors 1, 2, 3, PDGFR and c-KIT.43 44 In preclinical models, dovitinib has exhibited anti-tumour activity in FGFR1-amplified breast cancer,45 and in several phase I clinical trials has shown good therapeutic profiles in human patients.46 47 To test the potential efficacy of dovitinib in FGFR2-amplified gastric cancer, we treated FGFR2-amplified and non-amplified gastric cancer lines (figure 5A) with increasing dosages of dovitinib, to determine the GI50 concentration (the drug concentration required to cause 50% growth inhibition). We observed potent growth inhibitory activity of dovitinib specifically in FGFR2-amplified gastric cancer cell lines with GI50 dosages in the submicromolar range (KATO-III 0.12 μM; SNU-16 0.17 μM, figure 5B). Decreased phosphorylation of FGFR2, ERK and AKT was also observed after 1 h of dovitinib treatment (figure 5C). Besides inhibiting cell proliferation, dovitinib treatment also induced a significant decrease in soft-agar colony formation in FGFR2-amplified lines (KATO III p=0.002; SNU16 p=0.05; figure 5D and supplementary figure S12, available online only). In a cell death assay, dovitinib treatment induced apoptosis, measured by caspase 3/7 activation, in SNU-16 cells after 24 h of treatment, but not in KATO III cells (figure 5E). These results suggest that dovitinib treatment can inhibit several pro-oncogenic traits in FGFR2-amplified lines, but additional factors may be required for FGFR2-amplified cells to undergo apoptosis upon dovitinib treatment.
Sensitivity of FGFR2-amplified gastric cancer cell lines to dovitinib. (A) (Top) FGFR2 reverse transcription PCR analysis of gastric cancer cell lines. Glyceraldehyde-3-phosphate dehydrogenase (GAPDH) was used as a loading control. (Bottom) FGFR2 protein expression in lines. β-actin was used as a loading control. Cell lines KATOIII and SNU16 are observed to express elevated levels of FGFR2 mRNA and protein. (B) Cell proliferation effects of dovitinib treatment. Dovitinib GI50 values for FGFR2-amplified and non-amplified cell lines. GI50, drug concentration required to cause 50% growth inhibition. GI50 values were calculated after 48 h dovitinib treatment. *p<0.05 compared with non-amplified lines. Results are a mean of three independent experiments. (C) Molecular effects of dovitinib treatment. Cells treated with dovitinib at 50 nM, 100 nM and 500 nM concentrations for 1 h. Lysates were immunoprecipitated with FGFR2 anitbody MAB6841, and probed with 4G10 (phosphotyrosine detection) or MAB6841 for total FGFR2. Other antibodies included total and phospho-ERK, and total and phospho-AKT. Experiments were repeated a minimum of three independent times. (D) Dovitinib inhibits soft agar colony formation. FGFR2-amplified cells were treated with dovitinib at the GI50 concentration for each cell line (KATO-III 0.12 μM; SNU-16 0.17 μM) for 48 h, and soft-agar colony formation monitored over the subsequent 3–4 weeks. Data for KATO-III cells are provided, including representative colony plates. Similar results were observed for SNU16 (see supplementary figure S9, available online only). (E) Dovitinib induces caspase-3 activation. FGFR2-amplified cells were treated with increasing dovitinib concentrations, and apoptosis levels measured after 24 h using Caspase-Glo 3/7 assays. The y-axis represents the percentage of activation normalised against untreated controls. The results are a mean of triplicates ±SD. Experiments were repeated three independent times. (F) Dovitinib inhibits tumour growth in a human primary gastric cancer xenograft model bearing FGFR2 gene amplification. The mean tumour size of the vehicle-treated mice reached 1163 mm3 at day 25 post-treatment. Treatment with the positive control drug 5-FU at 20 mg/kg (qd × 5/week ×2 weeks, intraperitoneally) produced a mean tumour size of 518 mm3 (total growth inhibition 63%, p=0.08) at the same time. Treatment with dovitinib at 30 mg/kg and 50 mg/kg (qd ×25 days, by mouth) significantly inhibited tumour growth compared with vehicle-treated animals, with a mean tumour size of 194 and 53 mm3, respectively (p=0.006 and 0.002, respectively, at day 25 post-treatment).
To evaluate the efficacy of dovitinib in an in-vivo model, we performed drug treatment experiments using an FGFR2-amplified primary human gastric cancer xenograft model, comparing dovitinib responses with the positive control drug 5-FU. Mean tumour sizes of vehicle-treated mice reached 1163 mm3 at day 25 post-treatment, while treatment with 5-FU at 20 mg/kg (qd × 5/week × 2 weeks, intraperitoneally) produced a reduced mean tumour size of 518 mm3 (total growth inhibition 63%, p=0.08) after the same period. Importantly, treatment with dovitinib at 30 mg/kg and 50 mg/kg (qd × 25 days, by mouth) significantly inhibited tumour growth compared with vehicle-treated tumours (p=0.006 and 0.002, respectively), with final tumour sizes of 194 and 53 mm3, respectively, at day 25 post-treatment (figure 5F). Dovitinib may thus represent a promising subtype-specific therapy for FGFR2-amplified gastric cancers.
Discussion
Here we report a high-resolution genomic analysis of a large cohort of gastric cancer primary tumours and cell lines delineating the most prevalent molecular targets in this disease. While earlier reports analysing gastric cancer copy number alterations have largely analysed small patient populations or used low-resolution technologies (eg, chromosomal CGH),22–26 these earlier studies were invaluable in benchmarking the reproducibility of our own data. For example, in a recent copy number analysis of 49 gastric cancers using Agilent 44k arrays,27 concordant regions commonly identified in that study and ours include the frequent broad amplifications of chromosome 8 and 20, losses of chromosome 16 and amplified genes such as ERBB2, EGFR, GATA4, MYC, KRAS and CCNE1. However, reflecting the increased size (193 vs 49) and resolution (44 K vs 1.8 million SNP probes) of our study, we also detected amplifications of chromosome 18 and deletions of chromosome 6q, which were not detected in earlier work.22–27
Using GISTIC, we identified 22 recurrently altered regions in gastric cancer that are likely to represent the most prevalent molecular targets. For several of these targets, we further confirmed the SNP array results using a variety of orthogonal methodologies, including immunohistochemistry, FISH and qPCR. A survey of genes in the 22 altered regions revealed that they could be broadly partitioned into three major functional categories: RTK/RAS signalling (FGFR2, KRAS, ERBB2, EGFR, MET); transcriptional regulation (MYC, GATA4, GATA6, KLF5) and cell cycle control (CCND1, CCNE1, CDK6, CDKN2A/B, RB). As expected, many of these genes were already known to be associated with genomic alterations in gastric cancer.6 11 28 29 Critically, however, our analysis also identified several novel genes not previously known to be amplified or deleted in gastric cancer. For example, we observed for the first time frequent deletions of PARK2, a E3 ubiquitin ligase, in gastric cancer.48 Mutations in PARK2 have been associated with early-onset Parkinson's disease,49 and more recently PARK2 mutations and deletions have been observed in other cancers.50 Another novel altered gastric cancer gene was CSMD1, a gene of uncertain function but that has been proposed as a tumour suppressor in breast cancer.51 Using immunohistochemistry, we confirmed that up to 40% of gastric cancers can exhibit CSMD1 protein loss or reduced expression. Addressing the functions of these novel altered genes, given their frequency of alteration in gastric cancer, will probably be an important goal of future research work. In addition, our study also highlights interesting therapeutic opportunities—for example, the cyclin-dependent kinase CDK6 was frequently amplified in our series, and small molecule-targeted inhibitors of CDK have been developed.52
A notable finding in this study was that GATA4, GATA6 and KLF5 are frequently amplified in gastric cancer. Notably, GATA4 amplifications in gastric cancer have also been observed by other groups.53 Intriguingly, when compared against genes identified as amplified in other comparable copy number studies from glioblastoma, lung cancer and multiple cancer types,19–21 it appears that amplification of these three genes appears to be restricted to either gastric cancer or to other cancers related to gastrointestinal tract origin. It is possible that these genes may represent ‘lineage-specific’ oncogenes, a recently described class of cancer genes that enhance oncogenesis by reactivating lineage-specific survival mechanisms normally operative only in early embryonic development.54 Examples of lineage survival oncogenes include MITF in melanoma, TITF1/NKX2.1 in lung cancer55 56 and SOX2 in oesophageal and lung cancers.57 Indeed, GATA6 has recently been proposed to function as an amplified lineage-survival oncogene in pancreatic cancer,35 58 and KLF5 has been shown to be expressed during early development in the cardiovascular system and gastrointestinal tract epithelium in the proliferating zone of intestinal crypts.59 60 These transcription factors may reflect the existence of an underlying transcriptional regulatory programme important for the maintenance of the gastric cancer phenotype. Interestingly, a recent genomic study from our group reported the discovery of two gastric cancer subtypes (G-INT and G-DIF) with distinct gene expression, clinical outcome and chemotherapy response features.61 We have since discovered that G-DIF gastric cancers appear to be significantly enriched in GATA6 gene amplifications (Fisher's exact test, p=0.04), suggesting that GATA6 may be associated with a specific molecular subtype of gastric cancer. From a therapeutic perspective, transcription factors are commonly regarded as ‘undruggable’. It is possible, however, that some of these transcription factors may regulate the expression of key genes that are pharmacologically targetable. For example, BCL2 has been described as a target of the MITF transcription factor frequently amplified in melanoma,62 and BCL2 inhibitor drugs are available. Such a strategy may represent one method to target amplified transcription factors indirectly.
Of major clinical significance was the observation that genes related to RTK/RAS signalling are frequently altered and mutually exclusive to one another in gastric cancer. First, because numerous targeted inhibitors directed against various components of the RTK/RAS pathway are already in clinical testing,4 9 these results raise the possibility that a substantial proportion (37% of gastric cancers) may be potentially targetable by a RTK/RAS-directed therapy. In essence, this finding dramatically increases the population of gastric cancer patients for which targeted treatments could be considered. Second, the mutually exclusive nature of these RTK/RAS alterations strongly suggests that the majority of gastric cancers are likely to have only a single RTK/RAS driver oncogene, thereby greatly simplifying the challenge of defining which RTK/RAS targeted inhibitor compound to allocate to which patient population. In terms of clinical trials, the mutually exclusive nature of the RTK/RAS alterations also renders it technically feasible to implement a multibiomarker-based trial,63 in which multiple targeted compounds are tested in different biomarker-defined populations within a single trial design, as has been recently described for non-small-cell lung cancer (BATTLE trial).64 Third, these results suggest that a much larger proportions of gastric cancers may be reliant on RTK/RAS signalling than previously appreciated, particularly if one notes that in this study alternative mechanisms of RTK/RAS activation were not considered, and for certain gastric cancers the presence of non-malignant cells may have reduced the sensitivity of RTK/RAS alteration detection. For example, in a recent kinome sequencing study, kinases related to MAPK signalling, a pathway downstream of KRAS, were identified as being the most significantly altered in gastric cancer.65 Another alternative mechanism of RTK/RAS activation may also involve gene fusions, in which we recently described RAF-related gene rearrangements in gastric cancer.66 Taken collectively, we believe that our finding that 37% of gastric cancers exhibit a RTK/RAS alteration should best be regarded as a lower limit, and are consistent with the notion that RTK/RAS signalling is a dominant oncogenic pathway in gastric cancer.
In our series, FGFR2 was amplified at frequencies comparable to ERBB2, providing one of the first assessments of FGFR2 gene amplification in primary gastric cancers. Interestingly, the smallest common peak of FGFR2 amplification in the gastric cancers appears to centre around a 1.5 kb region in FGFR2 intron 2, which overlaps a SNP locus associated with breast cancer susceptibility.67 It is intriguing to consider whether the process of genomic amplification might also bias the expression of the FGFR2 gene towards transcript isoforms (IIIc) that are pro-oncogenic.68 We also found that in preclinical assays, dovitnib, a VEGFR/FGFR2 inhibitor, can potently inhibit the growth of FGFR2-amplified gastric cancer cell lines and xenografts. In breast cancer, dovitinib has been found to exert effects primarily in FGFR1-amplified breast cancers, suggesting the importance of FGFR-related genome amplification in predicting dovitinib response.69 FGFR2 is thus likely to represent an attractive therapeutic target in gastric cancer. However, one question not addressed by our data is whether gastric cancers that lack FGFR2 amplification, but nevertheless express FGFR2, will also be dovitnib responsive, as we also observed that a significant number of FGFR2 copy-neutral tumours also exhibited elevated FGFR2 expression levels relative to matched normal tissues, indicating that other mechanisms besides gene amplification can also cause FGFR2 upregulation in tumours. Notably, a recent study showed that FGFR2 inhibition can potentially reverse chemoresistance in OCUM-2M gastric cancer cells, which are also FGFR2 copy-number amplified.70 We are currently addressing these questions by conducting a biopsy-mandated phase I/II trial at our centre, evaluating the efficacy of dovitinib in FGFR2-amplified and FGFR2-expressing gastric cancer samples.
Finally, our results highlight KRAS amplification (rather than KRAS mutation) as a prevalent event in gastric cancer. While KRAS amplifications have been reported in other cancers (eg, lung),71 these observations have been largely anecdotal, with emphasis directed towards more conventional codon 12 and 13 activating mutations. Consistent with KRAS activating as an important driver gene in amplified samples, patients in our series with KRAS-amplified gastric cancers exhibited poor prognosis, and in vitro, KRAS-amplified gastric cancer lines were sensitive to KRAS silencing, similar to KRAS mutated lines. The high frequency of KRAS amplifications in gastric cancer is probably a major reason why KRAS activating mutations are strikingly infrequent in gastric cancer.41 However, the exact mechanisms underlying this striking tissue-specific preference for KRAS amplification remain to be elucidated. Nevertheless, given recent data demonstrating that KRAS-mutated colon cancers are resistant to anti-EGFR therapies,72 and that KRAS-amplified tumours may be resistant to MEK1/2 inhibitors,73 our findings strongly suggest that testing KRAS amplification status in tumours should be fully considered in any trials evaluating RTK-targeting compounds in gastric cancer.
In conclusion, our results provide for the first time a detailed molecular map of genomic alterations in gastric cancer, which has revealed several promising targets for subtype-specific therapies. Classifying gastric cancer patients by these signature genomic alterations may facilitate patient allocations to the most appropriate clinical trials, thereby maximising patient participation in combatting this lethal disease.
References
Supplementary materials
Supplementary Data
This web only file has been produced by the BMJ Publishing Group from an electronic file supplied by the author(s) and has not been edited for content.
Files in this Data Supplement:
- Download Supplementary Data (PDF) - Manuscript file of format pdf
Footnotes
See Commentary, p 638
Accession number in NCBI GEO database: GSE31168.
Funding This study was supported by NMRC grants TCR/001/2007, BMRC 10/1/24/19/655, BMRC-NMRC 10/1/33/19/676 and core grants from Duke-National University of Singapore and the Cancer Sciences Institute of Singapore to PT. This work was also supported by an ASCO grant to IBT, a Singhealth talent development grant to IBT and Priscilla Ng and a Khoo discovery award (KDP/2008/0002 and KDP/2009/0006) to LKG.
Competing interests MMS and RL are employees of Novartis Pharmaceuticals Corporation. All other authors declare that they have no competing interests.
Patient consent Obtained.
Ethics approval Ethics approval was provided by the Institutional Research Ethics Review Committees of Singapore Health Services and the National University Hospital System.
Provenance and peer review Not commissioned; externally peer reviewed.