Article Text

Abstract
Objective Ulcerative colitis (UC) is a chronic condition characterised by the relapsing inflammation despite previous endoscopic and histological healing. Our objective was to identify the molecular signature associated with UC remission.
Design We performed whole-genome transcriptional analysis of colonic biopsies from patients with histologically active and inactive UC, and non-inflammatory bowel disease (non-IBD) controls. Real-time reverse transcriptase-PCR and immunostaining were used for validating selected genes in independent cohorts of patients.
Results Microarray analysis (n=43) demonstrates that UC patients in remission present an intestinal transcriptional signature that significantly differs from that of non-IBD controls and active patients. Fifty-four selected genes were validated in an independent cohort of patients (n=30). Twenty-nine of these genes were significantly regulated in UC-in-remission subjects compared with non-IBD controls, including a large number of epithelial cell-expressed genes such as REG4, S100P, SERPINB5, SLC16A1, DEFB1, AQP3 and AQP8, which modulate epithelial cell growth, sensitivity to apoptosis and immune function. Expression of inflammation-related genes such as REG1A and IL8 returned to control levels during remission. REG4, S100P, SERPINB5 and REG1A protein expression was confirmed by immunohistochemistry (n=23).
Conclusions Analysis of the gene signature associated with remission allowed us to unravel pathways permanently deregulated in UC despite histological recovery. Given the strong link between the regulation of some of these genes and the growth and dissemination of gastrointestinal cancers, we believe their aberrant expression in UC may provide a mechanism for epithelial hyper-proliferation and, in the context of malignant transformation, for tumour growth.
- Ulcerative Colitis
- Gene Expression
- Epithelial Cells
Statistics from Altmetric.com
Summary box
What is already known about this subject?
-
In ulcerative colitis (UC), periods of active disease are followed by endoscopic remission and healing of the involved mucosa.
-
The involved intestinal mucosa of UC patients in remission shows persistent histological changes suggesting that the composition and architecture of the recovered intestine is permanently altered even after inflammation has resolved.
-
Patients with UC have an increased risk of developing complications such as colorectal cancer (CRC), fibrosis and loss of intestinal function, and this risk increases over time.
What are the new findings?
-
We identify a new transcriptional signature associated with the involved mucosa of UC patients in remission that is significantly different from that of uninvolved or non-inflammatory bowel disease mucosa.
-
About half of the genes that are significantly regulated in UC active mucosa remain altered during remission despite endoscopic and histological healing. These genes participate in biological functions such as cellular growth, movement, assembly and organisation, as well as in fatty acid and protein metabolism.
-
Among the genes that remain deregulated during remission, we identify several that are expressed by epithelial cells and are involved in epithelial cell proliferation, resistance to apoptosis and response to stress. These genes have been previously shown to be deregulated in the neoplastic epithelium, suggesting a potential contribution to CRC development in the context of UC.
How might it impact on clinical practice in the foreseeable future?
-
By comparing active UC patients with UC patients in remission, we can distinguish between genes whose expression pattern depends on disease activity, and those that remain altered in spite of remission. The former could serve as potential targets and be used as objective biomarkers of mucosal inflammation.
-
The signature associated with the remitting intestine may include early biomarkers of malignant transformation in UC patients, and potential targets for halting the progression to CRC.
Introduction
Ulcerative colitis (UC) is an idiopathic chronic disease of the colon characterised by periods of active disease followed by periods of remission. Epidemiological studies in UC have reported that over 90% of patients have active disease during the first year following diagnosis and in subsequent years, approximately 50% will have active disease or will have undergone colectomy.1
Preventing disease relapse, achieving mucosal healing and avoiding complications are the major goals in the management of patients with UC. Mucosal healing or endoscopic remission is associated with better long-term clinical outcomes in UC.2 However, even in the absence of endoscopic or microscopic signs of active inflammation, the involved intestinal mucosa of UC patients in remission shows histological changes. These include glandular deformity, branching of crypts, thickened muscularis mucosa, Paneth cell metaplasia, neuroendocrine cell hyperplasia and/or fat in the lamina propria, suggesting that the composition and architecture of the recovered intestine is permanently altered even after inflammation has resolved.3
UC is associated with a higher risk of developing dysplasia and colorectal cancer (CRC),4 ,5 with disease duration being the strongest risk factor. The histological severity of inflammation has been linked to increased cancer risk, but patients with long-standing remission also have an increased risk of developing neoplastic lesions.6
While several studies have used genome-wide gene expression approaches to understand the mechanisms of active inflammation,7–12 fewer studies, typically relying on a small number of patients, have explored the molecular events that occur during remission.9 ,13 ,14
The primary objective of our investigation was to reveal the molecular events that take place during disease quiescence. To this end, we studied the transcriptional signature of the involved intestinal mucosa of UC patients in clinical, endoscopic and histological remission, and compared it with that of the actively inflamed or healthy non-inflammatory bowel disease (non-IBD) mucosa. Studying the molecular alterations in the intestinal mucosa that persist during disease remission may help identify relevant biomarkers of remission and provide a better understanding of the mechanisms leading to long-term disease complications such as dysplasia and CRC.
Materials and methods
More detailed information is described in the online supplementary methods.
Patient population
Patients with an established diagnosis of UC and non-IBD controls were included in the study after obtaining written informed consent. Non-IBD controls were those subjects undergoing colonoscopy for mild gastrointestinal symptoms or a screening for CRC, and who presented no lesions during examination. Inclusion criteria for UC patients were: age between 18 and 65 years, and diagnosis of UC at least 6 months before inclusion according to the established criteria.15 Patients with concomitant infections were excluded.
A total of 89 subjects, divided into three independent cohorts, were included in the study. Clinical and demographic characteristics of the subjects are shown in table 1.
Clinical and demographic characteristics of patients included in the study
Assessment of disease activity
Clinical and histological disease activity was assessed using the total Mayo score,16 and the Matts score,17 respectively. A total Mayo score greater than or equal to 4 with at least one point in the bleeding sub-score and two points in the endoscopic sub-score, together with a histological score greater than or equal to 3 in any colonic segment, was defined as active disease. Inactive disease was defined as a Mayo score less than 4, an endoscopic sub-score of 0 and a histological score less than or equal to 2. All inactive patients had been in remission for at least 5 months before and after biopsy collection. Uninvolved mucosa of UC patients was defined as a colonic segment with a completely normal endoscopic appearance, normal histology and the absence of any evidence of previous disease activity.
Biopsy collection
Intestinal biopsies were collected from the sigmoid colon or rectum of non-IBD controls, UC patients with quiescent disease (involved mucosa segments; UC remission) and UC patients with active disease (UC active involved). In patients with active disease, additional samples were obtained from uninvolved proximal segments whenever possible (UC active uninvolved). Biopsies were taken during routine colonoscopies, placed in RNA later RNA Stabilisation Reagent (Qiagen) and stored at −80°C. None of the biopsies showed evidence of colitis-associated dysplasia or neoplasia.
RNA Isolation
Total RNA from biopsies in cohorts 1 and 2 was extracted using a Rneasy Kit (Qiagen, Spain) according to the manufacturer's instructions. Purity and integrity of the total RNA were assessed with the 2100 Bioanalyzer (Agilent, Germany) and then quantified by NanoDrop spectrophotometer (Nanodrop Technologies, USA); only samples with an RNA integrity number (RIN) greater than 7.0 were used.
Microarray
The derived cRNA from cohort 1 biopsies was hybridised to high-density oligonucleotide Affymetrix GeneChip Human Genome U133 Plus 2.0 Arrays (Affymetrix, USA) and raw data was analysed using Bioconductor tools in R (V.2.15.0). Pathway analysis using Ingenuity Pathways Analysis (IPA; Ingenuity Systems) was performed for those genes found to be significantly deregulated.
Microarrays raw data (.cel files) and processed data have been deposited in NCBI's Gene Expression Omnibus and are accessible through GEO Series accession number GSE38713 (http://www.ncbi.nlm.nih.gov/geo/query/acc.cgi?acc=GSE38713).
Quantitative real-time reverse transcriptase PCR (RT-PCR)
To validate the microarray data, we performed real-time RT-PCR analysis for a selected set of 54 target genes and 9 endogenous controls (see online supplementary table S1) from an independent cohort of 30 individuals (cohort 2) using custom designed TaqMan Low Density Arrays (TLDA platform, Applied Biosystems by Life Technologies, USA).
Microarray and real-time RT-PCR data correlation was assessed in a subset of 15 biopsies specimens obtained for microarray analysis (cohort 1) that was also analysed by real-time RT-PCR (7 UC remission, 4 UC active involved and 4 UC active uninvolved). We used Pearson's product moment correlation to test for any associations between paired data.
Immunostaining of intestinal samples
Using commercially available antibodies and the immunoperoxidase detection system, we determined the expression of REG4, REG1A, S100P and SERPINB5 (MASPIN) in paraffin-embedded sections from mucosa colonic biopsies obtained during endoscopies (cohort 3). Two blinded observers (NP and RMB) quantified the intensity of staining for all proteins analysed using a qualitative score ranging from 0 to 2 (0=negative stain, 1=mild stain, 2=strong stain). Statistical significance between groups was determined using Fisher's exact test.
Immunofluorescence staining was performed to confirm epithelial localisation of REG4, REG1A, S100P and SERPINB5 (MASPIN) in a subset of representative patients that were included in cohort 3. Epithelial cells were stained with an anti-EpCAM antibody.
Ethical considerations
The study was approved by the Institutional Ethics Committee of the Hospital Clinic of Barcelona (Spain) on March 2006 and was performed in accordance with the principles stated in the Declaration of Helsinki (updated October 1996).
Results
The intestinal mucosa of UC in histological remission is transcriptionally different from that of healthy or inflamed mucosa
Our first aim was to compare, using microarray analysis, the transcriptional profile of the involved intestinal mucosa of patients in remission, with that of healthy or inflamed mucosa (cohort 1; table 1). A clear differentiation of samples, based on their inflammatory status, was evident when applying principal component analysis (PCA) using the given log2 microarray expression data (figure 1). Importantly, samples from involved areas of patients in remission (UC remission, shown in green in figure 1) clustered together and away from the other groups.
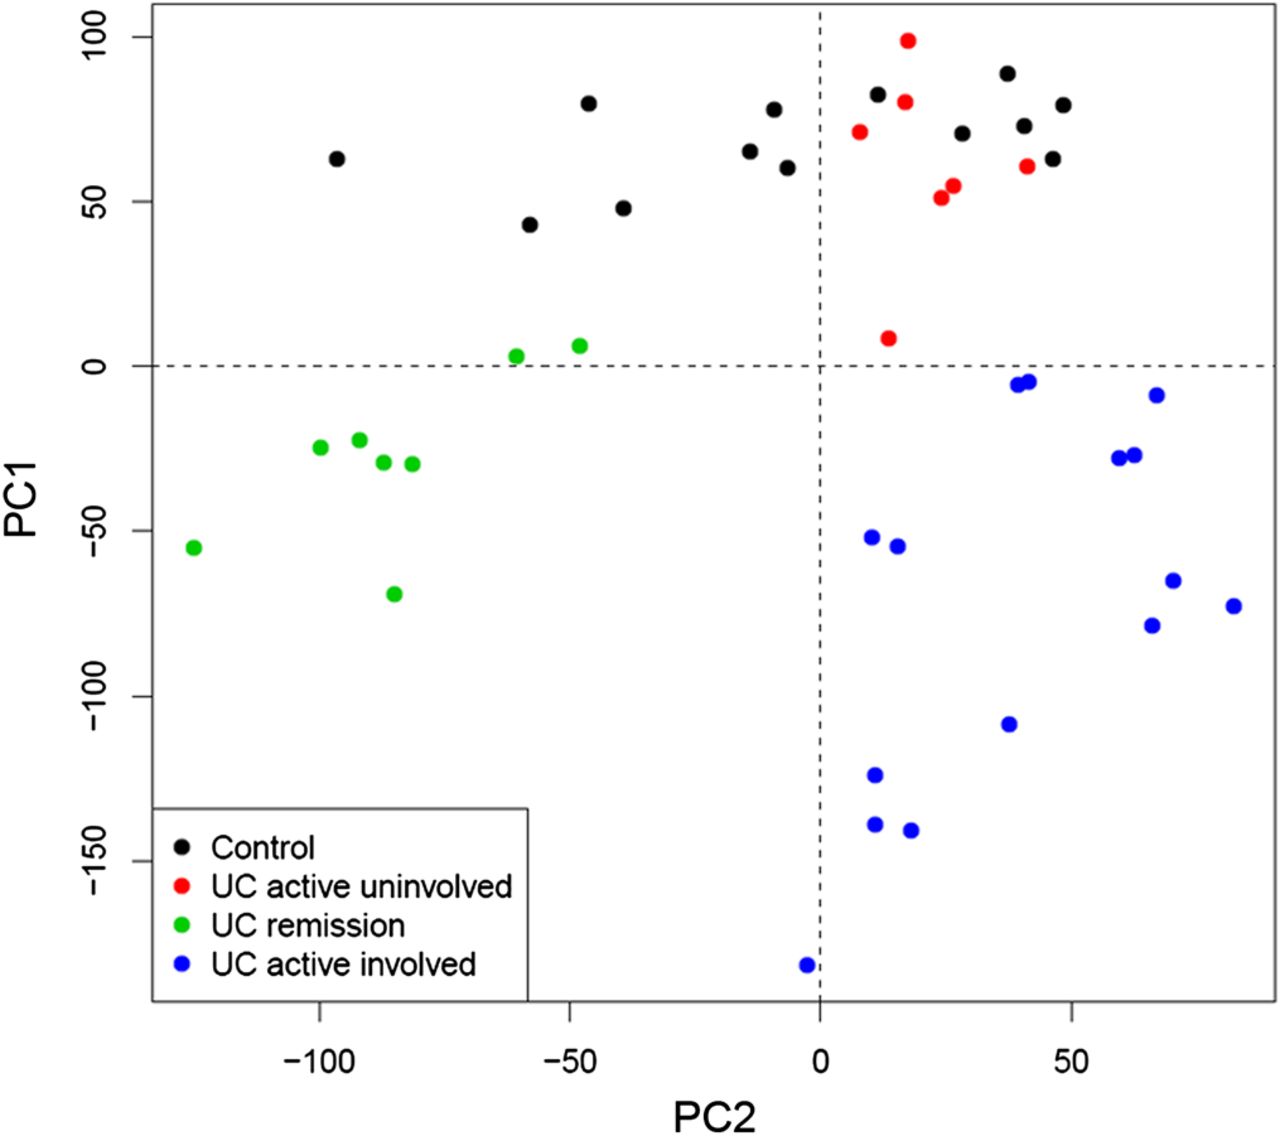
Principal Component Analysis (PCA) of microarray-based genome-wide gene expression profiles derived from intestinal biopsies. Mucosal biopsies were obtained from non-inflammatory bowel disease (non-IBD) controls (black, n=13), non-involved mucosa segments from patients with active ulcerative colitis (UC) (red, n=7), involved mucosa segments from patients with active UC (blue, n=15), and inactive UC (green, n=8). A two-principal component plot is shown with the first component along the Y-axis and the second component along the X-axis.
Using linear models for microarray data (LIMMA), we identified a set of 5469 genes whose expression was significantly up- or down-regulated in UC remission samples compared with non-IBD controls, thereby demonstrating that the UC mucosa in histological remission is distinguishable from that of non-IBD controls. By comparing inflamed samples from UC active patients with non-IBD controls, we identified 6365 genes that were significantly perturbed. It is worth noting that over half of those genes (3700) remained significantly deregulated in UC patients in remission despite complete endoscopic and histological healing. No significant differences in gene expression were detected in UC active uninvolved samples compared with non-IBD controls. Three different expression patterns could be identified by looking at the transcription of these 6,365 genes in UC remission samples relative to the other groups (figure 2). Pattern 1 included genes that showed equal expression in UC remission compared with non-IBD controls; pattern 2 contained genes whose expression in UC remission was intermediate and significantly different from that of controls and UC active; and pattern 3 included those genes that showed expression in UC remission comparable with that of UC active involved and was significantly different to non-IBD controls.

Expression patterns according to microarray analysis. The 6,365 genes identified as differential expressed between ulcerative colitis (UC) active and non-inflammatory bowel disease (non-IBD) controls were grouped into 6 clusters according to 3 expression patterns. For each cluster of genes, the average expression levels (blue points) and the corresponding SD (red line) are shown on the y-axis for each group of observations. The expression level of each gene was normalised to a mean=0.
Analysis of the most significantly regulated pathways during UC remission based on transcriptomic data
Pathways analysis using IPA of the 3700 genes regulated in both active UC and UC in remission (patterns 2 and 3, figure 2) revealed several significantly perturbed biological functions (see online supplementary table S2A). The most noteworthy pathways identified included 945 of the 3700 genes (figure 3). A large share of these was related to fatty acid and protein metabolism. A decrease in biological functions linked to oxidation, concentration and transport of lipids is shown, suggesting reduced energy production, whereas protein metabolism increased. Pathway analysis also revealed a large number of regulated genes involved in cellular movement, mainly associated with the migration of cancer cells. Cellular assembly and organisation was perturbed, with a marked reduction in the tight junction and actin filament formation, and in the quantity of glandular epithelial cells. In addition, our analysis revealed an increase in the adhesion of stromal cells and in the spreading of fibroblasts during remission. Interestingly, biological functions related to colony formation and to the proliferation of colon cancer were found to be elevated. The cell death of epithelial cells and the cytotoxicity of tumour cells were similarly perturbed.

Pie chart representation of the relevant biological functions altered in both active ulcerative colitis (UC) and UC in remission. Twelve categories, including several biological functions, are shown across a range of black and white colouring.
By contrast, that set of genes exclusively deregulated in patients with active UC versus non-IBD controls (pattern 1, figure 2) was primarily associated with immune function and inflammatory response (immune cell trafficking, cell movement and communication, etc), though it was also found to play a role in proliferative and regenerative responses (cellular growth and proliferation, cell death and tissue morphology) (see online supplementary table S2B).
Identification of a UC in remission signature
We next selected 54 genes (see online supplementary table S1) that (1) belonged to one of the 3 aforementioned patterns of gene expression (figure 2) and that (2) were involved in some of the major regulated pathways discussed above. Figure 4 shows a heatmap representation of the microarray expression profile for the chosen 54 genes (100 probes). Microarray expression values for these 54 genes allowed discrimination between groups of UC patients in an unsupervised hierarchical cluster analysis of samples from cohort 1 (figure 4). The selected genes included several belonging to pattern 1 (ie, REG1A, IL8, CXCL3 and WNT5A) shown in the upper part of the heatmap (figure 4), and genes whose expression was deregulated in UC remission and UC active involved samples compared with non-IBD controls (patterns 2 and 3). Ninety-six per cent of the genes selected (52 out of the 54 analysed) were technically validated by real-time RT-PCR. Correlation coefficients (r) between the expression of microarray and real-time RT-PCR analyses and the p values for each probe are shown in the online supplementary table S3.
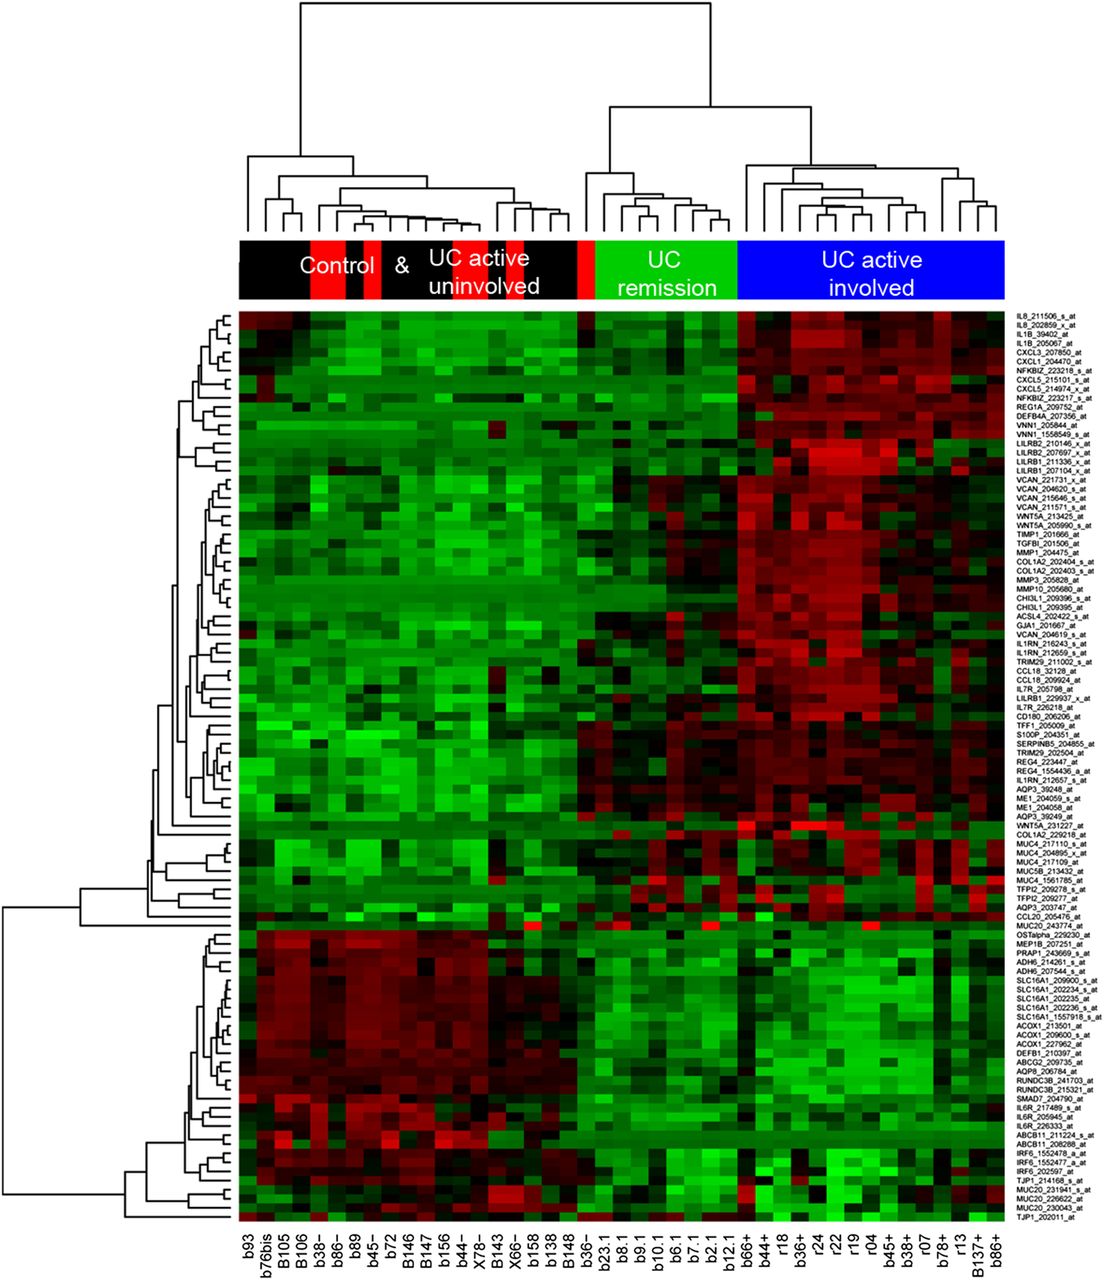
Heatmap representation of microarray expression of 54 candidate genes for the ulcerative colitis (UC)-in-remission signature (100 probes). Heatmap representation of microarray expression of 54 selected target genes. Each row shows one individual probe (representing 54 selected genes) and each column an experimental sample. High expression levels are shown in red and low expression levels in green. An unsupervised hierarchical cluster method, using a Pearson distance and average linkage method, was applied for each sample and gene classification. Samples belonged to one of the following groups: non-inflammatory bowel disease (non-IBD) controls (shown in black, n=13), non-involved mucosa segments from patients with active UC (UC active uninvolved; in red, n=7), involved mucosa segments from patients with active UC (UC active involved; in blue, n=15) and endoscopically and histologically inactive UC (UC remission; in green, n=8).
The UC-in-remission signature is confirmed by real-time RT-PCR in an independent cohort of patients
Next, we analysed the expression of these 52 selected genes using real-time RT-PCR in an independent cohort of patients (cohort 2; table 1). We obtained a refined set of 38 genes (table 2) whose expression profile fell into one of the three patterns described above (figure 2). As expected, we identified a marked up-regulation in UC active involved samples of all pattern 1 selected genes. In particular, REG1A showed the highest up-regulation (1363.4-fold change compared with non-IBD controls and a 403.4 fold-change compared with UC remission samples), followed by IGHG1, IL8, CXCL1 and CXCL3. The pattern 2 genes CHI3L1, MMP1, MMP3 and TIMP1, which are related to the extracellular matrix, showed a marked up-regulation both in UC active and in UC remission samples compared with controls. By contrast, AQP8, a transporter found in the apical membrane of enterocyte cells (pattern 2), was significantly down-regulated in UC active involved and UC remission samples. An additional 22 genes belonging to expression pattern 3 were validated in this cohort. These genes showed a significant up- or down-modulation in UC active involved and UC remission samples. For all pattern 3 genes, no significant differences were found between UC active and UC remission expression. Regenerating islet-derived family member 4 (REG4), an epithelial cell-growth factor, showed the highest up-regulation followed by SERPINB5, which was also expressed by epithelial cells. The relative expression of genes encoding for different epithelial cell transporters, such as ABCG2, AQP3 and SLC16A1, is also shown.
Changes in the expression of selected genes assessed by real-time RT-PCR
The expression of a subset of epithelial genes and proteins remains in a deregulated state during remission
Using patients in cohort 2, we validated a total of 29 genes as being differentially expressed in UC in remission compared with non-IBD controls (table 2, patterns 2 and 3). Remarkably, many of the genes (i.e. ABCG", AQP3, DEFB1, REG4, S100P, SLC16A1, TFF1, SERPINB5 (MASPIN), AQP8, TRIM29, RUNDC3B AND CHI3L1) whose transcription remained altered despite mucosal healing were primarily expressed by epithelial cells; this suggests that the epithelial lining is particularly susceptible during this chronic inflammatory condition.
Figure 5 shows the boxplot representation of gene expression by real-time RT-PCR for some of the most relevant epithelial cell-expressed genes that remained in a deregulated state in UC-in-remission samples. In addition, the expression of REG1A, a gene only up-regulated in UC active involved samples, is shown as a marker of inflammation. Apical membrane butyrate receptor (SLC16A1) and the molecular transporters (AQP8 and ABCG2), which are expressed primarily by enterocytes, showed a significant down-regulation both in active UC and UC in remission. By contrast, the expression of AQP3, a basolateral transporter of these cells, exhibited a significant increase in transcription. Two genes secreted by goblet cells, REG4 and TFF1, also showed an increase in transcription. Moreover, the expression of less well-known epithelial genes—such as S100P, SERPINB5, TRIM29, RUNDC3B and CHI3L1—remained significantly altered in UC in remission.
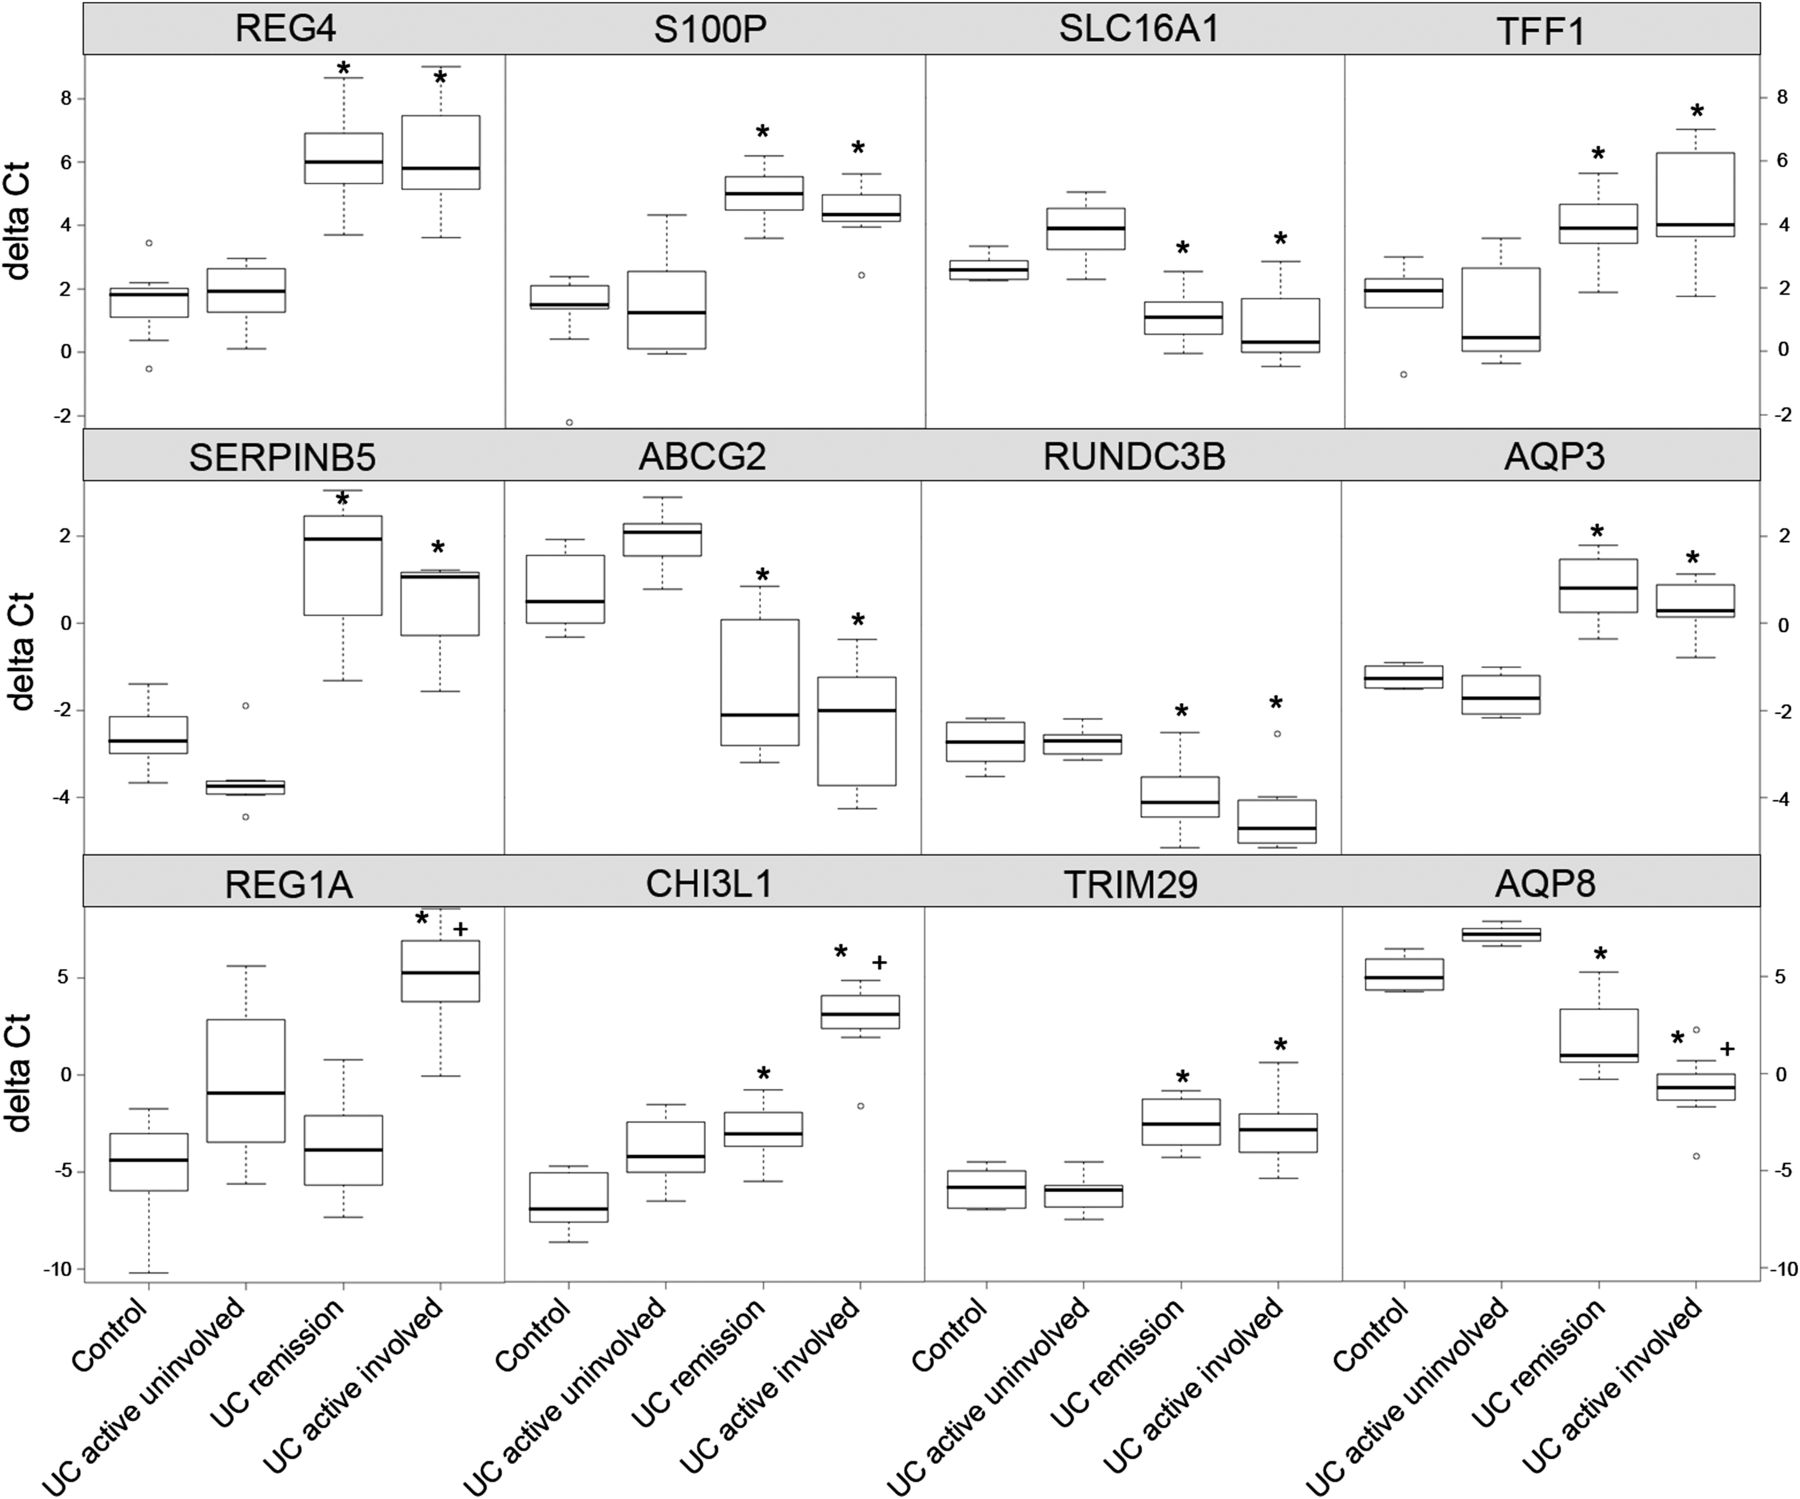
Expression of selected epithelial cells-expressed genes determined by real-time reverse transcriptase PCR (RT-PCR) in non-inflammatory bowel disease (non-IBD) controls and ulcerative colitis (UC) patients with active and inactive disease. Boxplot representation of 12 epithelial cell-expressed genes as measured by real-time RT-PCR (delta Ct) in cohort 2, including 10 non-IBD controls, 12 UC remission, 8 UC active uninvolved and 7 UC active involved samples. Statistical significance compared with controls (*p<0.05) and with UC in remission (+p<0.05) is shown.
In order to further confirm this signature, we determined by immunohistochemistry the expression of 3 selected proteins: REG4, S100P and SERPINB5 (table 2). In addition, we determined the expression of REG1A (pattern 1, figure 2 and table 2) as an epithelial marker of ongoing inflammation. Intestinal epithelial localisation of all four antigens was confirmed by immunofluorescent co-staining with an epithelial marker (EpCAM). Expression of REG4, REG1A, S100P and SERPINB5 (shown in green) within EpCAM-positive (in red) intestinal epithelial cells in the intestinal crypts is shown in figure 6A (white arrows). Strong S100P-expressing cells negative for EpCAM were also identified in the intestinal lamina propria (figure 6A, yellow arrow).

Immunostaining of REG1A, REG4, S100P and SERPINB5 in epithelial cells shows different intensity patterns in active ulcerative colitis (UC) or UC in remission and non-inflammatory bowel disease (non IBD) control biopsy samples. (A) Representative two-colour immunofluorescent staining of fixed paraffin-embedded colonic tissue from one non-IBD control, one UC-in-remission patient (involved mucosa), and from an active UC (UC active involved) patient. All samples were co-stained with EpCAM (red) and one of the following selected markers: REG1A, REG4, S100P or SERPINB5 (green). Sections were counterstained with DAPI (blue). Images were obtained using a 40x objective. White arrows highlight co-localisation of proteins. The yellow arrow shows S100P expression by non-epithelial cells. (B) Representative immunohistochemical staining of fixed paraffin-embedded colonic tissue from one non-IBD control, from the involved area of a patient with endoscopically and histologically inactive UC (UC in remission), and from a patient with active UC (UC active involved). All samples were stained with REG1A, REG4, S100P and SERPINB5 antibodies. Sections were counterstained with haematoxylin. Images from the non-IBD control and the UC remission patient were taken with a 20x objective lens, while the UC active involved subject image was obtained using a 10x objective lens in order to view the whole crypt length. (C) Scatterplot representation of qualitative scores for REG1A, REG4, S100P and SERPINB5 immunohistochemical staining in a cohort of 23 patients (non-IBD controls, n=7; inactive UC (UC remission), n=9; active UC (UC active involved), n=7). Each black dot represents one individual sample. Staining scores range between 0 and 2 (0=negative stain, 1=mild stain, 2=strong stain) for all proteins. Statistical significance between groups was determined using Fisher's exact test and is represented as *p<0.05.
Protein expression of these four epithelial-related genes was quantified by immunohistochemistry in a cohort of 23 patients (cohort 3; see table 1 for patients’ characteristics). In all samples tested, the expression of REG1A, REG4 and SERPINB5 was localised exclusively to the intestinal epithelium, whereas both epithelial cells and a subset of lamina propria cells stained for S100P (figure 6B). As expected, non-IBD control samples showed negative or mild staining for REG4, S100P, SERPINB5 and REG1A, while these four proteins exhibited significantly increased expression in the inflamed mucosa of active UC patients (representative immunostainings are shown in figure 6B). The intensity for each protein was determined using a qualitative score ranging from 0 to 2 (0=negative stain, 1=mild stain, 2=strong stain). Expression of S100P and SERPINB5 was significantly higher in UC in remission (p<0.04) compared with controls, while the expression of REG4 did not reach statistical significance (p=0.13). In agreement with the transcriptional data (both microarray and real-time RT-PCR), expression of REG1A in UC-in-remission patients was comparable with non-IBD controls and significantly different (p<0.005) from that of the involved areas of UC active patients (figure 6C).
Discussion
In the present study, we examined the transcriptional profile of the intestinal mucosa of UC patients in remission, using a whole-genome approach. Our study identified pathways that are permanently deregulated in UC despite endoscopic and histological remission.
During active inflammation, a large number of genes are significantly regulated in UC patients.7–12 As is common in stressed tissues, this includes purely pro-inflammatory genes, and numerous protecting and regenerating mechanisms. Activation of these mechanisms of defense is essential to overcoming cellular stress. In fact, a failure to correctly do so can lead to more severe tissue damage and/or chronic inflammation. These protective mechanisms, which are induced as a response to stress, need to be turned off once the stressor (eg, infectious organism, damaging agent, etc) is eliminated in order to avoid, for instance, uncontrolled cell proliferation, which can lead to fibrosis or dysplasia. In the context of chronic inflammation (UC), however, it remains unclear whether these genes, which belong to both pro-inflammatory and protective subsets, return to homeostatic levels once inflammation is under control.
As we and others,9 ,12 ,13 ,18 ,19 have shown, remission can indeed be accomplished by modulating the inflammatory response with a large number of reversibly modulated genes capable of returning to basal levels. These include genes that transcribe for cytokines, adhesion molecules, immunoglobulins, antimicrobial peptides and tissue-remodelling enzymes, among many others. Achieving expression profiles for this gene set comparable with those seen in a healthy intestine appears to be necessary in order to completely heal the mucosa of UC patients. These genes (ie, IL8, REG1A and CXCL1) and the proteins they encode may therefore represent important targets whose modulation would be associated with mucosal healing and clinical recovery. Moreover, they may constitute good biomarkers that closely correlate with clinical, endoscopic and histological remission, as we have recently shown.19 While this set of genes is reversely induced or repressed, a second group that is also significantly up- or down-regulated in active disease shows only partial or no modulation in inactive patients, despite complete histological and endoscopic remission. This suggests that modulation of this gene set is not required to achieve mucosal healing, and that—in contrast to the first set of reversibly modulated genes—these genes may not serve as candidate targets or biomarkers of disease activity. Overall, our data strongly suggests that the involved intestinal mucosa of UC patients does not return to “normal” after inflammation has resolved, but rather remains in a permanently altered state characterised by a unique transcriptional signature. Importantly, many of the genes we identified as being perturbed in UC-in-remission mucosa have been widely reported to be associated with the development of gastrointestinal carcinomas.20–25 In particular, REG4, S100P and SERPINB5, three of the genes here associated with the inactive UC signature, are known to be involved in epithelial cell proliferation and resistance to apoptosis. REG4 is the most recently described member of the regenerating C-type lectin family of proteins.26 REG4 promotes cell growth by inducing the expression of the anti-apoptotic genes BCL-2, BCL-X and Survivin,27 and its transcription is induced by different growth factors.28 By contrast, expression of the genes that encode for other family members, such as REG1A and REG3, is induced in response to pro-inflammatory cytokines such as TNF-α, IL-6, IL-8, IFN-γ or IL-1β,28 ,29 and as we show here, is significantly down-regulated during remission.
S100P belongs to the S100 family of proteins (which includes S100A8/S100A9, also known as calprotectin, a widely used faecal biomarker of disease activity in UC). This family of proteins is involved in the regulation of cell-cycle progression and differentiation. Similar to REG4, S100P is frequently over-expressed in several epithelial tumour types, including CRC.24 Interestingly, a recent study reported the over-expression of S100P in both UC-associated high-grade dysplasia and colon cancer, and in the non-dysplastic mucosa of UC patients who progressed to dysplasia.30 These findings suggest that there are changes in protein expression early in the neoplastic progression, before any histological changes become evident in epithelial cells.
SERPINB5 (MASPIN) is an intracellular serine protease inhibitor. Expression of SERPINB5 has been shown to gradually increase from non-cancerous mucosa to adenocarcinoma through adenoma.31 SERPINB5 expression reportedly increased in over 90% of patients with active IBD, compared with 10% of healthy controls. In inactive chronic IBD, expression was seen in about 40% of patients,32 in close agreement with our own results.
Importantly, our validated UC-in-remission signature included other epithelial cell-related genes including defensin DEFB1, SLC16A1 encoding for the butyrate receptor, the aquaporins AQP3 and AQP8, the trefoil factor TFF1, and those genes encoding for less well-known proteins such as TRIM29 and RUNDC3B. DEFB1 encodes for the antimicrobial peptide defensin β 1, which is constitutively expressed in the intestinal epithelium.33 Defensins are key effectors of the innate immune response in the intestine. A decrease in expression of DEFB1 has been shown in colonic Crohn's disease, but not in UC.33 Using larger cohorts of patients, both we and others,14 have shown that DEFB1 is indeed significantly down-regulated in active UC and in recovered inactive patients, compared with non-IBD controls. Defective production of antimicrobial peptides could potentially lead to activation of the mucosal immune system and to promotion of disease relapse.
Another interesting target identified in this study is the SLC16A1 gene encoding for the butyrate receptor. Butyrate is a product of commensal metabolism and provides about 70% of the total energy requirements of colonocytes. A reduction in expression of the butyrate receptor during active UC has been previously reported to result in decreased butyrate oxidation.34 ,35 Apart from being a source of energy for colonocytes, butyrate is involved in the inhibition of several key processes, such as colonic carcinogenesis, inflammation and oxidative stress. A decrease in SLC16A1 in intestinal epithelial cell lines reduces the intracellular availability of butyrate, thereby potentially affecting its oxidation and its regulatory effects on cell proliferation, differentiation, apoptosis and inflammation.36–39 Therefore, lower SLC16A1 expression might promote uncontrolled epithelial cell proliferation and contribute to the risk of CRC development. Indeed, SLC16A1 expression is down-regulated dramatically during colon carcinogenesis. This down-regulation of SLC16A occurs as a relatively early event in the adenoma-carcinoma sequence.25
In summary, using transcriptional analysis of the intestinal mucosa we describe herein a unique molecular signature associated with UC in remission. By showing that this gene set is being aberrantly expressed in remitting UC mucosa, we believe the evidence points to new molecular mechanisms that potentially become perturbed in the involved mucosa of UC patients in remission. Interestingly, this signature closely resembles that of the malignantly transformed epithelium. The important question to answer is whether permanent deregulation of these genes influences long-term UC-associated complications such as epithelial cell transformation, loss of intestinal function and disease relapse. While we cannot conclude from our study what the physiological consequences of maintaining these genes in a permanently perturbed state are, one can speculate that in the absence of active inflammation (in the remitting mucosa), the continued aberrant expression of these genes may facilitate the growth of spontaneously occurring malignant epithelial cells and/or promote disease relapse. Whether any of these genes could serve as reliable predictors of progression to CRC in UC patients requires further study.
Acknowledgments
We thank the Endoscopy Department at Hospital Clinic Barcelona for providing us with the samples required to conduct this study, and our patients for their selfless participation. We are indebted to Dr Daniel Benitez-Ribas, Dr Elisabeth Calderón-Gómez, and Dr Isabella Dotti for their critical reading of the manuscript and to Joe Moore for the editorial assistance.
References
Supplementary materials
Supplementary Data
This web only file has been produced by the BMJ Publishing Group from an electronic file supplied by the author(s) and has not been edited for content.
Files in this Data Supplement:
- Data supplement 1 - Online supplement
- Data supplement 2 - Online table 1
- Data supplement 3 - Online table 2
- Data supplement 4 - Online table 3
Footnotes
-
Competing interests None.
-
Contributors AS and JP designed the study; MCM, IO and ER recruited patients; IO and ER assessed clinical disease activity; MJ assessed histological disease activity; NP, RMB and ME performed experiments; NP and JJL performed bioinformatic and biostatistic analysis; and AS, NP, JMP and JP wrote the manuscript.
-
Funding This work was supported by grant BFU2008–02 683/BFI to AS from the Ministerio de Ciencia e Innovación, Spain, and by CIBERehd.
-
Ethics approval Hospital Clínic Ethical Committee.
-
Provenance and peer review Not commissioned; externally peer reviewed.
-
Data sharing statement Microarray raw data from samples included in this study have been deposited in NCBI's Gene Expression Omnibus and are accessible through GEO Series accession number GSE38713.