Article Text

Abstract
Objectives Counting intraepithelial lymphocytes (IEL) is central to the histological diagnosis of coeliac disease (CD), but no definitive ‘normal’ IEL range has ever been published. In this multicentre study, receiver operating characteristic (ROC) curve analysis was used to determine the optimal cut-off between normal and CD (Marsh III lesion) duodenal mucosa, based on IEL counts on >400 mucosal biopsy specimens.
Design The study was designed at the International Meeting on Digestive Pathology, Bucharest 2015. Investigators from 19 centres, eight countries of three continents, recruited 198 patients with Marsh III histology and 203 controls and used one agreed protocol to count IEL/100 enterocytes in well-oriented duodenal biopsies. Demographic and serological data were also collected.
Results The mean ages of CD and control groups were 45.5 (neonate to 82) and 38.3 (2–88) years. Mean IEL count was 54±18/100 enterocytes in CD and 13±8 in normal controls (p=0.0001). ROC analysis indicated an optimal cut-off point of 25 IEL/100 enterocytes, with 99% sensitivity, 92% specificity and 99.5% area under the curve. Other cut-offs between 20 and 40 IEL were less discriminatory. Additionally, there was a sufficiently high number of biopsies to explore IEL counts across the subclassification of the Marsh III lesion.
Conclusion Our ROC curve analyses demonstrate that for Marsh III lesions, a cut-off of 25 IEL/100 enterocytes optimises discrimination between normal control and CD biopsies. No differences in IEL counts were found between Marsh III a, b and c lesions. There was an indication of a continuously graded dose–response by IEL to environmental (gluten) antigenic influence.
- coeliac disease
- intraepithelial lymphocytes
- ROC-curve analysis
This is an Open Access article distributed in accordance with the Creative Commons Attribution Non Commercial (CC BY-NC 4.0) license, which permits others to distribute, remix, adapt, build upon this work non-commercially, and license their derivative works on different terms, provided the original work is properly cited and the use is non-commercial. See: http://creativecommons.org/licenses/by-nc/4.0/
Statistics from Altmetric.com
Significance of this study
What is already known on this subject?
Increased population of intraepithelial lymphocytes (IEL) provides a sensitive histological pointer towards coeliac disease (CD) diagnosis.
IEL lying within the epithelium, and surveying both lumen and lamina propria, are implicated in disease activity, but their functions and prognostic value still remain somewhat undecided.
Submicroscopic changes of epithelial cells and the differential diagnosis of lymphocytic infiltrates were collectively defined as microscopic enteritis.
What are the new findings?
We show that an effective cut-off can be obtained with receiver operating characteristic curve analysis, which substantially reduces the overlap between CD and normal controls.
We confirm that counting of IEL performed on H&E-stained material provides optimal results, compared with CD3/γδ immunostained sections.
We have graphically represented the cumulative totals of IEL across all our biopsies, revealing a continuous ‘dose–response’ curve reflective of the IEL response to luminal antigen, rather than a biphasic or clonal response that might have distinguished controls from coeliac. This has never been demonstrated before.
Finally, with a reliable, large sample, our differential counts revealed no differences between Marsh III a, b and c, indicating that the subdivision of Marsh III has no practical value.
How might it impact on clinical practice in the foreseeable future?
Our differential IEL counts offer unexpected insights into mucosal interpretation that will improve diagnostic accuracy. These include bringing clarity to the IEL’s implications in CD histogenesis, subdivision of Marsh III, assessing the diagnostic role of immunohistochemistry and proposing an effective cut-off to separate disease control from CD.
Introduction
Coeliac disease (CD) has a large spectrum of clinical and histological presentations. The accompanying structural changes in the upper small intestinal mucosa range through normal or near-normal to severe changes where partially reduced villi amalgamate into large, lozenge-shaped surface plateaus.1 As the mucosa ‘flattens’, these markedly hypertrophic responses are triggered by lamina propria T cells under genetic control. Intraepithelial lymphocytes (IEL) lying within the epithelium, and surveying both lumen and lamina propria, are also implicated in this process,2 although their functions and prognostic value still remain somewhat undecided. An increased population of IEL has, for almost five decades, provided a sensitive histological pointer towards CD diagnosis, made more important over the years by the Marsh classification and its emphasis on the infiltrates in normal-looking, villus-bearing mucosa.3
CD is not the only intestinal condition associated with increased IEL counts, which has resulted in the view that a lymphocytosis characterising the milder Marsh I and II lesions can be dismissed as ‘non-specific’. To overcome this impasse, a recent paper dealing with the differential diagnosis of these lymphocytic infiltrates was recently published by the Bucharest Consensus4 and collectively defined as microscopic enteritis.
The Bucharest Consensus was primarily concerned with subtle submicroscopic changes and IEL in coeliac and non-coeliac mucosae. However, despite the numerous papers written on this subject, we were concerned that the literature lacks a definitive cut-off point to confirm the diagnosis. First, there is no universal definition for a ‘normal’ IEL range, and so this makes it difficult to define a specific point of departure favouring a histological diagnosis of CD.
The earliest paper5 used very thick H&E sections (5–7 µm) which are not ideal for making accurate counts, while suggesting that IEL populations are normally distributed. An extremely high cut-off of 40 IEL/100 enterocytes was proposed. Various immunohistochemical approaches have also been deployed since that time, but never incorporated into routine practice.6 Moreover, despite its apparent sophistication and derived insights, the use of immunohistochemistry can be time consuming, requiring additional laboratory techniques and technologies which, when services are under severe time and financial constraints, may not necessarily be ideal. Moreover, since these techniques have not yielded increased degrees of diagnostic precision, they have not yet become cemented into routine clinical practice.
There is therefore a very strong case for re-examining existing laboratory procedures based on H&E-stained sections, thus to improve diagnostic accuracy beyond currently held perceptions. This study aims to bring clarity to the situation. In addition, our differential IEL counts offer further unexpected insights into mucosal biopsy interpretation.
Methods and materials
This case–control study was designed during the International Meeting on Digestive Pathology held in Bucharest, November 2015. It is a multicentred international study involving eight countries, comprising 19 laboratories, each of which provided histological reviews of 10 patients with CD and 10 disease control (DC) patients. The 19 participating centres provided their data from Europe, Middle East and America, which included Ancona, Bologna, Brescia, Salerno, Perugia, Milan and Sciacca (Italy); Dudley, Glasgow, Luton and Milton Keynes (UK); Mashhad and Tehran (Iran); Amsterdam (The Netherlands); Ankara (Turkey); Bucharest and Iasi (Romania); Lyon (France) and Boston (USA). In total, this provided assessments on 401 biopsy specimens and IEL counts on 198 patients with CD (142 (71.7%) women and 56 (28.3%) men) and 203 DC patients (120 (59.1%) women and 83 (40.9%) men). The CD and DC biopsies were selected if they had 4–6 well-oriented tissue samples to allow evaluation of villous/crypt ratio and the number and distribution of the lymphocytes. The number of IEL/100 epithelial cell nuclei was counted in a continuous manner, leaving out the crypt openings. Each laboratory reanalysed the quality of cases before sending the results centrally for consolidation and review. Prominent clinical features relevant to each group are listed (table 1). The inclusion criteria for recruitment were positive coeliac serology and typical histological abnormalities consistent with Marsh III changes.3 7 The subjects with DC were selected from patients with iron deficiency and a negative coeliac serology. Exclusion criteria for DC included active infections, for example, Helicobacter pylori or bacterial overgrowth, non-steroidal anti-inflammatory drugs use, food allergy or any other small bowel disorders. In this retrospective study, H&E-stained 4–5 µm thick sections cut from formalin-fixed paraffin-embedded archival material were used in 162 cases. Some centres additionally employed CD3 immunohistochemistry, involving 36 patients, using commercially available anti-CD3 antibodies. The CD3 antibody clone and vendor and dilutions were different in each centre.8
Frequency of symptoms/sign among patients with coeliac disease and disease control subjects
The project aimed to measure the number of IEL/100 enterocytes in well-oriented duodenal biopsies from patients with untreated CD compared with a corresponding number of DC subjects. A definitive diagnosis of CD was defined as those patients demonstrating Marsh III histological abnormalities with positive serology in line with the current and previous guidelines, whereas those with seronegative Marsh III lesions were excluded.9 10 A multi-institutional collaborative effort to define optimal cut-offs to diagnose CD in patients with milder mucosal changes (Marsh I–II) is being planned as follow-up to our current study.
Ethical considerations
This study involved re-scoring of archived histology slides, and all identifiable medical information was removed and all analyses were performed using anonymised data. The data collection was in line with good clinical practice policies with approval by research and development/audit departments of countries involved. The study was also fully approved by the ethical committee of Research Institute for Gastroenterology and Liver Disease, Shahid Beheshti University of Medical Science, Tehran under the following ethical number: IR.SBMU.RIGLD.REC.1395.87.
Statistical analysis
Data are reported as mean (±SD) for continuous variables and as proportion for categorical variables. Comparisons were performed using the Student’s t-test or χ2 test, as appropriate. Receiver operating characteristic (ROC) curves were used to evaluate sensitivity and specificity for different cut-off levels of IEL/100 in detecting CD. Statistical significance was set at α=0.05.
Results
The mean ages of DC and CD groups were 38.3 (range: 2–88) and 45.5 years (range: newborn to 82), respectively, of which 59% and 71% were women. The mean IEL count was 54±18/100 enterocytes for CD compared with 13±8 for DC (p=0.0001). We present data (figure 1) from IEL counts based on the largest series of intestinal biopsies analysed to date, obtained from eight countries across three continents (North America, Europe and Middle East). In total, 401 specimens were studied, of which 198 came from well-defined patients with CD who were either endomysial antibodies (EMA) or tissue transglutaminase antibodies (tTG) antibody positive (table 1). Of the 198 patients with CD with Marsh III, 27% had iron deficiency anaemia, 13% abdominal pain, 34% diarrhoea and 6% weight loss (table 1).

The numerical IEL counts (non-transformed) for the entire series of 401 specimens are shown for coeliac and disease control intestinal mucosae. The overlap of 56 between IEL counts for each population is stressed. Although when the same data are accumulated, biopsy-on-biopsy (figure 3), a perfectly shaped dose–response curve is obtained. IEL, intraepithelial lymphocytes.
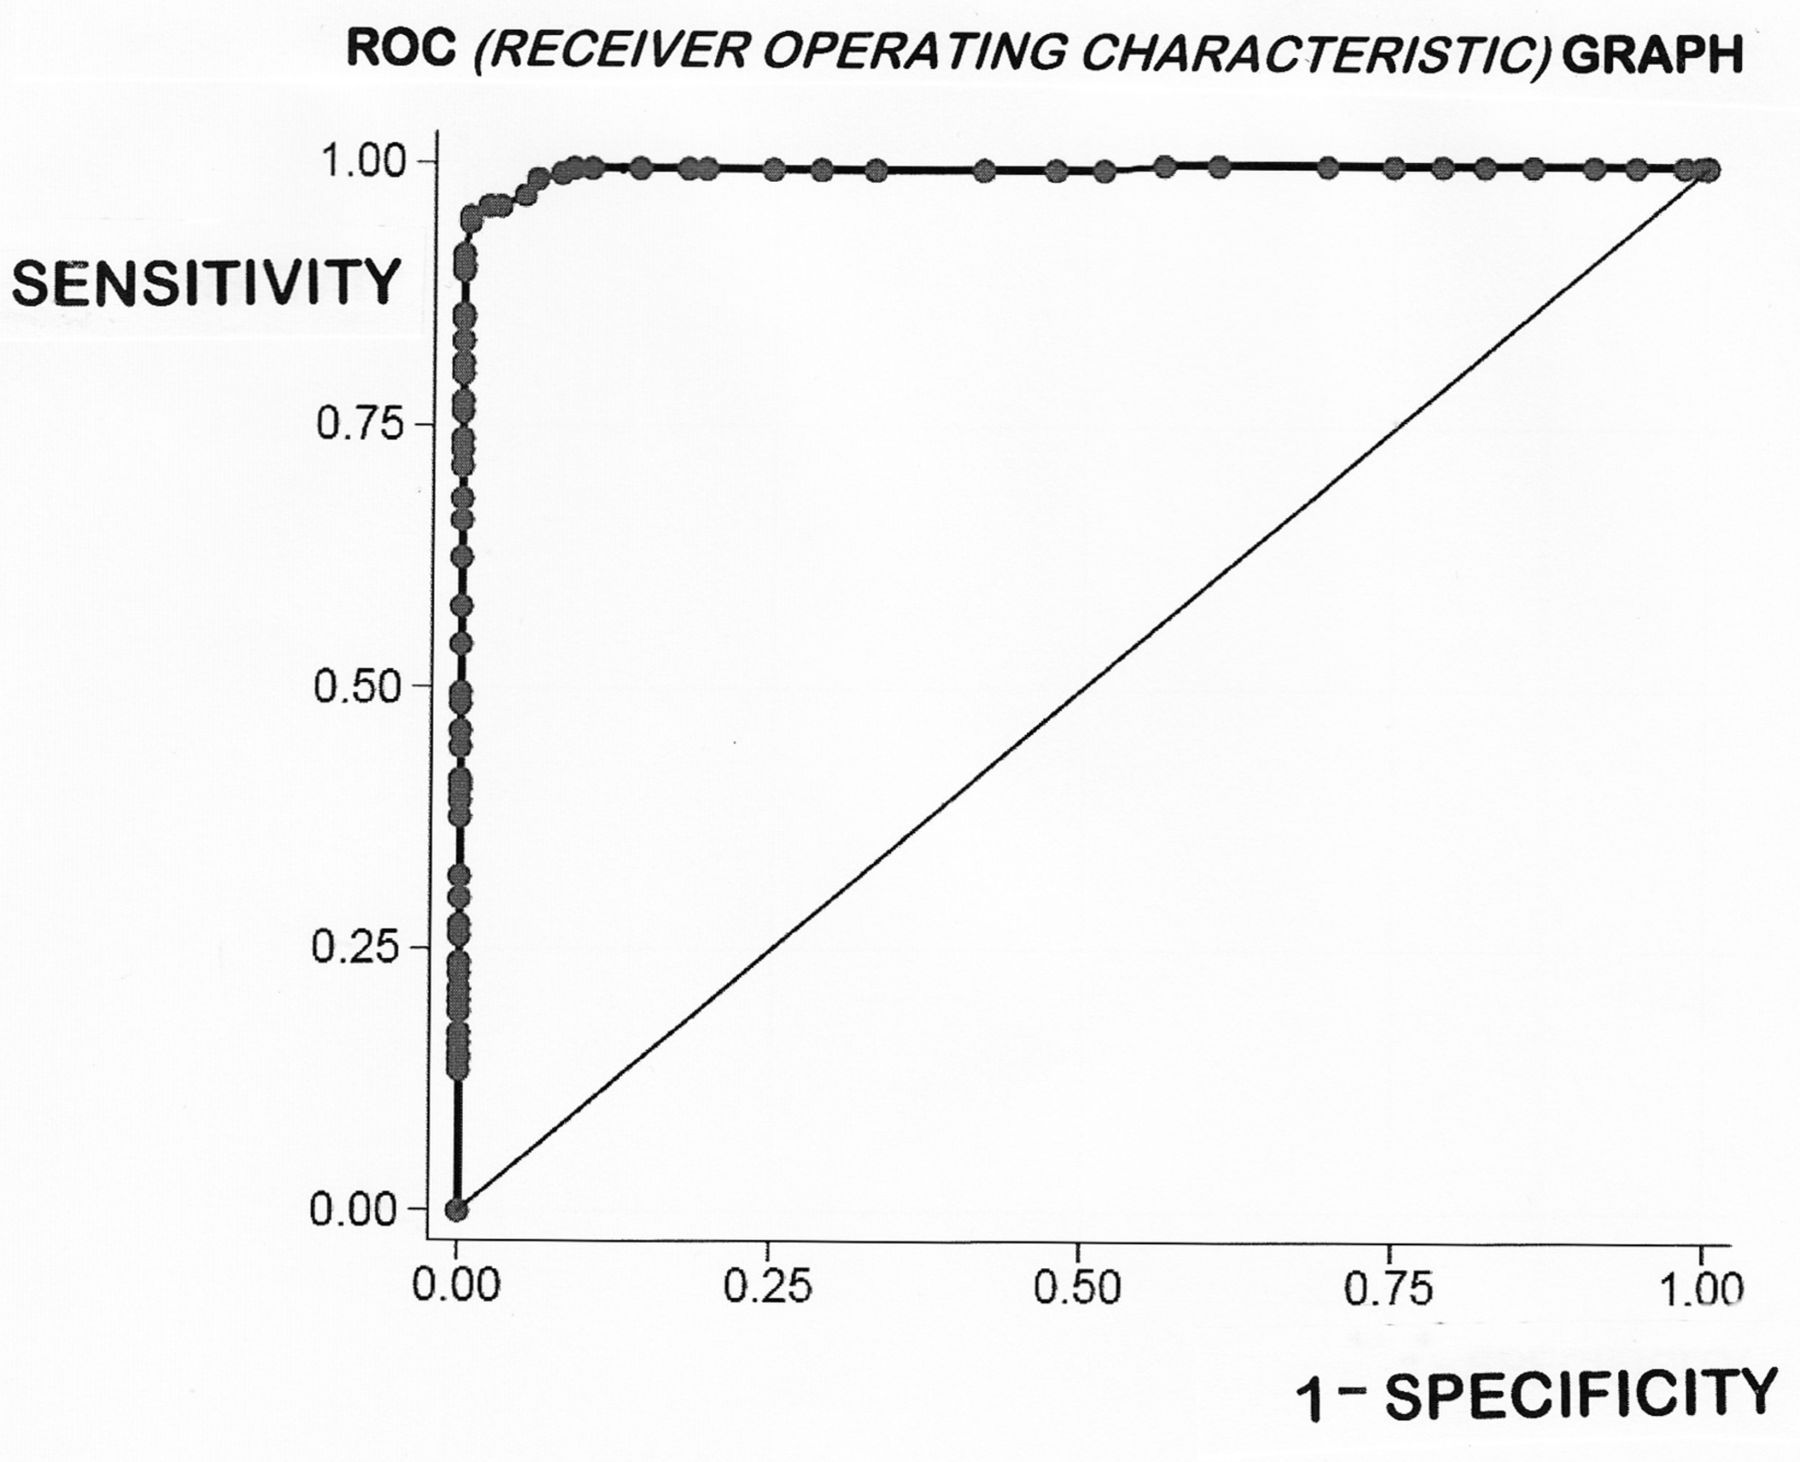
The mean±SD for the DC was 13±7 IEL/100 enterocyte nuclei (95% CIs 1–27). The normality of the variable was assessed visually using a histogram/assessed using a Shapiro-Wilk test which confirmed that the data are skewed to the right and distinctly non-normal. The mean IEL count for CD was 54±18 (95% confidence limits 19–54), differing significantly from DC (p<0.0001). The ‘normalised’ CD mean was 51±14 (95% confidence limits 24–78). Overall, using numerical data, CD and DC biopsies showed an overlap of 56 biopsies comprising 14% of the total specimens analysed. More interestingly with log-transformation, the distributions were ‘tightened’, so that the gross overlap was then reduced to 1%, or 38 biopsies. The literature presents a variety of optimum cut-off points ranging between 20 and 40 IEL/100 enterocyte nuclei, as criteria in the diagnosis of CD (table 2). However, these levels were, surprisingly, determined from means and SD originating from some extremely small groups.11–18 In this study, we had the advantage of large numbers of CD and DC biopsies which were further evaluated through ROC curve analysis (figure 2). This offered an optimal cut-off point of 25 IEL/100 enterocytes, with a sensitivity of 0.990 and specificity of 0.931, respectively; the area under the curve was 99.5%. Here, each point on the ROC curve represents a sensitivity/specificity pair for any threshold value chosen. With perfect discrimination (no overlap in the two distributions), the ROC curve should pass through the upper left-hand corner, indicating a sensitivity and specificity of 100%. Our curve does not fulfil that criterion exactly, pointing to the inevitable overlap of IEL populations between both groups.

The receiver operating characteristic (ROC) curve for all 401 biopsies employed in this study is shown here. If there had been no relationship between the two samples, the curve would have followed the diagonal line. Our ROC graph shows considerable between-group homogeneity, the area under the curve being 99.5%. However, the sensitivity axis does not pass through the upper-left corner, indicative of the overlap which is further examined in detail elsewhere.
Summary of literature on IEL counts
Using our derived ROC curve, we were able to further evaluate the currently existing published extremes (20–40 IEL) in the literature (table 2). Thus, for a high cut-off of 40 IEL, the sensitivity was reduced to 0.80 with a specificity of 1.000. At this level, the false-negative rate was 19.7%, representing a total of 31 patients with CD who would have been missed. Conversely, with the lower cut-off of 20 IEL, the sensitivity was increased to 0.995, although the specificity was now reduced to 0.081. This led to an 18.2% false-positive result, which would have represented 37 DC biopsies being incorrectly labelled as ‘possible CD’. Since the actual numbers of cases misdiagnosed at these outer IEL counts are very high, their inaccuracy as histopathological guidelines is clearly evident.
Both the numerical overlapping (figure 1) and the shape of the ROC curve (figure 2) confirmed our previously published assertion1 that IEL do not represent bimodally distributed populations. This was further confirmed by our cumulative IEL count, biopsy-on-biopsy (figure 3), indicative of a graded dose–response by IEL to environmental (gluten) antigenic influence.19
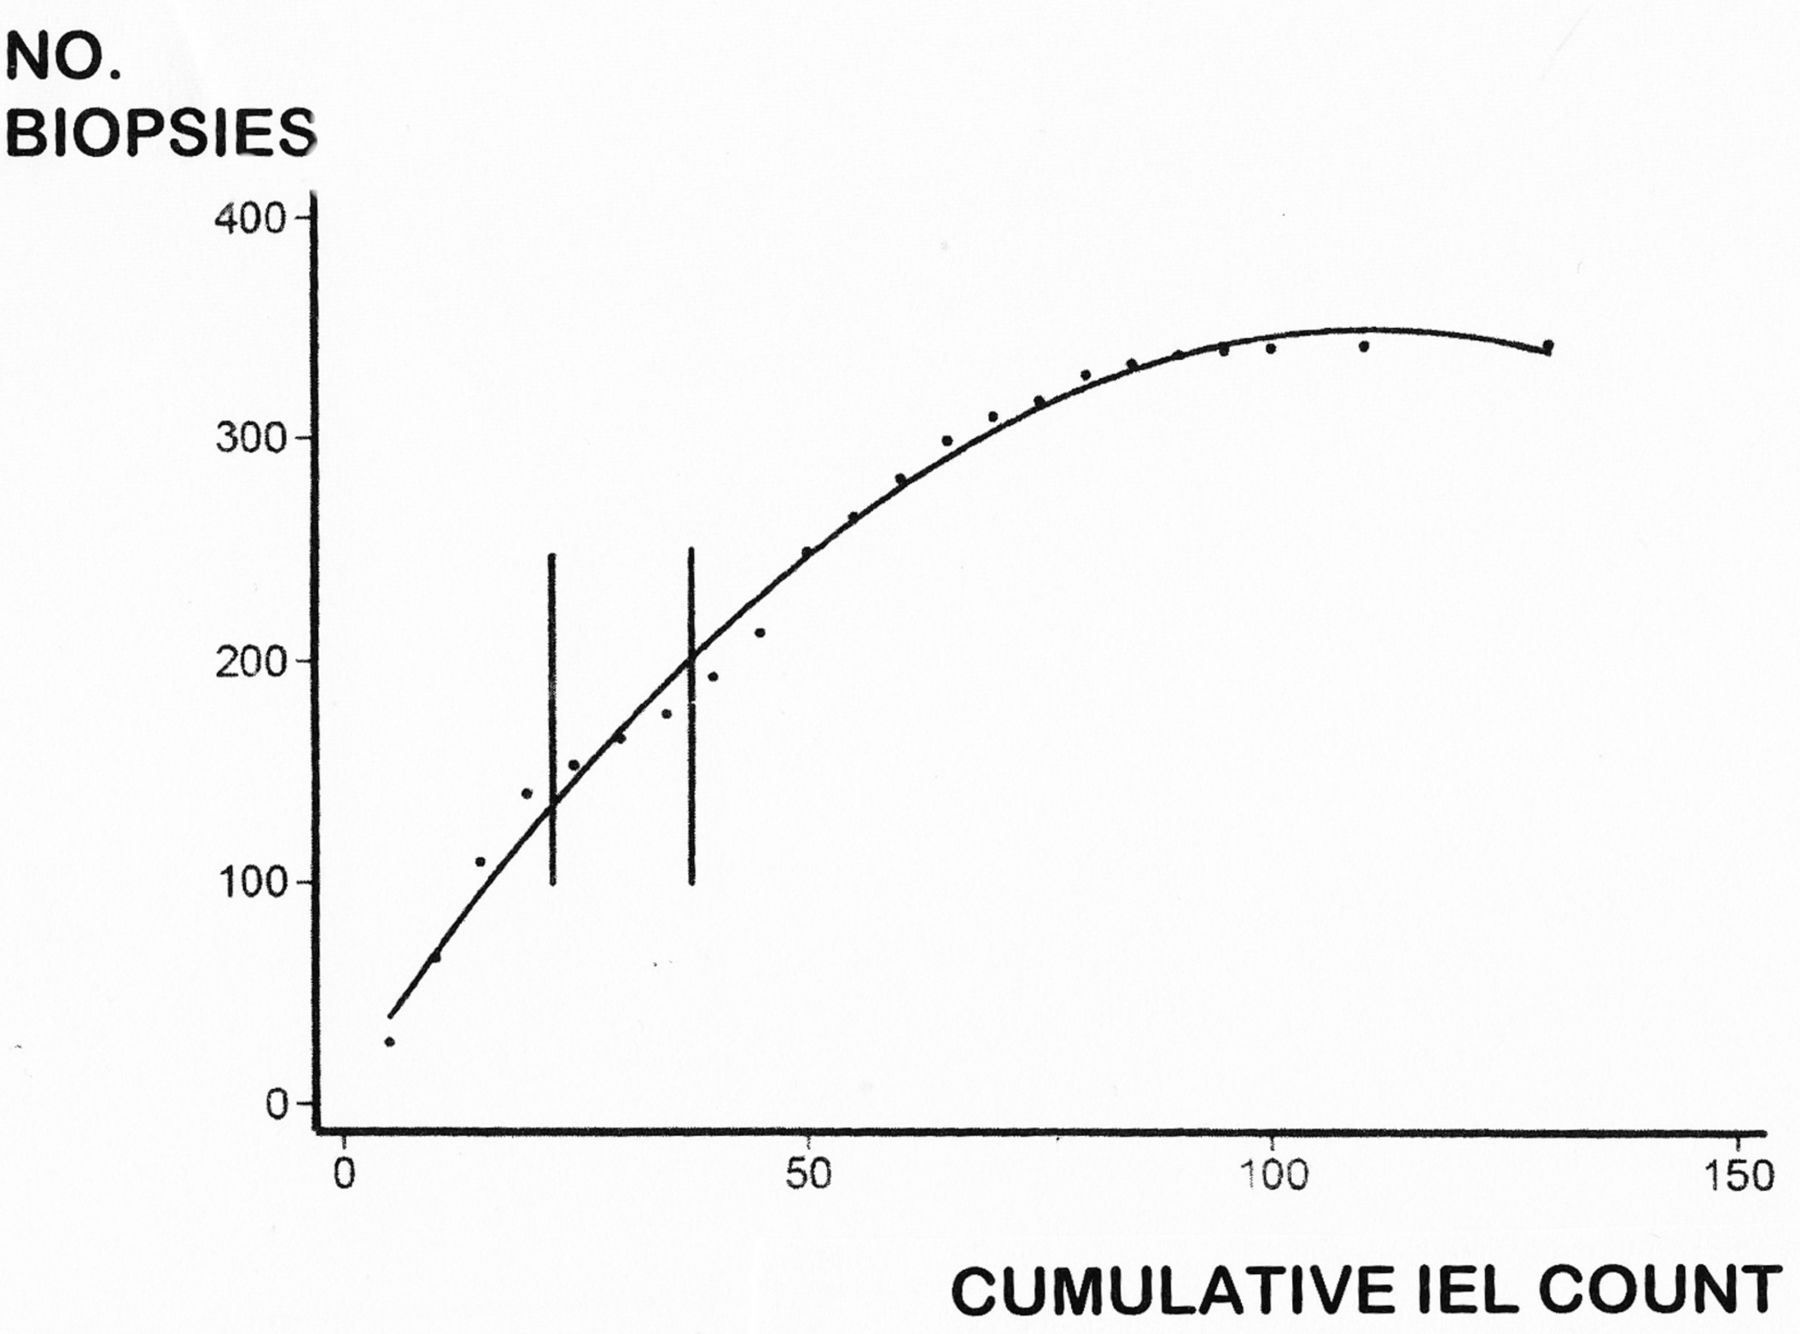
The cumulative IEL count, biopsy-on-biopsy, is illustrated in this diagram. The curve does not reach 401 on account of the overlapping counts between CD and DC mucosae, the overlap between biopsies being indicated by the two vertical parallel lines. The shape of the curve resembles a dose–response (to luminal antigen) and clearly demonstrates the absence of any bimodality between the two IEL populations. CD, coeliac disease; DC, disease control; IEL, intraepithelial lymphocytes.
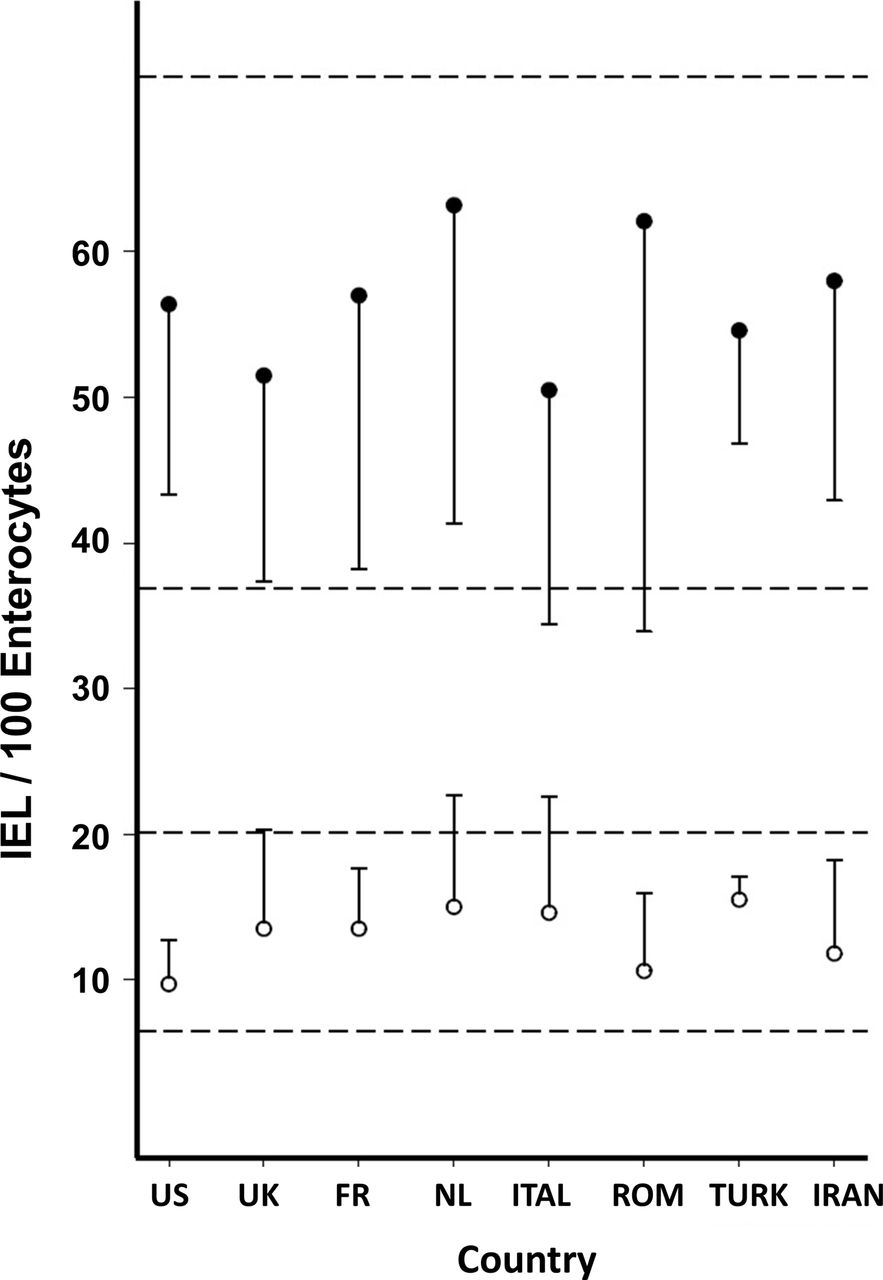
By taking 25 IEL/100 enterocytes as the optimal distinguishing value, a significant reduction was seen in the numerical overlap between patients with CD and DC patients (figure 1). In most previously published series, this overlap has not previously received much in-depth analysis. Given that the IEL are not bimodally distributed, any proposed cut-off between DC and CD biopsies should be seen as arbitrary. In this series, the ROC-based overlap consisted of 3 CD women as false negatives and 12 DC as false positives. Although we had expected to have seen an increase in IEL counts in eastern biopsies, this impression was not borne out in practice (figure 4).
This diagram illustrates the individual measurements from biopsies sampled across the Western hemisphere (USA, UK, France (FR), Netherlands (NL), Italy (ITAL), Romania (ROM), Turkey (TURK) and Iran). Bars reflect mean±SD for disease control (open circles) and coeliac disease (closed circles). The two sets of horizontal dotted lines indicate the overall mean±SD for the two groups of biopsies studied. IEL, intraepithelial lymphocytes.
There were significant differences in the results between the UK and Romania (p=0.011) and between Italy and Romania (p<0.0001). We did not pursue these correlations since the numbers of biopsies per group were too small to deduce any insightful conclusions that could be safely drawn.
All 198 specimens analysed in this study fulfilled Marsh III criteria, of which 132 (66.7%) specimens were graded as IIIa, IIIb or IIIc. In graded specimens, a high proportion (60; 45%) were graded as Marsh IIIc. Conversely, 34 Marsh IIIa specimens comprised only 26%, whereas the 38 remaining specimens (29%) were classified as Marsh IIIb. The grading report was not reportable for 66 of 198 specimens, because six pathologists had already ceased grading this lesion and two others graded biopsies as a+b or b+c or even a+b+c. The IEL populations between these three groupings, however, were not significantly different (table 3).
Breakdown of Marsh III mucosal lesions
Six groups submitted their counts as CD3+ totals, allowing the possibility of determining percentage counts for each Marsh III subdivision. Again, no differences were found (table 3) with the arithmetic mean, being 63 immunolabelled cells/100 enterocyte nuclei.
Discussion
The results of this multicentre study across three continents indicated that: (1) the optimal cut-off point between CD and DC mucosae was 25 IEL/100 enterocyte nuclei, (2) there was no substantial difference in IEL counts from countries across the Western hemisphere, (3) CD IEL counts are not normally distributed, although correction by log-transformation did not materially affect outcomes, (4) the cumulative IEL population, biopsy-on-biopsy, is indicative of a graded dose–response and thus does not represent a bimodal response between CD and DC IEL, and that any proposed cut-off value is arbitrary and (5) the total number of IEL in graded Marsh III lesions (a, b and c) was identical throughout, as was also demonstrated with the (smaller) number of CD3+ labelled IEL.
The use of elevated IEL counts has, for several decades, facilitated the histological diagnosis of CD. The original study which highlighted this advance by Ferguson and Murray5 contains several misconceptions. First, the false conclusion that IEL are normally distributed. The data from our study reveal that error, together with the skewing in the CD distribution, as shown previously.19 It should be noted that there was a marked difference between the overlap as expressed by the numerically bulked data (figure 1), compared with our log-transformed results (data not illustrated). Log-transformation does ‘tighten up’ the distributions, reducing overlapping from 47 to 38. However, irrespective of the theoretical importance of this observation, from a practical point of view, the question arises whether, in routine practice, all suspected CD counts need to be log-transformed to provide the most critically based diagnostic information. Our analyses confirm that this is unnecessary, since log-transformation does not afford any materially different result. For example, the difference for DC distribution was only 2 IEL/100 enterocytes (figure 1), and for CD was 3 IEL. This is an important outcome of our study, and certainly an important message for histopathologists.
Second, Ferguson and Murray took 40 IEL as their upper limit of normal which is one of the highest results published (table 2). Based on our ROC curve analysis, a count of 40 IEL/100 enterocytes has a markedly reduced sensitivity of 0.790, compared with 0.995, when using a 25 IEL cut-off. Our established value corresponds to that of Hayat et al’s12 study but whose outcome was based on an exceptionally low mean count of 11 IEL/100 enterocytes. Indeed, their range was 2–26 IEL, so that with a SD of 7, their upper calculated limit of normal was 25 (11+14). It is interesting to note that they studied only 20 biopsies obtained from apparently ‘healthy’ subjects, defined by a ‘normal’ sugar permeability test. Their counts were also based on enumerating IEL along an uninterrupted length of 500 enterocytes, which to us seems a technical impossibility. Nor were there any comparisons with CD biopsies, so on these three grounds, their study cannot be regarded as a critical evaluation.
Third, Ferguson and Murray introduced the methodology of counting IEL against epithelial cells, the inaccuracy of which was demonstrated by a point-counting technique.20 These revelations were subsequently confirmed by computerised morphometric analysis which showed that IEL counts were likely to be overestimated twofold.
By calculating both the number of enterocytes and IEL present in a controlled unit of villous volume, the numerical discrepancy of the earlier counting technique was exposed.19 21 The flaw is in trying to obtain a meaningful result when both parameters (epithelial cell and IEL populations) are independently changing. The absolute IEL count in untreated CD mucosae is not increased, although it appears elevated since the number of enterocytes on the surface of a Marsh stage III lesion is, comparatively, markedly reduced. Conversely, with Marsh I and Marsh II stage lesions, the increase in IEL is absolute, representing a truly elevated population. Several groups have tried to establish definitive cut-off points. However, these papers exemplify the precarious background on which current practice rests, and which is clearly in need of revision. The question of a cut-off, and how to locate it, is of both theoretical and practical importance.
As evident from the published data, a range of values lying between the extremes of 20 and 40 IEL has been proposed. Beyond that, there have been no further attempts to obtain a more reliable answer. Using our ROC curve (figure 2), we were able to investigate IEL values published in the literature. At the highest notional cut-off value of 40 IEL, we predicted that there would have been 31 false negatives (coeliac cases undiagnosed), but without any false positives. On the other hand, at the lower 20 IEL level, there would have been 37 false positives and 1 (coeliac) false negative. In comparison with our results (with 12 disease controls and 3 coeliac misdiagnosed), the values given in the literature fare badly. The important point to remember is that any cut-off is an arbitrarily fixed point. Nevertheless, given the large numbers of specimens examined in this study, together with their respective IEL populations, the results of our analysis probably represent the best result achievable and hence the most effective cut-off level of 25 IEL on H&E-stained sections for working practice.
However, in another recent publication, IEL counts were accumulated from the preceding 40-year literature, yielding 607 separate data points. In combining H&E-derived IEL counts from both studies (giving a total of 255 CD and 271 DC biopsies), ROC curve analysis provided an optimal cut-off of 26 IEL with 95.81% of the combined sample correctly identified. Marsh and Heal22 also found that separate ROC curve analyses for CD3+, and γδ+, IEL counts yielded less satisfactory cut-off points. Therefore, their results are consistent with the current Bucharest conclusion that H&E-derived IEL counts are adequate for its purpose. These are extremely interesting new insights and of great help to routine histopathologists in being reassured that immunohistochemistry does not offer improved diagnostic certainty.
IEL populations represent graded intestinal responses to antigenic challenge. This has been experimentally demonstrated in treated patients after gluten challenge.19 Here we have again confirmed and revealed the dose–response curve to gluten across all the specimens studied (figure 3). On inspecting our data, we were a little surprised that IEL counts did not increase across the globe from America to the near Middle East (figure 4), which we had suspected.
The statistical differences that were demonstrable are probably of little significance and were not evaluated further. It is, however, noteworthy that the IEL count is dependent on a surprisingly large number of internal and external factors1 including age, genetic background, ethnicity, geocultural factors, diet, food sensitivities, parasites, chronic liver disease, infections, drugs, the maternal and local intestinal microbiomes, and recent travel.
The large numbers of biopsies employed in this work helped to reveal the extent to which false-negative and false-positive misdiagnoses are incurred. A histologically negative result for CD appears to have less impact, since the clinician can employ additional assessments including Human Leucocyte Antigen (HLA) typing, EMA, increased anti-tTG titres or even deamidated gliadin assays23 to aid the diagnosis. A more difficult issue occurs when a normal biopsy is misclassified as CD, since there may be no additional pointers to avoid imposition of a lifelong gluten-free diet.
Finally, our study has cast more light on the subclassification of the Marsh stage III coeliac lesion that originated from Dutch studies24 25 and later taken over by Oberhuber et al26 in a review without citing the studies behind it. The subdivision of Marsh III was introduced to demonstrate a correlation between serology and degrees of mucosal abnormalities that led to first description of seronegative CD concept.24 Within our total sample, 132 biopsies were contributory, but we were surprised that nearly one-half (60, or 46%) were classified as Marsh IIIc, whereas only 38 (29%) were considered Marsh IIIb, and even less, 34 (25%), as Marsh IIIa. It should also be observed that we found no significant differences between the IEL populations within any of these subgroups (table 3). Although this subclassification was supposed to provide a ‘standardised procedure for mucosal classification’, no empirical measurements accompanied the modifications suggested, thus leaving this to subjective interpretation. A subsequent set of ‘guidelines for pathologists’, written by pathologists,27 offered micrographs of biopsies which did not correspond to those originally given. In a separate study of CD IEL and their immunohistological subtypes,28 no differences in the ‘lymphogram’ in terms of the subclassification of Marsh stage III mucosae could be found. That would be inconsistent with the original proposal that each subdivision supposedly represents a progressively greater degree of mucosal involvement and damage. Previous detailed morphological studies with transmission and scanning electronic microscopy have further degraded this subclassification7 by demonstrating their lack of relevance to mucosal architecture interpretation. A recent study from Australia which employed principal component and discriminant analyses29 found that defined algorithms could accurately distinguish the major Marsh grades, but were unable to discriminate between any of the so-called Marsh IIIa, b and c sublesions. Together, this growing body of information seems to indicate that attempted subclassifications of Marsh stage III lesions have no intrinsic status or value, and therefore would best be abandoned.
In that regard, six contributory groups within this study had already abandoned this subclassification, whereas two other groups classified their biopsies with multiple combinations of a+b+c, indicating the impossibility, if not gross frustration, of forcing one subclassification to fit into one or the other category.
This might be an explanation for the anomalous finding that almost 50% of biopsies were classified as Marsh IIIc, with far less weight put on the other two subcategories. Clearly, if morphological, immunohistochemical or mathematically based analyses fail to reveal any major differences in the progressive degrees of tissue damage implied by this subclassification, then what value can emerge from its continued use? Equally strained is the growing habit of equating Marsh IIIa with so-called ‘partial villous atrophy’, Marsh IIIb with ‘subtotal villous atrophy’ and Marsh IIIc with ‘total villous atrophy’. Interestingly, in flat lesions, there is no evidence of an atrophic process, but only hypertrophic mucosal responses,1 and a striking absence of villi.
In summary, based on a large intercontinental study of IEL, involving over 400 biopsies, we have firmly established that a cut-off point of 25 IEL/100 enterocyte nuclei provides a very effective criterion for distinguishing CD Marsh III stage biopsies from DC tissues. No obvious trends in IEL counts were found in biopsies sampled from across the three continents. The CD IEL count is not normally distributed yet, as we have shown, this does not make any substantial difference to laboratory counting in the routine work of histopathologists. We found no differences when examining IEL populations throughout the three proposed subdivisions of the Marsh III lesion, suggesting that these subdivisions (a, b, c) are spurious, lacking any useful histopathological content, while offering no diagnostic or prognostic assistance whatsoever to the gastroenterologist.
Acknowledgments
The Authors would like to thank Coeliac UK for making this study accessible by funding the open access publication fee.
References
Footnotes
Contributors Forty-one pathologists and gastroenterologists participated in this study by contributing towards pathology and clinical data, discussion on study concept, statistical analysis and writing and revising the manuscript. The study was designed during the second consensus meeting incorporated in the International Course of Pathology in Bucharest. KR designed and coordinated the study, organised the second consensus meeting with help and support from GBe. He also collected the data and wrote the first draft of the manuscript. HM performed the first statistical analysis and contributed towards data interpretation. CH performed the second analysis and MNM rewrote the draft and revised the interpretation of data. MWJ and GH critically reviewed the manuscript and MWJ contributed with clinical and histology data. GBe provided data and co-organised the consensus meeting. MHD and JJG contributed with their data, critical revision, drafting and finalising the manuscript. ASr, AE, VV, UV, MD, ACa, ANB, CCi, MRN and LE contributed in the conceptualisation and design of the study, data collection and critical revision of the manuscript. BB, GBa, ABo, CCa, ACi, SF, MiF, MaF, AG, KG, SI, AM, SM, RM, CJM, IR, ASi and MRZ contributed with their pathology and clinical data and revision of the manuscript.
Competing interests None declared.
Ethics approval Research and development/audit departments of countries involved and the ethical committee of Research Institute for Gastroenterology and Liver Diseases, Shahid Beheshti University of Medical Sciences, Tehran under the following ethical number: IR.SBMU.RIGLD.REC.1395.87.
Provenance and peer review Not commissioned; externally peer reviewed.
Correction notice This article has been corrected since it published Online First. The affiliations for Sauid Ishaq, Masoud Sotoudeh and Stefano Ferrero have been updated.