Article Text

Abstract
Objective A signature that unifies the colorectal cancer (CRC) microbiota across multiple studies has not been identified. In addition to methodological variance, heterogeneity may be caused by both microbial and host response differences, which was addressed in this study.
Design We prospectively studied the colonic microbiota and the expression of specific host response genes using faecal and mucosal samples (‘ON’ and ‘OFF’ the tumour, proximal and distal) from 59 patients undergoing surgery for CRC, 21 individuals with polyps and 56 healthy controls. Microbiota composition was determined by 16S rRNA amplicon sequencing; expression of host genes involved in CRC progression and immune response was quantified by real-time quantitative PCR.
Results The microbiota of patients with CRC differed from that of controls, but alterations were not restricted to the cancerous tissue. Differences between distal and proximal cancers were detected and faecal microbiota only partially reflected mucosal microbiota in CRC. Patients with CRC can be stratified based on higher level structures of mucosal-associated bacterial co-abundance groups (CAGs) that resemble the previously formulated concept of enterotypes. Of these, Bacteroidetes Cluster 1 and Firmicutes Cluster 1 were in decreased abundance in CRC mucosa, whereas Bacteroidetes Cluster 2, Firmicutes Cluster 2, Pathogen Cluster and Prevotella Cluster showed increased abundance in CRC mucosa. CRC-associated CAGs were differentially correlated with the expression of host immunoinflammatory response genes.
Conclusions CRC-associated microbiota profiles differ from those in healthy subjects and are linked with distinct mucosal gene-expression profiles. Compositional alterations in the microbiota are not restricted to cancerous tissue and differ between distal and proximal cancers.
- COLORECTAL CANCER
- GENE EXPRESSION
- INTESTINAL MICROBIOLOGY
This is an Open Access article distributed in accordance with the Creative Commons Attribution Non Commercial (CC BY-NC 4.0) license, which permits others to distribute, remix, adapt, build upon this work non-commercially, and license their derivative works on different terms, provided the original work is properly cited and the use is non-commercial. See: http://creativecommons.org/licenses/by-nc/4.0/
Statistics from Altmetric.com
Significance of this study
What is already known on this subject?
Environmental factors have a strong effect on the development of colorectal cancer (CRC).
Certain microorganisms have been shown to be associated with an increased risk of CRC.
No unifying CRC-associated microbiota structure has been determined.
What are the new findings?
Individuals with CRC can be stratified into four groups based on the abundance of bacterial co-occurrence networks, resembling the previously formulated concept of enterotypes.
The altered microbiota composition in the mucosa of patients with CRC is not restricted to cancerous tissue.
Faecal microbiota only partially reflects mucosal microbiota in CRC.
CRC-associated bacterial clusters are differentially correlated with mucosal gene-expression profiles.
How might it impact on clinical practice in the foreseeable future?
The heterogeneity of the CRC-associated microbiota identified could be exploited as a screening tool for individuals at greatest risk of developing CRC.
Modification of the microbiota could be integrated into prevention and treatment strategies for CRC.
Introduction
Despite advances on several fronts, colorectal cancer (CRC) is still a major killer of women and men. Effective prevention requires identification of biomarkers of risk but currently available strategies are actually based on markers of established, albeit early, disease or the identification of precursor lesions such as dysplasia and adenomatous polyps. Since genetic syndromes account for a minority of cases of CRC,1 factors that predispose to sporadic mutations offer the best prospect for early identification of individuals at greatest risk. Most of the known environmental or lifestyle risk factors for CRC, such as obesity and diets that are high in fat or red meat,2 also modify the indigenous microbiota. Thus, the microbiota or its metabolites may be the proximate environmental modifiers of risk for colon cancer. One of the lessons from the relationship between Helicobacter pylori and gastric cancer is that interindividual variation may be due to heterogeneity at the level of either the microbe or the host response.3 In the case of CRC, the relationship between the microbiota and disease may be even more complex; combinations or co-abundance groups (CAGs) of organisms may be operative, rather than representing a one organism–one disease model.4
Molecular mechanisms linking specific microbes with colon carcinogenesis have been identified in experimental animal models.5 ,6 However, studies in humans have been less clear, confounded in part by difficulty distinguishing organisms which have a primary influence from those which are passengers or secondary to the cancer. Various individual organisms have been reported in association with human colon cancer tissue, the most consistent being Fusobacterium species,7 ,8 but the findings have not been uniform in all reports nor conclusive. Some of the variances may be methodological: sampling differences (faeces vs mucosal tissue) or due to different stages of disease or true differences between the right and left colon. Heterogeneity of cancer-associated microbiota might also reflect differences in the host immunoinflammatory response to cancer, which is known to influence prognosis.9 Despite such heterogeneity of CRC-associated microbiota, recent studies have suggested the feasibility of using a combination of several bacteria (or microbiota signature) in the faecal microbiota of individuals with CRC as a marker for detecting the disease.10–12
To address the confounding variables associated with CRC microbiota studies, we conducted a prospective study of the colonic microbiota using paired faecal and mucosal samples (‘ON’ and ‘OFF’ the tumour, proximal and distal) from patients undergoing surgery for CRC, and the microbiota composition was correlated with the expression of specific host response genes. The results show that individuals with CRC can be stratified into four different groups based on the abundance of bacterial co-occurrence networks, but importantly we have been able to define a more complex concept of bacterial abundance gradients and community scaffolds rather than discrete bacteriotypes. The altered microbiota of these patients is present on the mucosa throughout the colon and is not restricted to cancerous tissue. Moreover, we detected microbiota differences between individuals with distal (including rectal) tumours and proximal tumours, and specific microbiota profiles were correlated with the expression of genes known to regulate the host immunoinflammatory response.
Materials and methods
Sampling
CRC patients: In total, 70 individuals scheduled for colonic resection at Mercy University Hospital, Cork, were recruited to the study. Exclusion criteria were a personal history of CRC, IBD or IBS (for description of subjects and clinical data, see online supplementary table S1). Individuals were not treated with antibiotics in the month prior to surgery but were administered antibiotics intravenously within a few hours of the resection. After surgery, two samples from up to five different sites were collected in RNAlater (Qiagen, Hilden, Germany): OFFD (off-distal; 2–5 cm towards the distal end of the colon), OFFP (off-proximal; 2–5 cm towards the proximal end of the colon), UDD (undiseased distal; as far away from the tumour as possible; distal; usually 10–30 cm) and UDP (undiseased proximal; as far away from the tumour as possible; proximal; usually 10–30 cm). Samples were placed in 3 mL RNAlater, stored at 4°C for 12 h and then stored at −20°C. Faecal samples were self-sampled prior to the start of the bowel preparation, transported to the laboratory on ice and frozen at −80°C. In total, mucosal samples from 59 individuals and 43 stool samples were collected. For 32 patients, both tissue and stool samples were obtained.
Supplementary table 1
Polyps: Biopsy samples from 21 individuals with polyps were obtained in RNAlater as described above. Mostly, undiseased tissue was collected from individuals with polyps because the small polyp sample was reserved for examination by a pathologist. Up to two biopsies were obtained per individual upon endoscopy, one from undiseased tissue in the descending colon and one from undiseased tissue in the ascending colon. Exclusion criteria included IBD and IBS and the use of antibiotics 1 month prior to surgery. No stool samples were sampled from individuals with polyps.
Healthy controls: Biopsy samples from 56 controls were obtained in RNAlater as described above. Exclusion criteria included IBD, IBS and CRC. Up to two biopsies were obtained per individual upon endoscopy, one from the descending colon and one from the ascending colon. Stool samples were selected from a previously collected cohort of healthy elderly people.13 In total, samples from 37 healthy, age-matched individuals were analysed.
The study was approved by the UCC Ethics Committee under the study number APC033.
DNA/RNA extraction and 16S rRNA amplicon sequencing
Genomic DNA and total RNA were extracted using the AllPrep DNA/RNA kit from Qiagen. For tissue samples, ∼20 mg of tissue was placed into bead tubes with 250 µL of 0.1 mm sterile glass beads and several 3–4 mm sterile glass beads. Next, 600 µL of buffer RLT (Qiagen) containing 1% β-mercaptoethanol was added and the sample was homogenised in a MagnaLyzer (Roche, Penzberg, Germany) for two pulses of 15 s each at full speed. In between the homogenisation steps, the samples were put on ice for 30 s. The rest of the DNA extraction was carried out according to the AllPrep DNA/RNA extraction kit (Qiagen).
16S rRNA gene amplicon sequencing was carried out employing the 16S Metagenomic Sequencing Library Preparation protocol developed by Illumina (San Diego, California, USA). Briefly, 200 ng of mucosal DNA (50 ng for faecal samples) was amplified employing primers targeting the V3/V4 variable region of the 16S rRNA gene: 16S amplicon PCR forward primer (V3 region): 5′ TCGTCGGCAGCGTCAGATGTGTATAAGAGACAGCCTACG GGNGGCWGCAG; 16S amplicon PCR reverse primer (V4 region): 5′ GTCTCGTGGGCTCG GAGATGTGTATAAGAGACAGGACTACHVGGGTATCTAATCC.14 The products were purified and forward and reverse barcodes were attached (Nextera XT V.2 Index Kit sets A and D, Illumina).
Amplicons were purified again and quantified using a Quant-iT PicoGreen dsDNA Assay Kit (Life Technologies, Paisley, UK). Equimolar amounts of DNA per amplicon were then pooled (314 samples) and sequenced at GATC (Konstanz, Germany) on a MiSeq sequencing instrument (Illumina) using 2×250 bp chemistry.
Analysis of 16S amplicon sequencing data
Paired end sequencing reads were obtained as demultiplexed libraries per sample. To avail the quality control step implemented in QIIMEs15 split_libraries_fastq.py script, barcodes were reattached to each sequence using custom scripts, adaptors were removed using cutadapt16 and paired-end reads were merged using FLASH.17 Libraries were then split using QIIME15 with the split_libraries_fastq.py script. An operational taxonomic unit (OTU) table was obtained using usearch18 and the following procedure. First, unique sequences of length 350–500 nt were filtered (derep_fulllength) and sorted by length (sortbylength). The remaining sequences were clustered (cluster_otus) and filtered for chimaeras against the ChimeraSlayer reference database.19 Finally, all sequences were mapped against this database (usearch_global) and an OTU table was obtained using uc2otutab.py. Classification of representative sequences for each OTU was carried out using mothur20 against the 16S rRNA reference of RDP, V.14. A similar approach was employed for analysing 16S rRNA sequencing data that we obtained from two previous studies,11 ,21 with the exception that quality filtering of the pyrosequencing data from Kostic et al was carried out according to the 454 standard operating procedure in mothur.22 Identical sequencing depth per sample was ensured by rarification to 5000 sequences per sample for this cohort; to 10 000 sequences per sample for data from Zeller et al; and to 2000 sequences per sample for data from Kostic et al. Samples with less sequences were not included in the analysis.
Reverse-transcription real-time quantitative PCR
Total RNA was treated with DNase (TURBO DNA-free, Life Technologies) according to the instructions of the supplier. The treated RNA was then analysed on a 2100 Bioanalyzer (Agilent Technologies, Santa Clara, California, USA) and only used if the RNA integrity number was above 7. Reverse transcription was carried out using 250 ng of RNA, Transcriptor Reverse Transcriptase, primer ‘random’, PCR nucleotide mix and Protector RNase inhibitor (all Roche) as per instructions of the manufacturer. Real-time quantitative PCR (RT-qPCR) was carried out on a LightCycler 480 (Roche) targeting several genes published as being putatively involved in inflammation and cancer progression using primers and probes designed with the Universal ProbeLibrary Assay Design Center (Roche). For primer sequences, see online supplementary table S2. The master mix comprised 5 µL SensiMix II Probe No-ROX mix (BIOLINE, London, UK), 2 µM forward and reverse primer, 2.5 µL DNA and water to 10 µL. The program employed was 95°C for 10 min, 95°C for 10 , 60°C for 45 s, 72°C for 1 s, with the last three steps repeated 45 times. The relative expression of each gene was calculated using the 2−ΔΔCt method.23 The expression was normalised to the average expression of all control individuals. The housekeeping gene used was β-actin.
Supplementary table 2
Statistical analysis
Statistical analysis was carried out in R.24 Paired or non-paired t test or Wilcoxon tests were employed to analyse differences in the abundance between two groups, for normally or not normally distributed data, respectively. To test for differences in the overall microbiota between sample groups, permutational multivariate analysis of variance using distance matrices (pMANOVA) was employed to assess the significance (function ‘adonis’ of the vegan package in R). This method works analogously to MANOVA but does not need to make assumptions about the distribution of the input values.25 Distance matrices were calculated using four algorithms, including unweighted UniFrac and weighted UniFrac,26 Spearman rank and binary distance. Principal component analyses (PCoAs) were used to visualise data using the functions dudi.pco and s.class of the ade4 package. Correlations were obtained with the function cor.test. p Values were adjusted using the function p.adjust and the method of Benjamini and Hochberg.27 Significance was assumed for adjusted p values ≤0.05, if not stated otherwise.
In most instances, for calculations only one sample per individual was used (if available for patients with CRC the ON sample was used, otherwise the mean of all non-cancerous samples). For the calculation of correlations between the abundance of OTUs and the expression levels of tested genes, both the ON sample and the mean of all non-cancerous samples were used because of differences in gene-expression levels between cancerous and non-cancerous tissues (refer to the ‘Results’ section for details). This was also true when comparing paired cancerous and non-cancerous tissues.
Because distal and proximal control biopsies were not different either in terms of overall microbiota or gene expression (see below), the average of both samples per individual (if available) was used for all calculations.
Dietary data
Dietary data were collected using a validated Food Frequency Questionaire13 (FFQ).
Results
Mucosal microbiota of patients with CRC differs significantly from that of controls throughout the colon
PCoA and comparison of the abundance of single OTU and genus revealed significant differences between the mucosal microbiota composition of patients with cancer and that of controls (see figure 1A and online supplementary tables S3–S9). Patients with cancer had an increased abundance of OTUs classified as Bacteroides, Roseburia, Ruminococcus, Oscillibacter, among others and genera previously reported as oral pathogens (such as Porphyromonas, Peptostreptococcus, Parvimonas, Fusobacterium among others). Despite the collective differences between subjects with cancer and controls, the microbiota associated with cancerous and non-cancerous tissues within the same individual did not differ significantly (figure 1B). While individual bacterial taxa, including Fusobacterium, were more abundant in some individuals ON the tumour, no single OTU or genus was found to be significantly more or less abundant (see online supplementary tables S5 and S6). In addition, the microbiota of individuals with polyps (mostly undiseased tissue was studied for this group) was found to be significantly different to that of controls (figure 1A; range of Pr (>F) 0.0002 to 0.03 for the different distance matrices applied as in online supplementary figures S1–S4). This suggests that the microbiota compositional differences in patients with cancer are not secondary to the cancer per se.
Supplementary table 3
Supplementary table 4
Supplementary table 5
Supplementary table 6
Supplementary table 7
Supplementary table 8
Supplementary table 9

Unweighted UniFrac principal component analysis; the microbiota of healthy controls, individuals with polyps and individuals with cancer (A) as well as from individuals with distal, including rectal, and proximal cancers (C) was significantly different; no difference was found in microbiota composition of tumour and paired non-tumour tissues (B); the faecal microbiota of both cancer and control individuals was different from the mucosal microbiota (D). CRC, colorectal cancer.
Mucosal microbiota differs between rectal, distal and proximal CRC
Although most demographic features of the patients with CRC (see online supplementary table S1) were not associated with a particular mucosal microbiota profile, the microbiota of distal and proximal cancers differed significantly, both at the level of the whole community (see figure 1C and online supplementary figures S1–S4) as well as for single OTU and genus (see online supplementary tables S8 and S9). In particular, the abundances of Alistipes (p<0.1), Akkermansia (p<0.1), Halomonas and Shewanella were significantly higher in individuals with rectal and distal cancers. Contrastingly, OTUs classified as Faecalibacterium, Blautia and Clostridium were significantly more abundant in individuals with proximal cancer. This difference in sidedness was also assessed in the control samples. An equal number of distal and proximal sided control tissue samples from different individuals was randomly sampled 100 times. For 97% of sample combinations, the microbiota of distal and proximal control individuals was not significantly different. Thus, it is unlikely that the differences observed between distal and proximal cancers are due to interindividual differences rather than the location of the tumour. Administration of different bowel preparations for distal (including rectal) and proximal cancers is also a possible confounding factor. Individuals with distal and rectal cancers were often administered a full bowel preparation prior to surgery (see online supplementary table S1), whereas individuals with proximal cancers were only administered two phosphate enemas on the morning of the surgery. Indeed, significant differences in microbiota composition were found between individuals with different bowel preparations. However, when excluding proximal cancers, no significant difference in microbiota composition was detected (Pr (>F)=0.12 for unweighted UniFrac distance, no adjustment for multiple testing) for the different bowel preparations applied. In contrast, when excluding distal and rectal cancers with full bowel preparation, the differences in microbiota composition between distal and rectal versus proximal cancers were still detected (range of Pr (>F) 0.003–0.02 for the different distance matrices applied). We conclude that differences in microbiota composition due to varying bowel preparations cannot be excluded but differences in microbiota composition between distal and rectal versus proximal cancers are more robust.
The differences between distal and rectal versus proximal cancers were also consistent with significant differences in microbiota composition found between individuals with and without rectal bleeding, the latter being more common in distal and rectal cancers (see online supplementary figures S1–S4).
Faecal and mucosal microbiota are significantly different
Because of the prognostic importance of early detection of CRC and the potential testing of faeces for microbial biomarkers, we assessed whether faecal microbiota profiles reflected those found for the mucosa as described above.
The microbiota of paired mucosal and faecal samples from individuals with CRC (n=32) differed significantly (see online supplementary figures S1–S4), and this difference was also found when all available samples (matched and non-matched) were included in the analysis (figure 1D). Thus, the relative abundance of single OTU was only moderately correlated between paired mucosal and faecal samples (mean of Kendall's τ correlation coefficient of 0.20 for all OTUs; see online supplementary table S10a). However, significant differences between the faecal microbiota of controls and patients with CRC were still detected, both in terms of single organism (Lachnospiraceae incertae sedis and Coprococcus were significantly decreased in individuals with CRC) as well as overall microbiota (see online supplementary figures S1–S4). Thus, even though faecal microbiota only partially reflects the microbiota at the mucus layer, differences due to disease status are still evident.
Supplementary table 10
Supplementary table 11
Supplementary table 12
Supplementary figures
CAGs reveal heterogeneity of CRC-associated microbiota
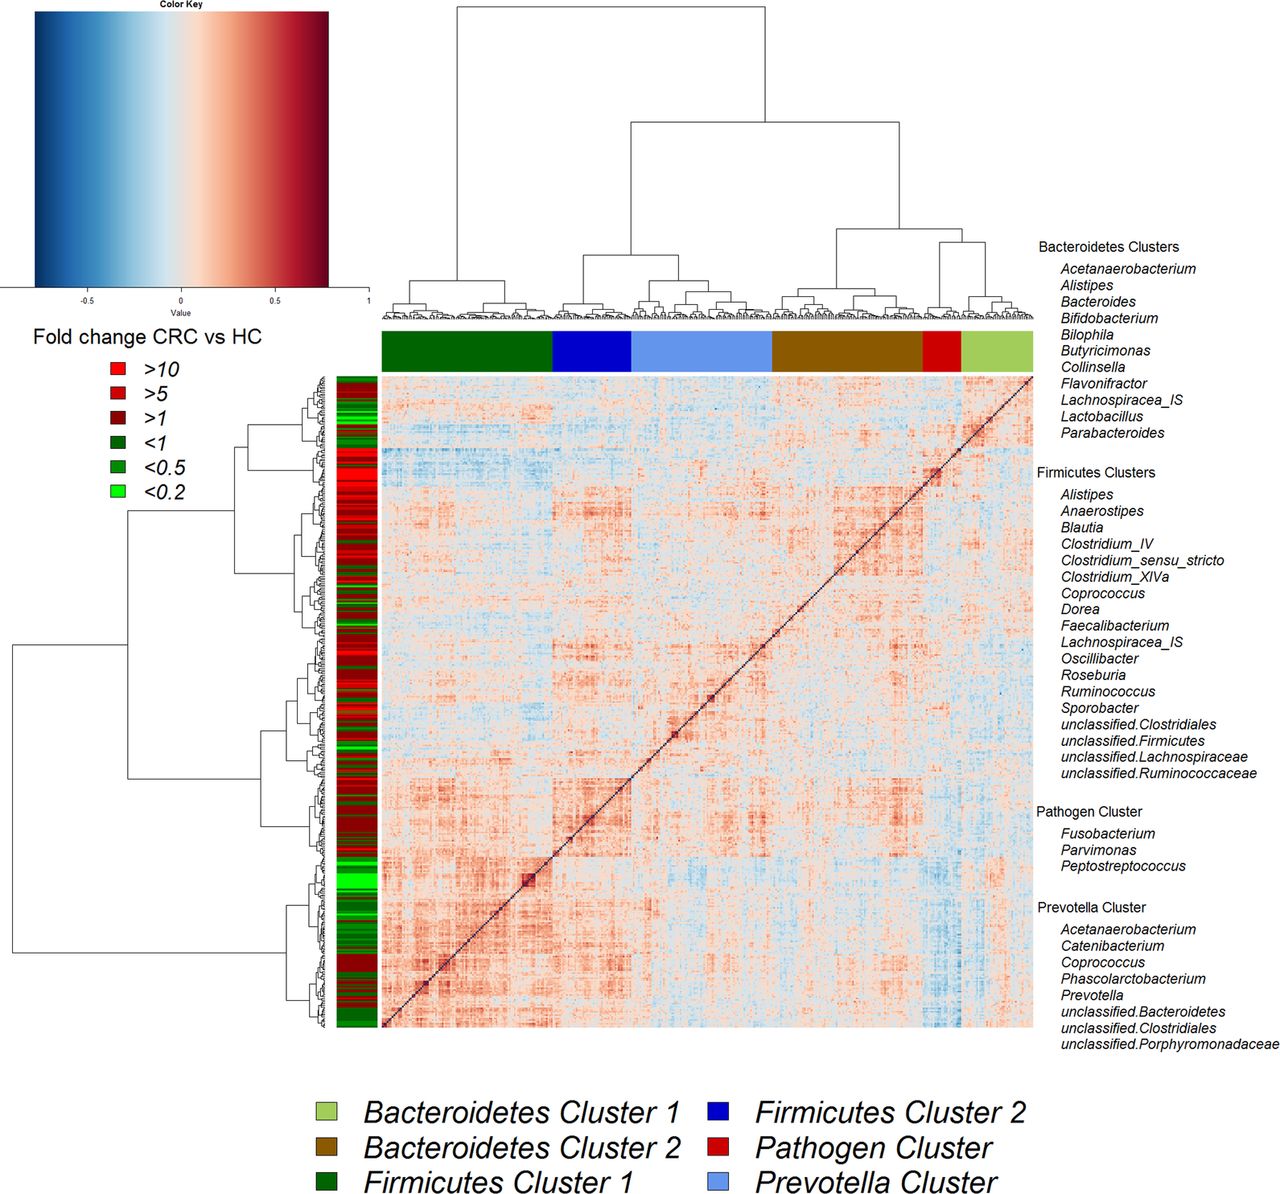
Although several OTUs (and genera) were more abundant in CRC, there was considerable heterogeneity, with no single OTU tested being increased in all individuals with CRC. Therefore, we analysed the microbiota by determining CAGs, since community structure can be more informative than abundance differences of individual taxa.13 We identified six robust CAGs or bacterial clusters in the OTU data set and named them according to the most notable characteristic (figure 2). Among these, the Firmicutes Cluster 1 and the Bacteroidetes Cluster 1 were significantly less abundant in the microbiota of individuals with CRC, whereas the Firmicutes Cluster 2, Prevotella Cluster, Pathogen Cluster and Bacteroidetes Cluster 2 were more abundant in CRC biopsy microbiota (adjusted p value <0.1 for the latter; figure 3A). Similar trends were evident for the mucosal biopsy microbiota of individuals with polyps, albeit not statistically significant in all cases (figure 3A). The relative abundance of these CAGs was also significantly different by tumour location—Bacteroidetes Cluster 2 and the Pathogen Cluster were more abundant in distal cancers, whereas the Prevotella Cluster and Firmicutes Cluster 2 were only significantly more abundant in individuals with proximal cancers (figure 3B).

Hierarchical Ward-linkage clustering based on the Pearson correlation coefficients of the relative abundance of operational taxonomic units in mucosal microbiota of 59 individuals with colorectal cancer (CRC) and 56 healthy controls. Co-abundance groups (CAGs) were defined on the basis of the clusters in the vertical tree and named after their most notable characteristic. Column colour coding is according to legend below. Row colour coding is according to legend on the left. To the right, the most abundant bacterial genera as well as the most strongly connected genera in each CAG (ie, genera with the highest numbers of significant positive correlations with other members of each respective group) are listed. HC, healthy control.

Boxplots of relative abundances of the six co-abundance groups (CAGs), named bacterial clusters in the following. Four clusters (Bacteroidetes Cluster 2 (p<0.1), Firmicutes Cluster 2, Pathogen Cluster and Prevotella Cluster) were of significantly increased abundance in individuals with colorectal cancer (CRC) (59 individuals with CRC, 21 individuals with polyps, 56 healthy controls). Two clusters (Firmicutes Cluster 1 and Bacteroidetes Cluster 1) were of significantly decreased abundance (A). Bacteroidetes Cluster 2 and Pathogen Cluster, Firmicutes Cluster 2 and Prevotella Cluster were most often more abundant in individuals with distal cancers and proximal cancers, respectively (B). ***p value<0.001; **p value<0.01; *p value <0.05; p value <0.1.
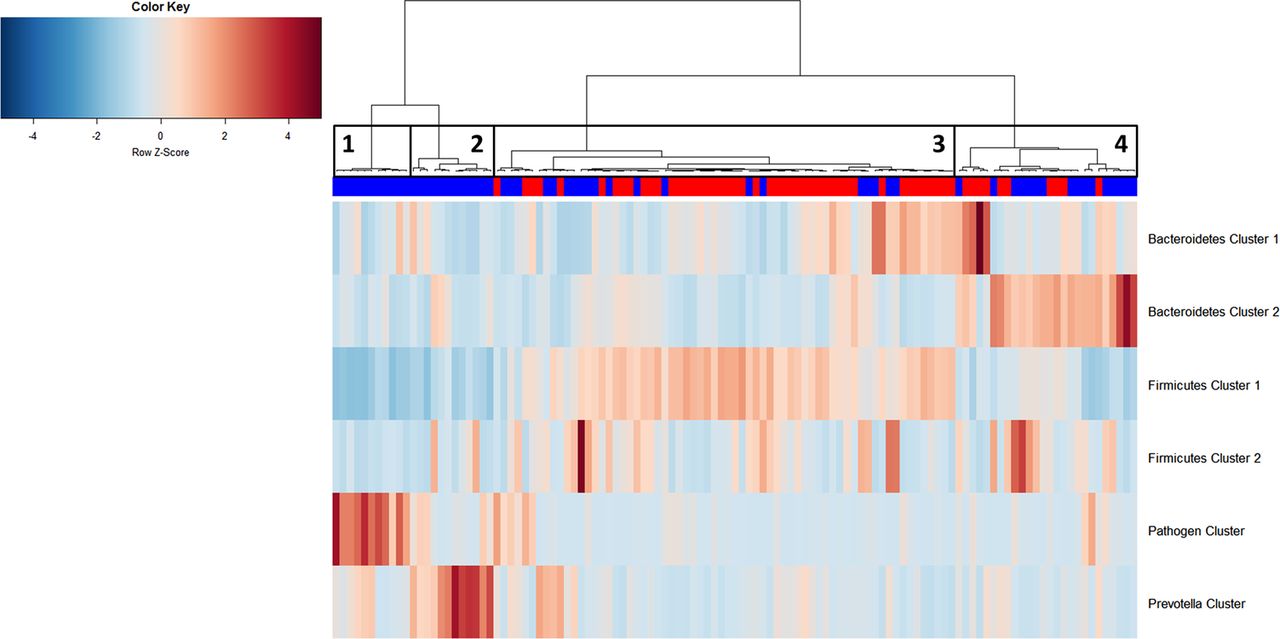
We then examined the potential interactions among the CAGs, which reflect how groups of co-abundant bacteria form higher level associations into complex microbial ecosystems.13 We observed that the abundances of these CAGs per individual were negatively or positively correlated with each other particularly in CRC microbiota (see table 1 for significantly correlated CAGs within CRC samples and figure 4 for corresponding heat plot). Thus, the separation of the samples in the PCoA along the X-axis and Y-axis was significantly correlated with the abundance of the CAGs (figure 5). Moreover, a strong correlation was detected between α-diversity and microbiota structure. The higher microbiota diversity level strongly correlated with the abundance of the Bacteroidetes Cluster 2 and Firmicutes Cluster 2 (p=6×10⁻¹⁰ and p=5×10⁻²⁵, respectively), whereas a negative correlation was detected between α-diversity and the abundance of the Pathogen Cluster (p=3×10⁻⁴). Clustering of individuals based on the (mucosal microbiota) abundance of each of the six bacterial clusters revealed four distinct sample groups (figure 6). Sample Groups 1 and 2 comprised only individuals with CRC, which displayed high abundances of the Pathogen Cluster and the Prevotella Cluster, respectively. Sample Group 3 comprised mostly healthy controls (70%) and individuals in this group had high abundances of the Firmicutes Cluster 1. Lastly, Sample Group 4 contained mostly individuals with CRC (62%) and elevated abundances of Bacteroidetes Cluster 1 and Bacteroidetes Cluster 2 (figures 6 and 7). Firmicutes Cluster 2 was of elevated abundance in CRC samples of Sample Groups 3 and 4.
Pearson correlations of CAGs within CRC microbiota data sets

Hierarchical Ward-linkage clustering based on the Pearson correlation coefficients of the relative abundance of co-abundance groups (CAGs) in colorectal cancer (CRC) samples (59 individuals). p Values for significant correlations are shown in table 1. HC, healthy control.
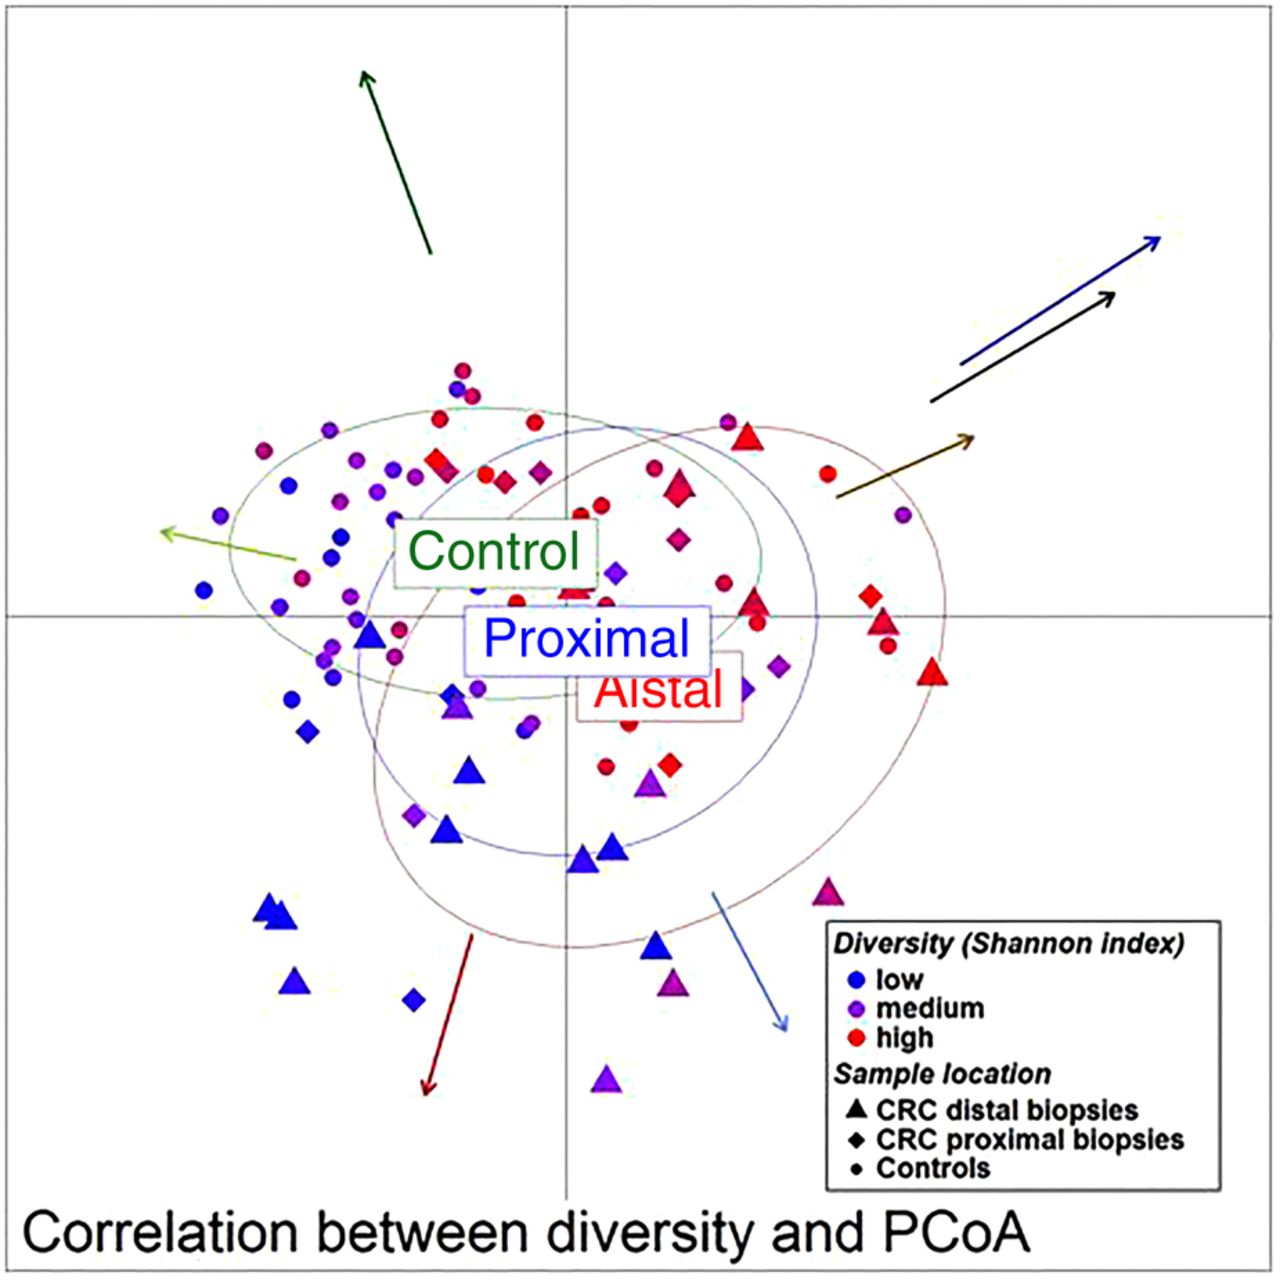
Unweighted UniFrac principal component analysis (PCoA) (mucosa associated microbiota of 59 individuals with colorectal cancer and 56 healthy controls). The location of samples on the PCoA is strongly associated with α-diversity and abundance of the bacterial co-occurrence clusters as defined in figure 2. Arrows indicate the direction of correlations for α-diversity (black) and bacterial co-occurrence networks (colours as in figure 2) with location on the PCoA. The distance from the origin and the direction correspond to the vector of x- and y-axis Spearman-correlation coefficient.

Hierarchical Ward-linkage clustering of biopsy samples based on the Pearson correlation of the abundance of bacterial co-occurrence clusters in each sample (59 individuals with colorectal cancer (CRC) and 56 healthy controls). Four distinct groups of samples were defined. Sample Group 1 and Sample Group 2 only comprises individuals with cancer and display high abundances of the Pathogen Cluster and the Prevotella Cluster, respectively. Sample Group 3 contains mostly samples from healthy controls, which have a high relative abundance of Firmicutes Cluster 1. Sample Group 4 comprises 60% individuals with cancer with high relative abundances of Bacteroidetes Clusters 1 and 2. Firmicutes Cluster 2 was found to be most abundant in individuals with CRC from Sample Groups 3 and 4. Column annotation: cancer biopsy (blue) and control biopsy (red).

Schematic representation of relative abundance distribution for each bacterial co-occurrence cluster (colours bars as defined in figure 2) in each Sample Group (figure 6). Clear differences in relative abundance for each bacterial cluster in each Sample Group are evident. Additionally, individuals in Sample Group 1 were associated with low α-diversity, whereas individuals in Sample Groups 3 and 4 were associated with high α-diversity. Significant difference for each Sample Group compared with each other Sample Group in terms of α-diversity is indicated above bar. Brackets indicate p<0.1.
When comparing the abundance of OTUs in mucosal and paired faecal samples, the OTUs belonging to the Pathogen Cluster showed particularly low correlations between paired faecal and mucosal samples (mean of Kendall's τ 0.166, see online supplementary table S10b). Furthermore, the fold-change in abundance between OTUs of this CAG in mucosal and faecal microbiota was very high (mean >100, see online supplementary table S10b). Many of the OTUs with the highest fold-difference between paired CRC biopsy samples and CRC faecal samples were classified as Parvimonas, Anaerococcus, Streptococcus and Fusobacterium (see online supplementary table S10b), all bacteria of possibly oral origin. This discrepancy indicated a strong dilution of the mucosa-associated microbiota in faeces in individuals with high levels of possibly oral pathogens and could mean that these organisms form tight associations with the mucosa, resembling bacterial biofilms present in the oral cavity.
CRC-associated microbiota heterogeneity is validated by meta-analysis of two previous studies
We investigated if the established CRC-associated microbiota clusters and microbial heterogeneity could be detected in other published CRC microbiota data sets.11 ,21 For better comparability, we performed the analysis upon only one sample per individual (ie, the tumour sample), for both the publicly available data and our data. Additionally, we removed healthy control samples from our data set, as such samples were not available for the other two studies. Strikingly, very similar microbial co-occurrence networks were identified in all three data sets (see online supplementary figures S5–S8). Furthermore, the strong association of the Firmicutes Cluster 2 with elevated α-diversity that we described above, and the association of the Pathogen Cluster with decreased α-diversity, were both consistently detected (see online supplementary figure S9). Additionally, the four sample groups identified in our cohort, containing individuals with high mucosal abundance of the different microbial co-occurrence networks (figure 6), were validated in large part in the other two data sets (see online supplementary figures S10–S13). Lastly, we analysed the data at the level of the bacterial genus, which allowed additional comparison of microbial abundances between healthy controls of the present cohort with microbial abundances in tumour samples of the two publicly available datasets. Mostly, similar bacterial genera were found to be less and more abundant in individuals with CRC throughout all three studied cohorts (see online supplementary figure S14).
Distinctive mucosal gene expression profiles are associated with bacterial CAGs
We quantified the expression of 18 human genes known to be involved in inflammation and progression of CRC (see online supplementary table S2a). Thirteen genes were differentially expressed in patients and controls (see online supplementary table S2b), and the expression was significantly correlated with the abundance of several OTUs (see figure 8 and online supplementary table S11). More importantly, the mucosal abundance of the six bacterial clusters was associated with distinct mucosal gene expression profiles (table 2). The two clusters that were of decreased abundance in individuals with CRC (Firmicutes Cluster 1 and Bacteroidetes Cluster 1) were negatively correlated with the expression of genes such as CXCL1, SERPINE1, and interleukins (ILs) 17a and 23. Contrastingly, the abundance of the cancer-associated clusters Prevotella Cluster and Pathogen Cluster was positively correlated with the expression of these genes. For the Bacteroidetes Cluster 2 and Firmicutes Cluster 2 on the one hand and the Pathogen Cluster on the other hand, all of which show significantly increased abundance in individuals with CRC, opposing correlations were detected (table 2 and figure 9; individuals with CRC only). For example, the abundance of the former clusters was significantly negatively correlated with the expression of CCL20 and IL-17a, whereas the abundance of the Pathogen Cluster was positively correlated with the expression of such genes (table 2 and figure 9). At the level of single OTU, similar patterns were observed (figure 8). Importantly, the associations between the abundance of bacterial clusters and gene-expression levels were also detected in healthy tissue from patients with CRC (see online supplementary table S12), indicating that the microbiota-associated changes of mucosal gene-expression profiles could be involved in the early stages of disease development. In summary, the different mucosal microbiota structures detected were associated with different mucosal gene expression profiles.
Correlations between the expression of genes involved in inflammation and cancer progression and the abundance of CAGs

Network plots of operational taxonomic units (OTUs) based on the mucosal abundance of each OTU in 59 individuals with colorectal cancer and 56 healthy controls. (A) Each node (circle) represents a bacterial OTU. The size of each node correlates to the mean abundance of each OTU across all samples. (B–D) Nodes (OTUs) are shown if the abundance of the respective OTU was significantly correlated with the expression of IL-17a (B), IL-8 (C) or IL-23 (D). Upward facing triangle: positive correlation; downward facing triangle: negative correlation. (A–D) The width of each edge corresponds to the p value of the correlation between each respective node (lower p value, higher line-width). The location of each node was determined by a principal component analysis of the correlation distance as described in ‘Material and methods’ section. Colour of each node according to the co-abundance groups as in figure 2.
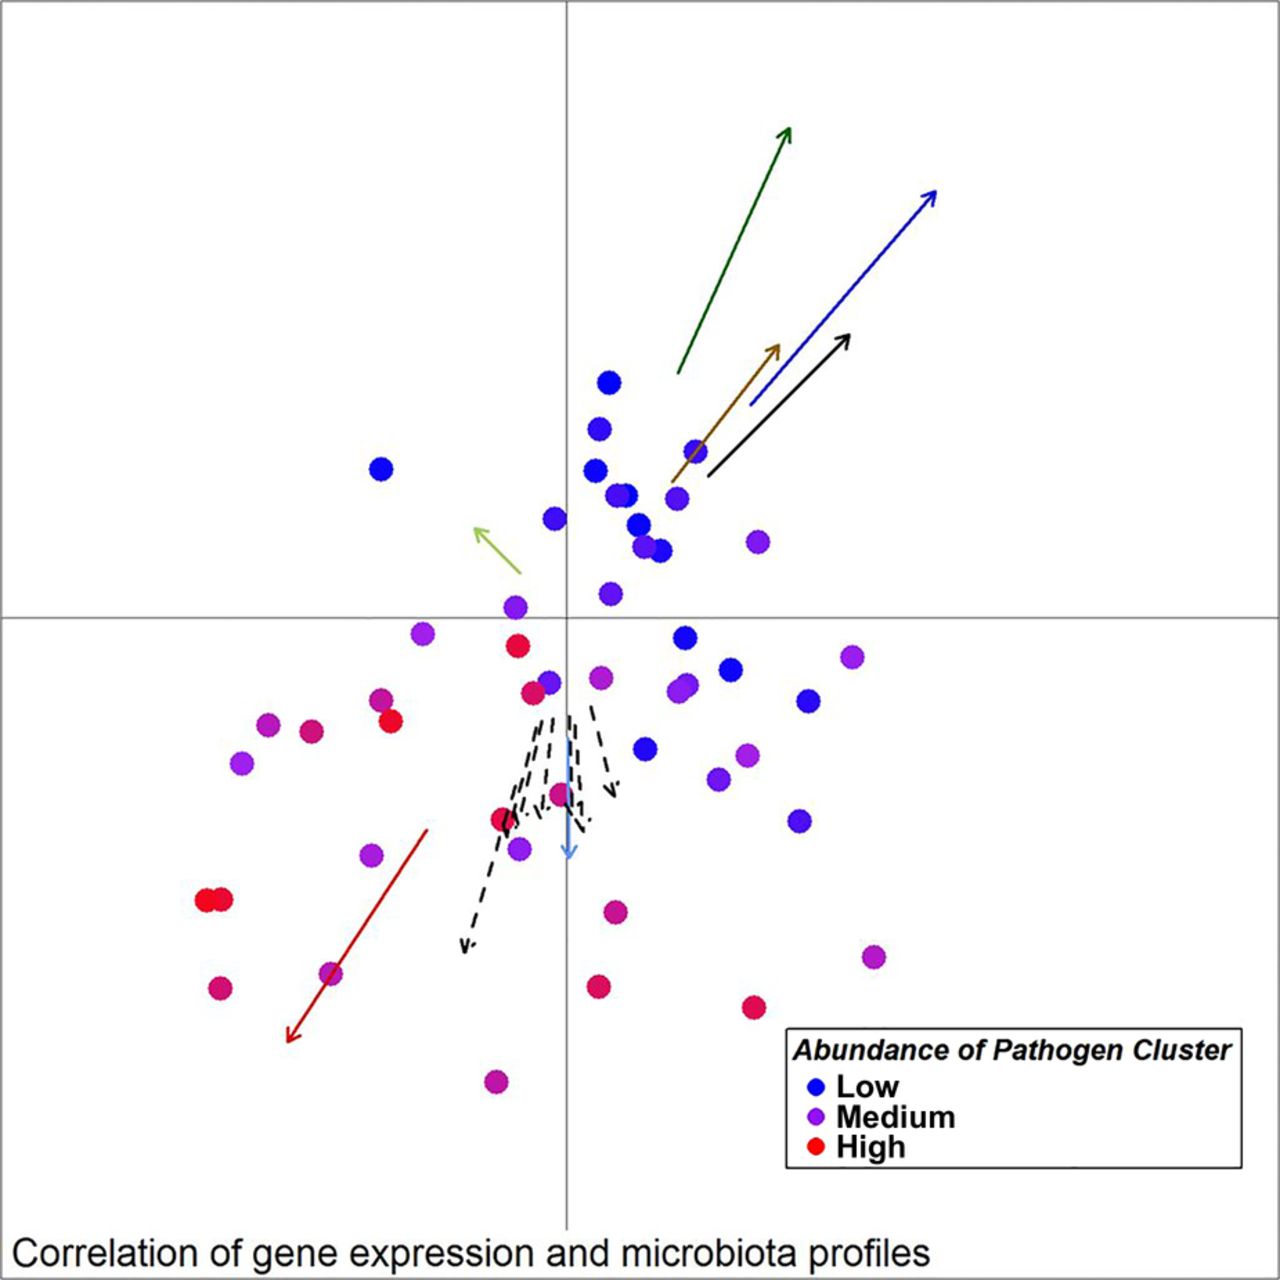
Unweighted UniFrac principal component analysis (PCoA) of mucosal microbiota associated with samples from individuals with colorectal cancer (30 ON samples, 18 OFF samples). Arrows indicate the direction of correlations for the expression of several genes possibly indicative of a TH17 response (CCL20, IL-17a) as well as other interleukins, CXCL1, MMP13 and SERP1 (dashed arrows, p value <0.1), α-diversity (black) and bacterial co-occurrence networks (colours as in figure 2) with location on the PCoA plot. The distance from the origin and the direction corresponds to the vector of x- and y-axis correlation. Colour of circles represents abundance of the Pathogen Cluster in each sample (red: high, blue: low).
Discussion
This study confirms that the microbiota of patients with CRC differs from that of controls, but alterations were not restricted to neoplastic tissue and differed between subjects with proximal and distal, including rectal, tumours. Heterogeneity of the microbiota was particularly evident when it was studied at the level of CAGs rather than at the level of individual organisms or taxa and when correlated with the patterns of expression of host immune-inflammatory response genes.
Previously, only a minority of the studies investigating the mucosal microbiota associated with CRC included healthy individuals as controls.28 ,29 Usually, paired undiseased tissue from individuals with CRC was used for comparison.7 ,8 Furthermore, paired faecal and mucosal samples have rarely been studied.11 To achieve a comprehensive analysis, we included mucosal and faecal microbiota in addition to gene expression profiles of healthy individuals and patients with CRC.
It was striking that the mucosal microbiota of paired samples (‘ON’ vs ‘OFF’ tumour) was very similar with regard to both individual taxa and the overall composition of the microbiota. In contrast, the microbiota was significantly different between controls and cases, and between mucosal biopsies from subjects with polyps (even though we mostly sampled undiseased tissue from such individuals) and controls. It seems likely that a CRC-distinctive microbiota is already present and possibly involved in the early stages of cancer development and less likely that a localised tumour changes the entire colonic microenvironment, to which the microbiota then adapts.
Taxa that were significantly more abundant in patients with CRC were prominent in only a subset of patients with CRC. For example, OTUs most closely related to Fusobacterium, Peptostreptococcus or Parvimonas were markedly elevated in only 20–30% of individuals with CRC. However, it was possible to define four microbial clusters (higher level structures) of the CRC-associated microbiota of which at least one was elevated more than twofold (compared with the mean in all control samples) in all but one of the individuals with CRC. Importantly, we were able to verify our findings with regard to microbial heterogeneity associated with CRC patients by comparison with two previous studies.11 ,21 However, differences were also observed. For example, we defined one CAG in the continental European cohort,21 which comprised genera such as Variovorax, Caulobacter and Comamonas. These bacterial taxa were not prevalent in our cohort which is possibly due to different 16S rRNA regions studied, as well as possibly differences in DNA extraction methodology. Additionally, tumour microbiota data sets from the American/European/Vietnamese cohort21 displayed very high abundances of Fusobacterium spp. in comparison to both the Irish and the continental European cohort. Geographical differences (environmental reservoirs for intestinal bacteria) could be an additional factor in this case.
Arumugam et al have previously proposed a stratification of individuals into three distinct bacteriotypes or enterotypes.30 We detected striking similarities with this concept when grouping individuals into four subgroups based on their abundance of the six bacterial clusters (figures 6 and 7), but our data support a concept of stratification based on bacterial abundance gradients rather than discrete bacteriotypes. Importantly, particularly when only considering the microbiota associated with tumours (see online supplementary figure S7) from the Irish cohort, the two bacterial clusters associated with healthy individuals were still detected (Firmicutes Cluster 1 and Bacteroidetes Cluster 1) and were correlated with the presence of two CRC-associated bacterial clusters (Firmicutes Cluster 2 and Bacteroidetes Cluster 2, respectively). The third and fourth clusters represent the Prevotella Cluster and the Pathogen Cluster, which were both clearly associated with the presence of CRC (figures 6 and 7). This indicates that CRC-associated microbiota arises from a context of three different baseline microbiotas (Firmicutes Cluster 1, Bacteroidetes Cluster 1 and Prevotella Cluster). From a functional point of view, the microbiota of individuals with high abundances of the Prevotella Cluster and the Pathogen Cluster might influence the development of CRC through modulating the expression of immunoinflammatory response genes. Contrastingly, CRC-associated microbiota of the Bacteroidetes Cluster 2 and Firmicutes Cluster 2 type were negatively correlated with the expression of such genes, and are therefore likely to exhibit other properties, which might influence the development of CRC.
In addition, the expression of several genes implicated in the progression or severity of cancer and inflammation, such as CXCL1, SERPINE-1, STAT3 and ILs, was significantly correlated with the abundance profiles of some OTUs and/or CAGs. Surprisingly, the abundance of the Firmicutes Cluster 2 and Bacteroidetes Cluster 2, which were increased in abundance in individuals with CRC, was correlated with a mucosal gene-expression profile more resembling that of a healthy mucosa, whereas the Pathogen Cluster and Prevotella Cluster were correlated with high expression levels of CCL20, CXCL1, IL-17a, IL-23, IL-8, MMP13 and SERP1 (figures 8 and 9). CXCL1 expression has been shown to increase the survival of cancerous cells31 and to promote angiogenesis in CRC.32
Previous reports linked an increased TH17/TH1 ratio in the tumour microenvironment with a poor prognosis for CRC.9 Increased tumorigenesis has been described in mice colonised with enterotoxigenic B. fragilis in an IL-23-dependent and STAT3-dependent manner associated with TH17 activation.5 Moreover, IL-23-producing myeloid cells, likely activated through TLR-dependent detection of microbial products, elicit a tumorous IL-17 response and tumour progression, possibly through STAT3 signalling.33 The association of the Pathogen Cluster in this study with IL-17a, IL-23 and CCL20 (which binds to the receptor CCR6, which is extracellularly expressed by TH17 cells) is a strong indicator that this CAG is associated with an increased TH17 response and may be associated with a poor prognosis for CRC. In contrast, the negative association of the Bacteroidetes Cluster 2 and Firmicutes Cluster 2 with the expression of IL-17a and CCL20 suggest that these CAGs are associated with a decreased TH17 response and, perhaps, a better prognosis for CRC.
It is noteworthy that the Pathogen Cluster comprises several OTUs most closely related to genera found in the oral cavity, such as Fusobacterium, Porphyromonas, Anaerococcus, Parvimonas, Granulicatella and Prevotella. In this respect, our data support the recently presented ‘oral microbiome’ hypothesis34 at least for a subset of CRCs. Furthermore, OTUs from the Pathogen Cluster were only detectable in low abundance in the faecal microbiota (see online supplementary table S10b), indicating a tight association with the cancerous tissue. It is conceivable that polymicrobial colonisation of the tumour by bacteria closely related to oral pathogens, possibly similar to a microbial biofilm, could promote tumorigenesis by altering the tumour microenvironment and eliciting an increased TH17 response, which is associated with a poor prognosis in CRC.
The differences in the microbiota of patients with proximal and distal cancers found here are an additional level of tumour–host heterogeneity. We identified a CAG (Firmicutes Cluster 2), which was more often found to be increased in proximal cancers and associated with a gene expression profile more similar to the control cohort (and possibly a decreased TH17 response). In particular, the abundance of the Bacteroidetes Cluster 2 and Firmicutes Cluster 2 was negatively correlated with the expression of IL-17a and CCL20, a chemokine shown to promote cancer cell proliferation and migration35 and which binds to the TH17-cell receptor CCRC6. Several microbial and host factors contribute to differences in the topographical distribution of cancers over the long axis of the gut.36 The biological significance of difference in the microbiota in the proximal and distal colon is not currently clear but it is noteworthy that right and left colon are embryologically distinct, and have different blood supply and innervation. Furthermore, cancers of the right colon present and behave differently clinically to those of the distal colon. The relationship between these facts and the distinctiveness of the microbiome in the right and left colon is uncertain but worthy of future exploration.
There are aspects of this study that can be improved in future. First, although we could not find differences between the composition of the microbiota of individuals with or without neoadjuvant therapy, presurgical treatment is potentially a confounding variable that is currently being tested more systematically by us. Second, bowel preparation has been shown to effect microbiota composition.37 Whereas we cannot exclude an impact of the varying types and amounts of bowel preparation administered on the microbiota, the detected differences in the microbiota structure of healthy controls and individuals with CRC as well as distal, including rectal, and proximal CRCs were stronger than differences related to bowel preparation. Third, we found evidence that individuals with CRC have different dietary habits than healthy controls (see online supplementary figure S15). However, no significant association was found between habitual diet and structure of the microbiota, perhaps because of insufficient dietary difference within the cohort. Furthermore, although dietary assessments by FFQ have been highly informative in assessing the impact of diet on the composition of the microbiota in elderly subjects,13 a diet–microbiota link probably relates to dietary intake many years before the age of presentation with CRC. Consequently, contemporaneous dietary assessments are less likely to be informative.
In conclusion, distinct higher level structures in the microbiota can be employed to stratify individuals for their risk of presenting with CRC. Furthermore, CRC-associated microbiota is differentially correlated with distinct patterns of gene expression for host immunoinflammatory responses. Longitudinal studies are required to further assess the predictive value of the findings as biomarkers of disease risk. In addition, the potential to modify the microbiota in at-risk subjects merits exploration.
Acknowledgments
We thank Ludovica Butto and John McSharry for help with RT-qPCR, Patricia Egan, Catherine O'Riordan and Donal Sheehan for clinical liaison and Susan Rafferty-McArdle and Eileen O'Herlihy for project management.
References
Footnotes
Corrrection notice This article has been corrected since it published Online First. An Open Access licence has been added.
Contributors BF: study design, sample handling, carrying out of experiments, data analysis, manuscript writing; DBL: data analysis; JMRB: data acquisition; IBJ: data analysis; FJR: sample handling; MJC: sample provision; MOR: study design and sample acquisition; FS: study design and manuscript writing; PWOT: study supervision, design and manuscript writing.
Funding This work was supported, in part, by Science Foundation Ireland through a Centre award to the APC Microbiome Institute (SFI/12/RC/2273). MJC and FJR are supported by Science Foundation Ireland Starting Investigator Research Grant (11/SIRG/B2162).
Competing interests None declared.
Ethics approval UCC Ethics Committee.
Provenance and peer review Not commissioned; externally peer reviewed.
Data sharing statement Raw data for 16S-rRNA amplicon sequencing are available upon request.