Article Text

Abstract
Objective Antibiotic (AB) usage strongly affects microbial intestinal metabolism and thereby impacts human health. Understanding this process and the underlying mechanisms remains a major research goal. Accordingly, we conducted the first comparative omic investigation of gut microbial communities in faecal samples taken at multiple time points from an individual subjected to β-lactam therapy.
Methods The total (16S rDNA) and active (16S rRNA) microbiota, metagenome, metatranscriptome (mRNAs), metametabolome (high-performance liquid chromatography coupled to electrospray ionisation and quadrupole time-of-flight mass spectrometry) and metaproteome (ultra high performing liquid chromatography coupled to an Orbitrap MS2 instrument [UPLC-LTQ Orbitrap-MS/MS]) of a patient undergoing AB therapy for 14 days were evaluated.
Results Apparently oscillatory population dynamics were observed, with an early reduction in Gram-negative organisms (day 6) and an overall collapse in diversity and possible further colonisation by ‘presumptive’ naturally resistant bacteria (day 11), followed by the re-growth of Gram-positive species (day 14). During this process, the maximum imbalance in the active microbial fraction occurred later (day 14) than the greatest change in the total microbial fraction, which reached a minimum biodiversity and richness on day 11; additionally, major metabolic changes occurred at day 6. Gut bacteria respond to ABs early by activating systems to avoid the antimicrobial effects of the drugs, while ‘presumptively’ attenuating their overall energetic metabolic status and the capacity to transport and metabolise bile acid, cholesterol, hormones and vitamins; host–microbial interactions significantly improved after treatment cessation.
Conclusions This proof-of-concept study provides an extensive description of gut microbiota responses to follow-up β-lactam therapy. The results demonstrate that ABs targeting specific pathogenic infections and diseases may alter gut microbial ecology and interactions with host metabolism at a much higher level than previously assumed.
- Colonic Microflora
- Antibiotic Therapy
- Meta-Analysis
- Gastrointestinal Function
- Gene Expression
This is an Open Access article distributed in accordance with the Creative Commons Attribution Non Commercial (CC BY-NC 3.0) license, which permits others to distribute, remix, adapt, build upon this work non-commercially, and license their derivative works on different terms, provided the original work is properly cited and the use is non-commercial. See: http://creativecommons.org/licenses/by-nc/3.0/
Statistics from Altmetric.com
Significance of this study
-
What is already known on this subject?
-
Changes in gut microbiota have been shown to be associated with antibiotic (AB) usage.
-
Broad-spectrum ABs result in a significant reduction in Bacteroidetes and a concurrent increase in Firmicutes.
-
The understanding of the dynamics and mechanisms underlying functional changes in the microbiome in response to AB treatments remains limited.
-
What are the new findings?
-
AB treatment provoked apparently oscillatory population dynamics with major changes at the level of gut microbiota metabolism and total and active microbial fraction compositions at days 6, 11 and 14, respectively, after the initiation of the therapy.
-
ABs have ecological implications related to the energy metabolism of colonic bacteria, which partially improved at day 6 to cope with an intermittent nutrient supply and AB stress but decreased at later stages and after treatment cessation.
-
Although no abundant bacteria can be very active at a given moment in the presence of ABs, minor community members play a significant active role in overall gut metabolism and host interactions.
-
How might it impact on clinical practice in the foreseeable future?
-
The treatment of patients with ABs targeting specific pathogenic infections and diseases might influence the global metabolic status of gut microbes in such a way that could affect human biology. Integrative omics approaches represent a promising strategy for preventing metabolic diseases associated with AB uptake during therapeutic and clinical interventions.
Introduction
The human colon harbours a vast ensemble of microbes that carry out vital processes for human physiology and nutrition, and the microbes in this complex ecosystem are defined as the microbiota. Accordingly, the human colon can be viewed as an anaerobic bioreactor in which trillions of microorganisms add a vast catalogue of genes to the genetic resources of the host to provide complementary metabolic pathways for energy harvest, food digestion, detoxification, the production of bioactive compounds and the assimilation of otherwise inaccessible dietary nutrients.1–5 Recent studies have shown that each individual harbours a unique and relatively stable gut microbiota, generally dominated (over 90%) by the Bacteroidetes and Firmicutes, in addition to minorities of Actinobacteria, Proteobacteria and Verrucomicrobia, the majority of which have not yet been isolated or characterised.6 However, this well engaged bacterial machinery can be disrupted by external factors such as antibiotic (AB) treatment.7–9 AB therapy has been successfully used for many years to treat bacterial infections, but the emergence of AB-resistant bacteria has caused enormous public health problems. Moreover, resistant species can persist in the human gut for years.7 ,10–12
AB therapies affect not only the target microorganism but also the host-associated microbial communities, particularly those in the intestine. In recent years, the effects of distinct ABs on the gut microbiota have been evaluated, primarily by 16S rRNA analysis.7 ,10 ,11 ,13–16 The patterns of microbial diversity and gene-encoded functions are highly intricate,11 and contradictory reports on the compositions of microbial communities have complicated the identification of functional and molecular hotspots associated with AB therapy in humans. Recent experiments have revealed that treatment with broad-spectrum ABs affects the microbiota composition, resulting in a significant reduction in Bacteroidetes and a concurrent increase in Firmicutes.13 Moreover, different studies have reported bacterial resilience following AB treatment.11 ,14 ,15 ,17
The understanding of the dynamics and mechanisms underlying functional changes in the microbiome in response to AB treatments remains limited, primarily because most research to date has relied on indirect evidence from DNA-based approaches that fail to provide information on actual gene expression, protein synthesis and metabolite composition and variation. Moreover, no integrated metatranscriptomic, metaproteomic or metametabolomic surveys on AB-treated human microbiota have been performed. Specifically, in the gut ecosystem, few studies have focused on metatranscriptomics. Turnbaugh et al 18 focused on gene expression analysis in faecal samples from a monozygotic twin pair, whereas Booijnk et al 19 and Gosalbes et al 20 studied the faecal metatranscriptomes of healthy volunteers using cDNA amplified fragment length polymorphism and pyrosequencing, respectively. Proteomic platforms have also been used to separate and identify thousands of proteins in faecal samples from healthy individuals,21–24 but these analyses have not uncovered the effect of ABs on the stability or expression of core proteins or their functions. Finally, metabolic changes in mouse—but not human—gut microbiota following treatment with the broad-spectrum AB enrofloxacin were recently evaluated using nuclear magnetic resonance based metabolomics.25 However, this study yielded limited information because the faecal samples were only analysed for changes in eight metabolites, including increased levels of amino acids and urea caused by the loss of microbial proteases and ureases, and reduced levels of acetate, butyrate and propionate generated by lactate-using bacteria.
In this study, we provide the first report of AB-treatment related changes in the faecal microbiota, including the total microbiota, active microbiota, metagenome, metatranscriptome, metametabolome and metaproteome. This multi-omics approach yielded a global picture of the microbial community structure and the metabolic status of the gut ecosystem, which is paramount to understanding the total effect of a given AB and to establishing correlations with host physiology. This study of one patient constitutes a proof of concept for this approach.
Materials and methods
Fresh faecal samples were collected from a patient who had not taken ABs within the previous 3 months. The patient (a 68-year-old man) was admitted to the Department for Internal Medicine at the University Hospital Kiel (Germany) due to an infected cardiac pacemaker. A clinical examination identified inflamed skin and subcutaneous tissue around the pacemaker, and laboratory findings revealed an elevated C-reactive protein level (CRP 19.7 mg/litre; normal value <8 mg/litre) and a full blood count within normal ranges. The patient did not present any intestinal disorders. The pacemaker had been placed to treat the patient's sick sinus syndrome, first diagnosed in 1994. His cardiovascular risk factors were arterial hypertension and non-insulin-dependent diabetes mellitus. The patient was regularly taking amlodipine, ramipril, hydrochlorothiazide and glimepiride on a daily basis and Marcumar according to his international normalised ratio values. AB therapy was initiated with a combined intravenous therapy of ampicillin/sulbactam and cefazolin on the day of admission as a single dose and continued with intravenous cefazolin alone for the next 14 days. The patient's CRP level returned to normal within 1 week after the beginning of AB therapy. Faecal samples were collected on the day of admission, prior to AB treatment (day 0, FS-0), on days 3, 6, 11 and 14 of AB treatment (FS-3, FS-6, FS-11 and FS-14, respectively) and 40 days after AB therapy (FS-40). Fresh faeces were collected, frozen immediately and stored at −80°C until further processing. Informed consent was obtained from the patient, and the study was approved by the Ethical Board of the Medical Faculty of the Christian-Albrecht-University, Kiel, Germany. The patient provided written informed consent. Full descriptions of the materials and methods used for the following are available in the Materials and Methods in the online supplement: nucleic acid and RNA extraction; 16S rDNA and 16S rRNA sequencing; metagenome sequencing; mRNA purification, amplification and sequencing; metagenomic and metatranscriptomic analysis; protein extraction, separation and identification and data processing; and metabolite extraction, separation and identification and data processing. All sequences have been entered in the European Bioinformatics Institute database, under accession number ERP001506.
Results
Total and active faecal microbiota
We used 16S rDNA and 16S rRNA analyses to characterise the total bacteria (16S rDNA) and metabolically active bacteria (16S rRNA), respectively, in each faecal sample.26–28 As shown in figure 1, there were large fluctuations in the relative abundances of the various bacterial taxa in the total and active microbiota throughout the follow-up study. In the first days of treatment, the majority of the total microbiota comprised species from the phylum Firmicutes, with the exception of FS-11 (11 days after AB treatment), which exhibited a remarkable shift towards Bacteroidetes (Parabacteroides and Bacteroides genera) and a significant increase in Betaproteobacteria (figure 1 and figure 1 in online supplement). The Lachnospiraceae and Ruminococcaceae families constituted the most abundant taxa on days 3 and 6 of AB treatment. Meanwhile, the Firmicutes represented the most abundant active phylum in most samples. However, the shift towards the Bacteroidetes was even more distinct and occurred later, at the 14th day (FS-14) of AB treatment, among the active bacteria, with the Parabacteroides genus (74%) being the predominant taxa.
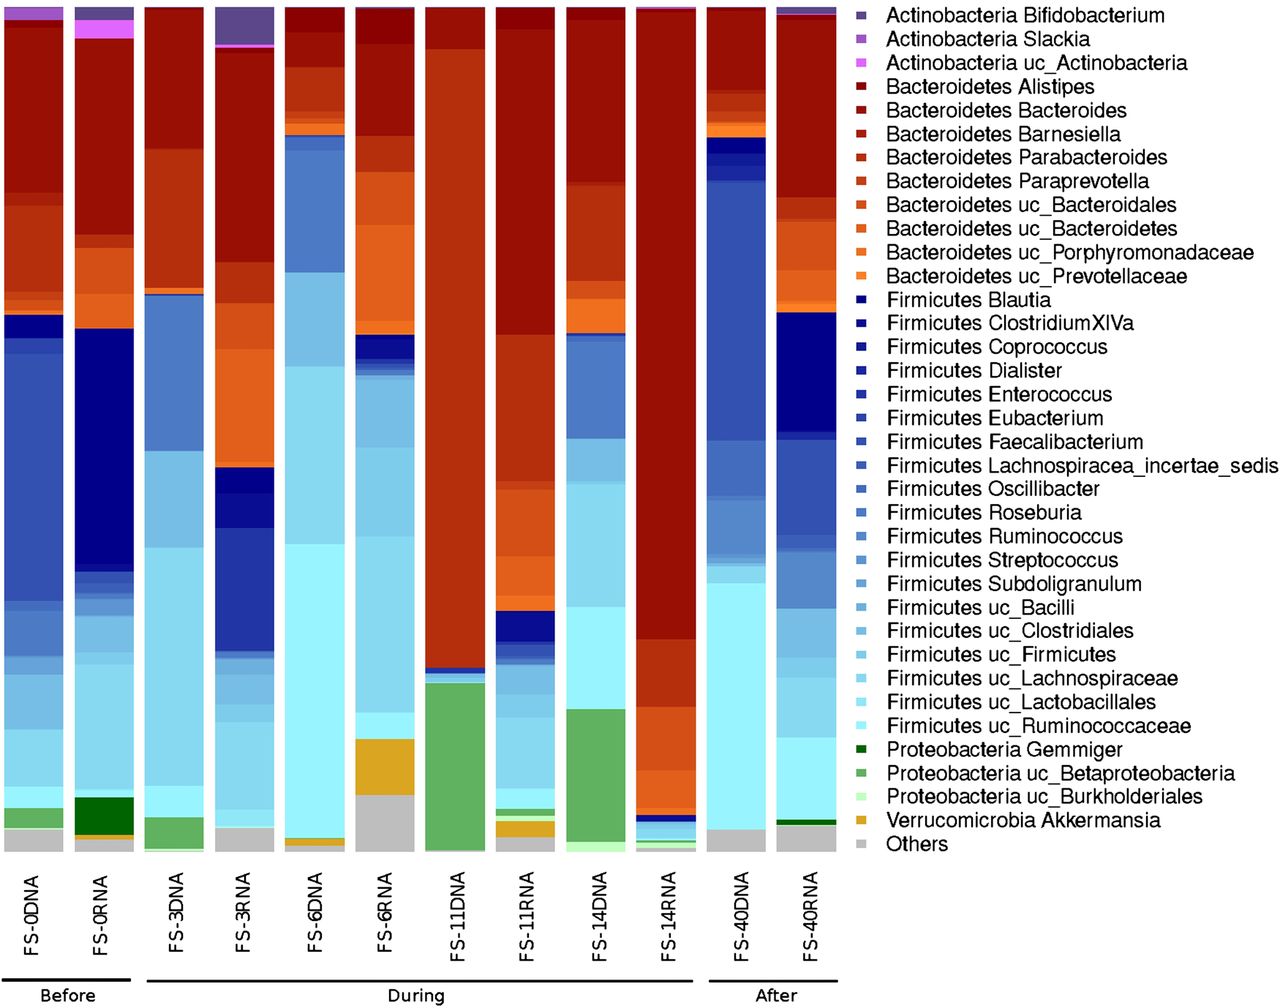
Total and active bacterial composition based on 16S rDNA and 16S rRNA analyses, respectively, in the follow-up study. Samples FS-0, FS-3, FS-6, FS-11 and FS-14 correspond to the materials collected on days 0, 3, 6, 11 and 14 of antibiotic (AB) treatment, respectively. The FS-40 sample corresponds to the materials collected 40 days after cessation of the AB treatment.
As shown in figure 1, there was a general tendency towards the restoration of the original (day 0) untreated total and active bacterial composition at 40 days after cessation of the AB treatment. However, certain taxa, such as Actinobacteria (Slackia and Bifidobacterium genera), Betaproteobacteria (Gemmiger genus), Streptococcaceae (Streptococcus genus), Lachnospiraceae (Roseburia genus), Porphyromonadaceae (Barnesiella genus) and Clostridiales (Eubacterium and Subdoligranulum genera) were lost. The heat map and clustering analysis (see figure 1 in online supplement) results support the restoration of the microbiota because untreated samples clustered together regardless of whether we considered the total bacterial composition or the active bacterial composition. The results of a correspondence analysis of the relative abundance of each taxon in the total and active microbiota fractions are shown in figure 2 in the online supplement. Approximately 55.90% of the total variation can be bundled in two axes (CA1 and CA2), each of which contributed a similar degree of variation. CA1, bundling 23.81% of the variation, indicates how divergent a given sample is from the average abundance of taxa, whereas CA2, bundling 22.09% of the variation, clearly differentiates the composition of the total (DNA) and active (RNA) microbiota. Moreover, the active microbiota clearly behaved in a more homogeneous manner than the total microbiota, and samples FS-40 and FS-11 exhibited the most divergent microbiota among the samples analysed.
As shown using the Chao1 richness estimator (table 1), the diversity of the total bacterial community decreased during AB treatment and reached a minimum value after 11 days of AB treatment (FS-11). At this time point, the microbiota also exhibited a lower Shannon index value, indicating that there were fewer and more heterogeneously distributed bacterial families in the FS-11 sample compared with the other samples (figures 1, and figures 1 and 2 in online supplement). Interestingly, the biodiversity evenness and richness of the active bacteria remained essentially uniform until the 14th day of treatment (FS-14), at which time there was a marked decrease in bacterial taxa and richness.
Biodiversity measures of total and active microbiota
At the species level, the principal component analysis (PCA) showed that the total bacterial community (16S rDNA) profiles of samples FS-0 and FS-40 differed from those of the other samples (see figure 3 in online supplement). Together, the two axes projected 69% of the total variance in the data. Fourteen operational taxonomic units (OTUs) responsible for the differences between the samples were identified by the lengths of their vectors in the PLS-DA (see figure 4 in online supplement). Before and after AB treatment, OTUs with homology to Faecalibacterium prausnitzii and Blautia wexlerae, belonging to the phylum of Firmicutes, were highly abundant. However, Enterococcus durans, an abundant OTU in FS-3, FS-6 and FS-11, was absent in the FS-0 and FS-40 samples. Furthermore, we observed an increase in OTUs with homology to different species of Bacteroides and Parabacteroides such as B fragilis, P merdae, B dorei, P distasonis, B uniformis and B ovatus in the FS-11 and FS-14 samples. Thus, during AB therapy, the relative abundance of Bacteroidetes increased, whereas OTUs with homology to Firmicutes regained their dominance after cessation of the AB.
Abundance and diversity of gene transcripts by metatranscriptome analysis
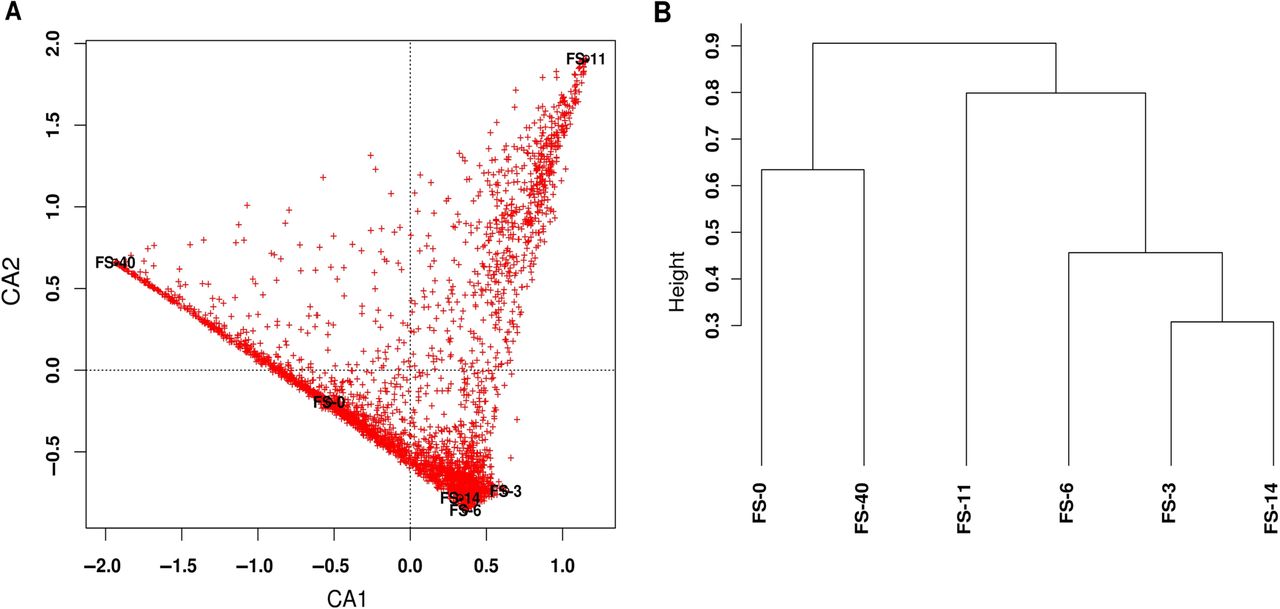
To identify the major regulated pathways and processes under AB pressure, we evaluated the microbiota-regulated genes (mRNAs) (see table 1 in online supplement).29 ,30 Figure 2A shows the correspondence analysis for the expressed genes in each sample, independent of the gene functions. The two axes, CA1 and CA2, bundle 39.91% and 33.12% of the total observed variation, respectively, which represents a substantial percentage (73.03%) of the total variation. The mRNA transcript contents of samples FS-6 and FS-40 were clearly distinct (figure 2B). Moreover, at the expression level, a drastic shift occurred on the 6th day of AB therapy, and the initial profile was recovered on the 14th day.
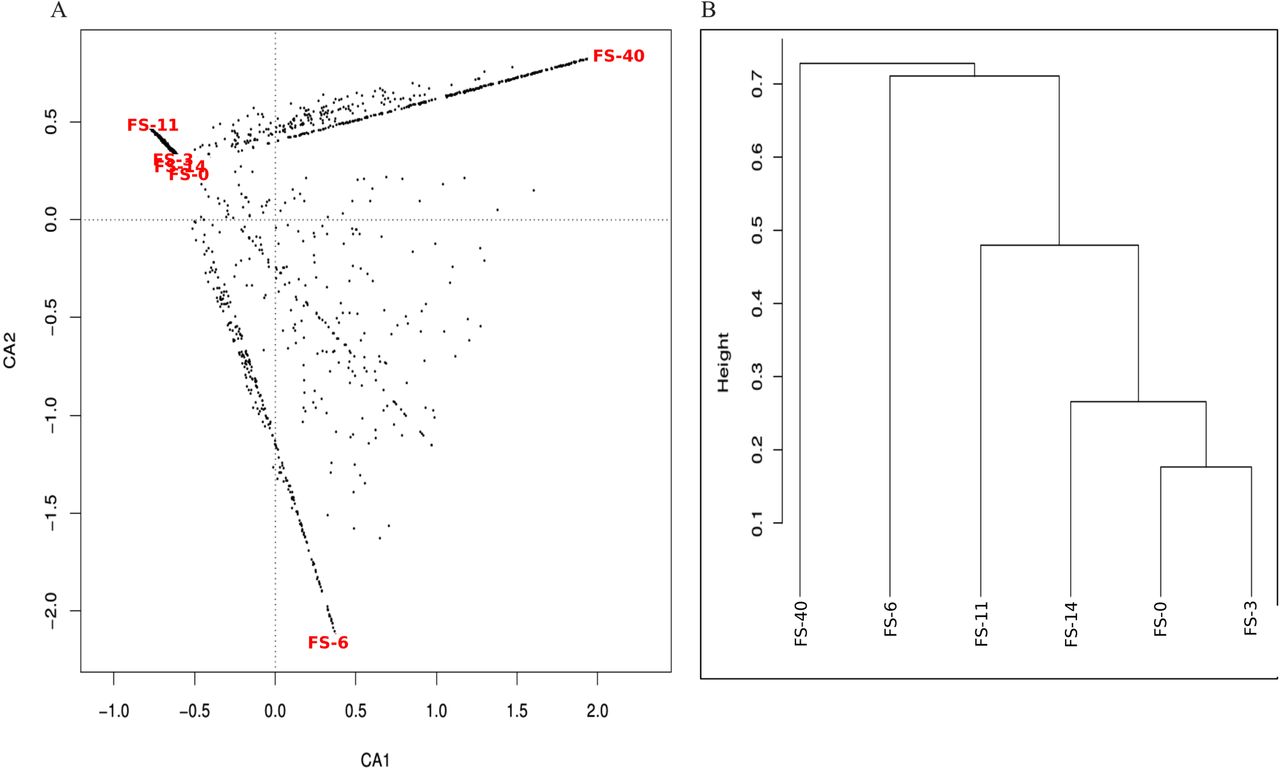
(A) Correspondence analysis of the expressed genes in each sample. (B) Clustering of the samples based on the type and abundance of expressed genes, applying the Bray–Curtis distance.
Using a self-organising map package,31 the gene expression profiles were analysed and yielded six groups (figure 5 in online supplement). The genes included in clusters 0 and 1 exhibited increased expression only on the 3rd day following AB treatment and returned to basal levels at later stages of the treatment. These genes were functionally categorised to have roles in protein transport and binding (potassium uptake protein, TonB-dependent receptor, nitrile hydratase propeptide microcin bacteriocin system ATP-binding cassette transporter, peptidase/ATP-binding protein), toxin production and resistance (resistance-nodulation-cell division superfamily and hydrophobe/amphiphile efflux-1 transporters), detoxification (heavy metal efflux and CzcA permeases), mobile and extrachromosomal elements (phage lambda tail tape measure protein) and protein fate determination (TolC type I secretion outer membrane protein). Genes belonging to clusters 2, 3 and 4 (DNA metabolism/DNA replication, recombination and repair, protein fate/protein and peptide secretion and trafficking and protein synthesis/tRNA and rRNA base modification) presented a more uniform profile before, during and after AB treatment. The genes in cluster 5 remained constant but exhibited a relatively higher expression level on the 14th day following the beginning of AB treatment, returning to the basal level after the discontinuation of AB treatment; these genes functioned in molecule renewal and transport (proteins, peptides, amino acids, polysaccharides, purines, purine ribonucleotides, pyrimidines and glycopeptides (bio)synthesis, secretion, trafficking, transport, binding and/or degradation) and DNA metabolism/DNA replication, recombination, and repair and cellular processes related to sporulation and germination.
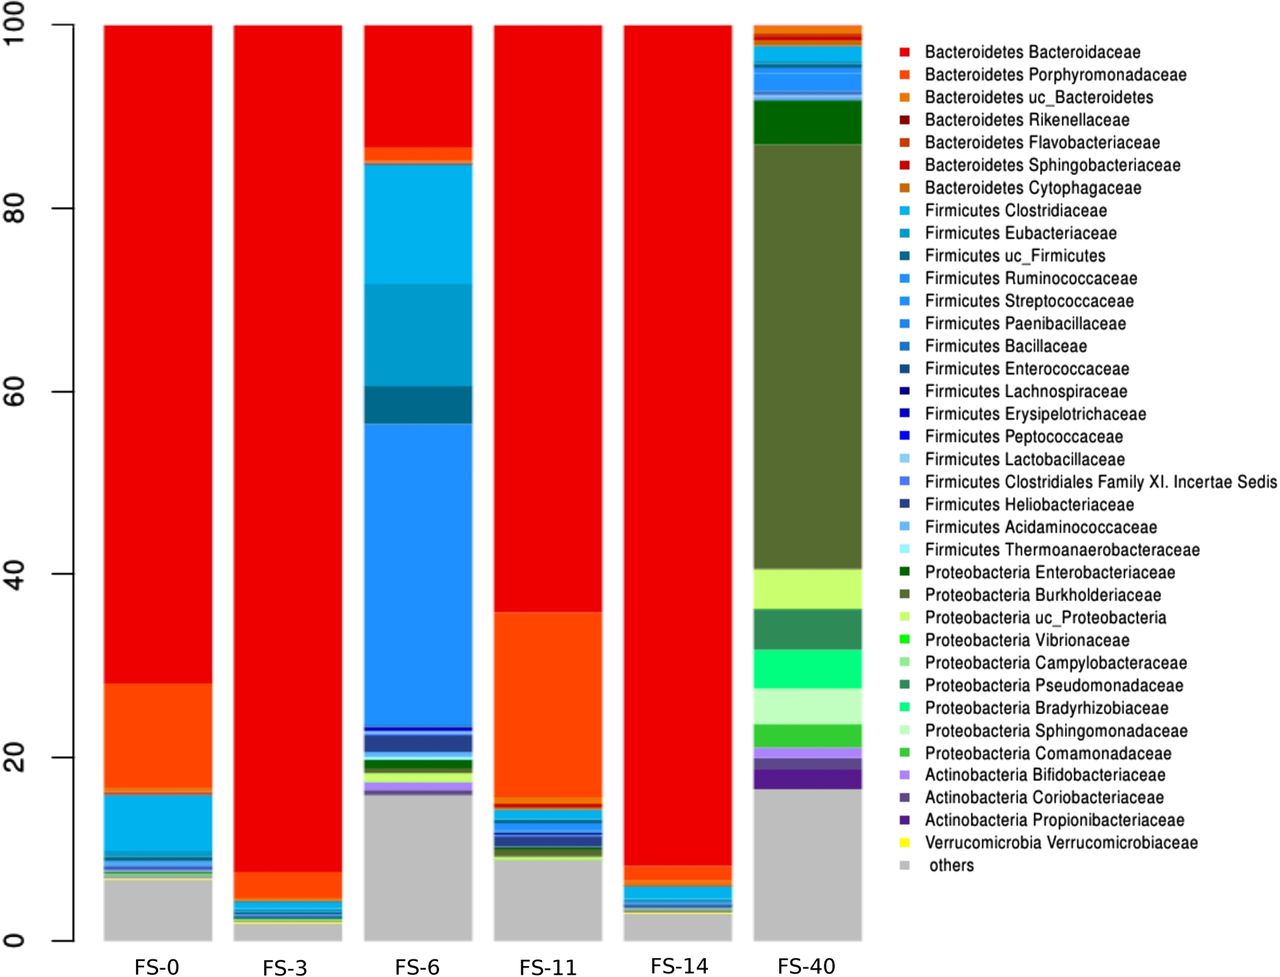
As illustrated in figure 3, the taxonomic assignment of expressed genes showed that the compositions of the FS-6 and FS-40 samples were clearly different. The FS-6 sample contained primarily Streptococcaceae (27%), Clostridiaceae (13%) and Bacteroidaceae (13%). In the FS-40 sample, Burkholderiaceae (46%) (phylum Proteobacteria) were the most abundant, despite the low abundance of 16S rRNA from these organisms (figure 1). However, in the other samples (FS-0, FS-3, FS-11 and FS-14), the Bacteroidaceae family was the major taxon responsible for the observed gene expression. This family contains genera, such as Parabacteroides and Bacteroides, that are resistant to ampicillin and cephalosporins, as previously reported.32 These results account for the three clusters shown in figure 2B.

Taxonomic assignments of mRNAs for each sample according to the lowest common ancestor algorithm.
We statistically evaluated the changes in gene expression following treatment according to various functional categories by applying a regression analysis in the ShotgunFunctionalizeR package.33 The categories that demonstrated significant changes in expression during treatment are shown in figure 6 in the online supplement. Samples FS-6 and FS-40 exhibited major differences, whereas the rest of the samples were more closely related. This observation was further supported by the correspondence analyses (see figure 7 in online supplement), in which the first two axes, CA1 (56.72%) and CA2 (34.13%), accounted for 90.85% of the total variation.
Abundance and diversity of metabolites by metametabolome analysis
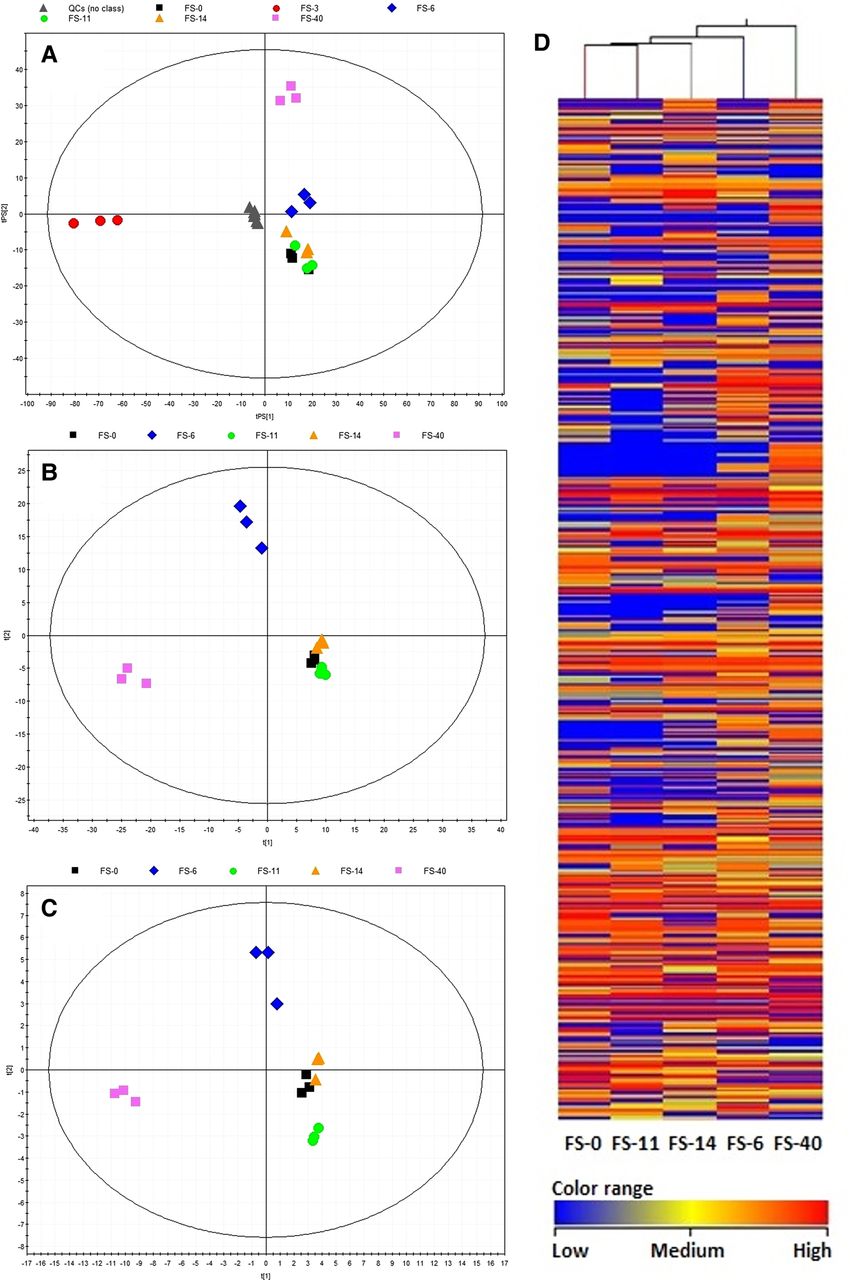
The metabolite contents (type and abundance) of samples FS-6 and FS-40 were clearly different (figure 4), consistent with the correspondence analysis of the observed gene expression (figure 2). Of the 382 different features identified (29 being common), the FS-40 sample revealed the greatest number (280) of associated mass features, followed by the FS-6 sample, with 234 features (see figures 8 and 9 in online supplement); FS-14 (185), FS-11 (121) and FS-0 (139) showed fewer features. According to the probability of match with the isotopic pattern shown in table 2 in the online supplement, 49 distinct common features were tentatively identified. Based on their abundance level, five groups of molecules were established (see figure 12 in online supplement). Most long-chain fatty acids and peptides exhibited increased abundance on the 6th day (sample FS-6) as well as after the discontinuation of AB treatment (FS-40); they included two masses corresponding to putative sphingolipid-related compounds, such as C17 sphinganine and dihydroceramide C2, six unsaturated fatty acyls, two fatty acid amides, a lysophosphatidic acid and a tri-peptide formed by Asp/Ile/Phe, Asp/Leu/Phe or Phe/Glu/Val. Most of the putative glycerol(lyso)phospholipids (including five putative glycerophospholipids and fatty acid carnitines) exhibited increased abundance on the 11th and 14th days, but significantly decreased (from 4 to 20 000 fold) after the discontinuation of AB treatment. Finally, nine putative human-associated derivatives of cholesterol, the cholesterol-precursor vitamin D, bile acids, prostaglandins and sterol lipids appeared only after AB treatment (FS-40), with production levels of up to six orders of magnitude higher than that of samples before and during AB therapy.

Partial least-squares discriminant analysis score plots and clustering analysis of metabolite profiles after different comparisons. (A) The whole dataset (8600 features) with the prediction for quality control (QC) samples, seven components, R2=0.989, Q2=0.670; the robustness of the analytical procedure was demonstrated by the tight clustering of the QC samples. (B) Discriminant variables identified by comparing samples in a pairwise fashion (382 discriminant features from 988 of the 4349 initial variables that were present in all three replicates of samples from any group), four components, R2=0.978, Q2=0.928. (C) Statistically significant variables identified in the METLIN database (49 features), four components, R2=0.968, Q2=0.915. (D) The effect of antibiotics on the human gut microbiota, as determined by a two-way hierarchical clustering analysis of the metabolite profiles. Hierarchical clustering was performed with a matrix of the total masses that passed the filtering and statistical treatments for each sample. Less abundant masses in a given community are shown in blue, whereas more abundant masses are shown in red. Note: sample FS-3 was discarded from the analysis due to the presence of faecal material in the cell extracts.
Abundance and diversity of proteins by metaproteomic analysis
A total of 3011 proteins (1359 common) were unambiguously quantified (see table 3 and figure 10 in online supplement). Considering a threshold of at least 1.5 and −1.5 log2 ratios of abundance levels, we observed that AB treatment reduced the number of highly abundant proteins compared with the control sample (FS-0) over time but promoted the number of low-abundance proteins (figure 5), with the FS-40 sample containing the lowest number of high-abundance proteins and the highest number of low-abundance proteins. Samples FS-11 and FS-40 exhibited clearly different protein expression profiles based on the correspondence (figure 6A) and clustering (figure 6B) analysis of differentially expressed proteins (figure 6A), which was corroborated by the corresponding functional analysis (see figure 11 in online supplement). These results suggest the restoration of the microbiota because untreated samples (FS-0 and FS-40) clustered together, indicating that the initial profile was recovered at the end of the treatment despite the drastic shift that occurred on the 11th day (see table 1 in online supplement), consistent with the analysis of the total and active bacterial compositions (figure 1).

Number of quantified proteins showing either high (black bars) or low (white bars) abundance levels relative to the proteins identified in sample FS-0. Only proteins with values ≥1.5 or ≤-1.5 log2 ratios were considered.

(A) Correspondence analysis of the expressed proteins in each sample. (B) Clustering of the samples based on the type and abundance of expressed proteins, with Pearson's correlation applied to calculate the distances. The two axes, CA1 and CA2, in (A) bundle 33% and 28% of the total observed variation, respectively.
According to the lower and over-representation of functional gene categories (clusters of orthologous groups; COGs), we found a rather stable distribution between the samples, with significantly different contributions from only 29 out of 494 COGs. As shown in figure 7, we observed specific differences that clearly indicated drastic shifts on day 6 of AB therapy (FS-6) and after treatment cessation (FS-40) of proteins assigned to 23 distinct COGs within the functional categories of glycolysis, pyruvate and glutamate metabolism, iron uptake and translation (figure 7A–C); a transient increase in expression at day 6 was followed by depletion during and after the follow-up period. AB-treated samples were also characterised by a striking depletion of the translation elongation factors required for protein synthesis, such as GTPases, which facilitate the release of nascent polypeptide chains; this depletion was accentuated after treatment cessation (figure 7B). By contrast, samples taken during AB treatment were characterised by an enrichment of antimicrobial peptide transporters and multidrug efflux pumps that peaked on the 3rd day of AB treatment (figure 7D) and were absent in untreated samples (FS-0 and FS-40). Additional key proteins, such as aerobic CobN cobaltochelatases (COG1429) essential for the biosynthesis of vitamin B12, were also found to be depleted (see table 3 in the online supplement) in samples FS-3, FS-11 and FS-14 compared with untreated samples.

Graphical representation of the high-abundance and low-abundance proteins in different pathways, according to the clusters of orthologous group (COG) number assigned to each protein. (A) Rubrerythrin/ferritin COGs: COG1592 (rubrerythrin) and COG1528 (ferritin-like protein). (B) Translation factor and translation enzyme COGs: COG0193 (peptidyl-tRNA hydrolase), COG0264 (translation elongation factor Ts), COG0050, COG0532 (GTPases—translation elongation factors), COG0216 (protein chain release factor A), COG0480 (translation elongation factors (GTPases)) and COG0231 (translation elongation factor P/translation initiation factor 5A). (C) Glycolysis, pyruvate, glutamate and other related COGs: COG0126 (3-phosphoglycerate kinase), COG0205 (6-phosphofructokinase), COG0148 (enolase), COG0076 (glutamate decarboxylase and related proteolipid protein-dependent proteins), COG1830 (DhnA-type fructose-1,6-bisphosphate aldolase and related enzymes), COG0334 (glutamate dehydrogenase/leucine dehydrogenase), COG1053 (succinate dehydrogenase/fumarate reductase, flavoprotein subunit), COG0588 (phosphoglycerate mutase 1), COG0479 (succinate dehydrogenase/fumarate reductase, Fe-S protein subunit), COG0191 (fructose/tagatose bisphosphate aldolase), COG0149 (triosephosphate isomerase), COG0166 (glucose-6-phosphate isomerase), COG0057 (glyceraldehyde-3-phosphate dehydrogenase/erythrose-4-phosphate dehydrogenase) and COG0469 (pyruvate kinase). (D) Antimicrobial transporters, multidrug efflux pumps and other transporter COGs: COG0841 (cation/multidrug efflux pump), COG2825 (outer membrane protein), COG3292 (predicted periplasmic ligand-binding sensor domain), COG3264 (small-conductance mechanosensitive channel), COG1538 (outer membrane protein) and COG1629 (outer membrane receptor proteins). Only proteins with values ≥1.5 or ≤-1.5 log2 ratios were considered.
Discussion
The effects of ABs and the mechanisms underlying the connection between AB treatment and microbial gut metabolism require clarification, which can only be achieved through an integrated approach that goes well beyond the 16S DNA analysis that has been the cornerstone of previous research in this area. Thus, the aims of this study were as follows: to provide a proof of concept for an integrated workflow to assess the nature of such changes in the intestines of patients undergoing AB treatment at the structural and functional levels; and to evaluate whether there is a relationship between these types of changes. For instance, changes in the total composition at a given time point may also be associated with changes in the AB-resistant bacteria, although not necessarily at the same moment or during the same interval. Two major active factors that modulate changes in the microbiota should be considered. First, it is important to understand how AB treatment determines the emergence of bacterial species that are resistant to β-lactams (such as ampicillin and cephalosporins) and how the microbiota recovers once ABs have been removed. Second, the speed at which such changes are observed according to the different levels under consideration should be carefully evaluated.
In our study, we demonstrated that the greatest change in the active microbial fraction occurred later (day 14) than that in the total microbial fraction, which reached a minimum biodiversity and richness on the 11th day of AB treatment (figure 1). Further, oscillatory population dynamics were observed (at both the DNA and RNA levels). An early reduction in Gram-negative bacteria at day 6 and an overall collapse in diversity was followed by possible colonisation of the upper gut by naturally resistant Bacteroidetes by day 11, a consequent increase in the colonisation of the lower gut with dominance at 11–14 days and eventual re-growth of the Gram-positive bacteria at day 14. Various studies based on 16S rDNA analysis revealed important variability in the recovery of the baseline bacterial composition after AB therapy depending on the individual and the AB used (type and dose).11 ,14 ,15 The large fluctuations in the relative abundances of the various bacterial taxa for the total and active microbiota throughout the follow-up study were most likely associated with an additive effect of ampicillin/sulbactam and the first-generation cephalosporin cefazolin as well as the widespread development of β-lactamases (for details, see the Discussion in the online supplement).13
The apparent oscillations in the population dynamics were shown to further influence the biodiversity and richness of metabolites and active proteins; these changes, some of which may play essential roles in protection against ABs (for details, see the Discussion in the online supplement), may also have important ecological implications. In our study, we observed a drastic shift 6 days after the onset of AB treatment, at which time the predominantly active taxa were mainly members of the Streptococcaceae, Clostridiaceae and Bacteroidaceae, and at 40 days after the end of AB treatment, when the most abundant active bacteria were members of the Burkholderiaceae (Proteobacteria phylum). Thus, these bacteria may have contributed to the distinct functional profiles and metabolic statuses of colonic bacteria during the follow-up therapy.
A notable finding in this study was that protein expression appeared to decrease as a consequence of AB treatment; furthermore, the production of proteins needed for glycolysis, pyruvate decarboxylation, the tricarboxylic acid cycle, glutamate metabolism, iron uptake, GTP hydrolysis and translation termination were enhanced at the initial stages of AB treatment (day 6), most likely to cope with an intermittent nutrient supply and the stress caused by the ABs, but decreased at later stages and after treatment cessation. Together, these results suggest for first time that AB treatment may ‘presumptively’ negatively affect the overall metabolic status of the colonic space (for an example, see the Discussion in the online supplement), although further studies may be required to further confirm this hypothesis. Additionally, the expression levels of all the genes belonging to the ‘mobile and extrachromosomal element functions’ category were decreased during treatment, and all of them were associated with clustered regulatory interspaced short palindromic repeats (CRISPRs). These genes encode a system that functions as a type of bacterial adaptive ‘immune’ response.34 Specifically, the genes that belong to the CRISPR/Cas system are involved in protecting cells from invasion by foreign DNA (viruses and plasmids) through an RNA-interference-like process.35 Thus, the decreases in the expression of these genes may render the bacteria more susceptible to the acquisition of foreign DNA. This could provide an advantage in an AB-containing environment because it increases the likelihood of obtaining resistance genes by horizontal gene transfer.
Of major metabolic significance was the observation that the production of metabolites that are known to be produced by the host and further metabolised by colonic bacteria, such as derivatives of bile acids, cholesterol and hormones, was altered during the AB treatment and was significantly improved after treatment cessation. In essence, this finding suggests that AB treatment altered the continual interplay between the liver/pancreas and bacterial enzymes operating in the colonic space and that AB therapy may have a positive long-term effect in human biology. This result is consistent with the finding that the biological production of host-beneficial molecules such as vitamin B12 and the uptake of key metals such as Co2+ by colonic bacteria were affected by AB therapy because the expression of genes and proteins associated with those functions was restored after treatment cessation. This is particularly important because it has been demonstrated that the microbiota from the distal guts of different individuals exhibit partial functional redundancy in addition to clear differences in community structure in the absence of ABs.36 By contrast, although further experimental evidence is required, our results suggest that the presence of ABs per se may have additional ‘presumptive’ collapse effects in key metabolic pathways independent of the community structure and that functional replacement events may be affected under AB stress.
Although, the investigation reported here was for a single patient and should generally be considered qualitative, it constitutes a proof of concept for an integrated, multi-omics approach towards unravelling the dynamics and mechanisms underlying the response of intestinal microbiota to AB treatment. A ‘presumptive’ model related to the follow-up effects of ABs on bacterial and metabolic composition is summarised in figure 8. These data may help to identify specific strains of gut microbiota with potential benefits in human health or to design specific therapies to decrease intestinal inflammation or normalise dysfunctions of the gut mucosa; for example, minor bacterial taxa such as Proteobacteria have been shown to play a significant, active role in overall gut metabolism and host interaction despite their low number. Further studies investigating different ABs and (un)related individuals are required to better ascertain the link between bacterial producers and the presence of particular proteins and molecules, and the metabolic consequences of AB treatment; this may serve as a promising focus for therapeutic interventions or the treatment of pathogenic infections and diseases.

The ‘presumptive’ model related to the follow-up effect of antibiotics (ABs) on the microbial and metabolic composition of the human gut. The model is based on the combination of experimental multi-omics data. The biliary excretion of ABs triggers a cascade of metabolic events. At the earlier stages of AB therapy, the bacteria respond by promoting systems to avoid the antimicrobial effects of the drugs (expressing beta-lactamases, antimicrobial peptide transporters and multidrug efflux pumps and producing glycero(lyso)phospholipids—G(L)PL) and to cope with an intermittent nutrient supply while decreasing polysaccharides and lipopolysaccharide (LPS) production. Genes involved in cell envelope biosynthesis and the degradation of peptidoglycan-like components are increasingly expressed until the end of AB treatment but with a time delay compared with other drug-detoxifying mechanisms. Finally, the bacterial metabolism of the bile acid, hormones and cholesterol synthesised in the liver and pancreas is attenuated by AB therapy, thus possibly affecting entero-hepatic recirculation and systemic lipid metabolism, that is, the emulsification, absorption and transport of dietary fats; however, after treatment cessation, the metabolism of these factors improved significantly. Similarly, the pool of vitamins that are directly synthesised by gut bacteria was significantly improved after treatment cessation. The nutrient supply mechanisms, such as glycolysis, pyruvate decarboxylation, tricarboxylic acid (TCA) cycle, glutamate metabolism, and iron uptake, that are induced at earlier stages (day 6) become attenuated during the late stages of the therapy and become significantly attenuated after treatment cessation, suggesting that the entero-hepatic recirculation system may contain a lower amount of iron, sugars, branched amino acids, short organic acids and pyruvate produced or transported by colonic bacteria. At the active bacterial structure level, an apparently oscillatory population dynamic was further observed, with the initially predominant active Bacteroidaceae becoming replaced by Burkholderiaceae after treatment cessation. The broken line indicates the overall trend in each of the gut bacteria components during the follow-up treatment.
Acknowledgments
We thank Loreto Ferrús and Manuela Kramp for their excellent laboratory work.
References
Supplementary materials
Supplementary Data
This web only file has been produced by the BMJ Publishing Group from an electronic file supplied by the author(s) and has not been edited for content.
Files in this Data Supplement:
- Data supplement 1 - Online supplement
Footnotes
-
Contributors The authors made the following contributions to the study. Conceived and designed the experiments: AEP-C, MJG, AF, HK, DR, CB, JS, VMS, SJO, MF and AM. Performed the experiments: AEP-C, MJG, HK, AA, KE, WO, DR, SCN, CD, F-AH, JS and MF. Analysed the data: MJG, AEP-C, AA, AF, HK, WO, RB, F-AH, AL, CB, JS, MF and AM. Contributed reagents/materials/analysis tools: AEP-C, AA, MJG, AF, HK, WO, DR, RB, MVB, F-AH, CB and JS. Wrote the paper: MJG, MF and AM. MJG, AF, SJO, MF and AM contributed equally.
-
Funding The whole consortium was funded by the Spanish Ministry of Economy and Competitiveness (formerly MICINN) and German BMBF within the ERA NET PathoGenoMics2 programme, grant number 0315441A. This work was further funded by grants BFU2008-04501-E/BMC, SAF2009-13032-C02-01, SAF2012-31187 and CSD2007-00005 from the Spanish Ministry of Economy and Competitiveness (formerly MICINN) and Prometeo/2009/092 from Generalitat Valenciana (Spain). The authors gratefully acknowledge the financial support provided by the European Regional Development Fund (ERDF). Vitor Martins dos Santos acknowledges support by the EU, FP7 project Microme (grant 222886-2). David Rojo received a fellowship from the Spanish Ministry of Economy and Competitiveness (formerly MICINN). MvB and JS acknowledge funding by the IFB Adiposity Disease, Leipzig. AEP-C is recipient of a fellowship from Instituto de Salud Carlos III, Spain.
-
Competing interests None.
-
Patient consent Obtained.
-
Ethics approval Ethical Board of the Medical Faculty of the Christian-Albrecht-University, Kiel, Germany.
-
Provenance and peer review Not commissioned; externally peer reviewed.
-
Data sharing statement There are no unpublished data related to this study. The whole dataset has been included here.