Article Text

Abstract
Objective Colorectal cancer (CRC) is a major contributor to cancer mortality and morbidity. LIM kinase 2 (LIMK2) promotes tumour cell invasion and metastasis. The objectives of this study were to determine how LIMK2 expression is associated with CRC progression and patient outcome, and to use genetically modified Drosophila and mice to determine how LIMK2 deletion affects gastrointestinal stem cell regulation and tumour development.
Design LIMK2 expression and activity were measured by immunostaining tumours from CRC-prone mice, human CRC cell lines and 650 human tumours. LIMK knockdown in Drosophila or Limk2 deletion in mice allowed for assessment of their contributions to gastrointestinal stem cell homeostasis and tumour development.
Results LIMK2 expression was reduced in intestinal tumours of cancer-prone mice, as well as in human CRC cell lines and tumours. Reduced LIMK2 expression and substrate phosphorylation were associated with shorter patient survival. Genetic analysis in Drosophila midgut and intestinal epithelial cells isolated from genetically modified mice revealed a conserved role for LIMK2 in constraining gastrointestinal stem cell proliferation. Limk2 deletion increased colon tumour size in a colitis-associated colorectal mouse cancer model.
Conclusions This study revealed that LIMK2 expression and activity progressively decrease with advancing stage, and supports the hypothesis that there is selective pressure for reduced LIMK2 expression in CRC to relieve negative constraints imposed upon gastrointestinal stem cells.
- ACTIN CYTOSKELETON
- CELL SIGNALLING
- GASTROINTESTINAL CANCER
- SIGNAL TRANSDUCTION
- STEM CELLS
This is an Open Access article distributed in accordance with the Creative Commons Attribution Non Commercial (CC BY-NC 3.0) license, which permits others to distribute, remix, adapt, build upon this work non-commercially, and license their derivative works on different terms, provided the original work is properly cited and the use is non-commercial. See: http://creativecommons.org/licenses/by-nc/3.0/
Statistics from Altmetric.com
Significance of this study
What is already known on this subject?
-
LIM kinases are overexpressed in some tumour types.
-
They contribute to regulation of actomyosin cytoskeletal dynamics, and hence play roles in cell motility, invasion and metastasis.
-
The possible involvement of LIM kinases in CRC is unknown.
What are the new findings?
-
LIMK2 expression and substrate phosphorylation progressively decrease with tumour stage.
-
Deletion of dLIMK in Drosophila midgut results in stem cell proliferation and organ thickening.
-
LIMK2 deletion increases mouse intestinal stem cell proliferation in vitro.
-
In the context of a mouse model of colitis-associated CRC, Limk2 deletion increases dysplasia and intestinal tumour size.
How might it impact on clinical practice in the foreseeable future?
-
This study reveals that actomyosin cytoskeleton regulators such as LIMK2 may have patterns of expression in CRC distinct from other tumour types including breast and prostate, meaning that drugs targeting the cytoskeleton would be likely to have context-dependent effects.
Introduction
Colorectal cancer (CRC) is the third most common form of the disease in men and the second most common in women worldwide, and is a major contributor to cancer mortality and morbidity. Although the possibility exists that the CRC cells of origin may be derived from reprogrammed epithelial cells or transdifferentiated bone marrow-derived cells,1 experimental evidence strongly supports the conclusion that intestinal crypt stem cells are the predominant source from which intestinal tumours emerge.2–5 Therefore, mutations or changes in gene expression observed in CRC may promote tumour initiation and growth through their effects on stem cell homeostasis.
The actomyosin cytoskeleton provides the structural underpinning that gives cells their shape and allows them to respond to changes in external physicomechanical conditions. Importantly, dynamic reorganisation of cytoskeletal structures allows tumour cells to invade local tissue and ultimately metastasise to distant sites.6 As a result, a commonly held concept is that the expression of actomyosin regulatory proteins will increase during tumorigenesis and progression. However, given the multiple roles the actomyosin cytoskeleton plays in cell homeostasis, for example, in the apoptosis of human embryonic stem cells,7 an alternative possibility is that there may be selection for reduced expression or loss of actomyosin regulators in some cancers.
The LIM kinase family consists of two members; LIM kinase 1 (LIMK1) and LIM kinase 2 (LIMK2), which play central roles in RhoGTPase regulation of the actin cytoskeleton by phosphorylating cofilin proteins on Serine3 and inactivating their filamentous actin severing activity.8 LIMK1 and LIMK2 have 50% overall identity and 70% identity in their kinase domains, and are regulated through activation loop phosphorylation by RhoGTPase effector kinases including ROCK, PAK and MRCK.8 LIM kinases act as central network hubs in the regulation of cytoskeletal dynamics and have been proposed to be attractive potential cancer drug targets.9 Consistent with a positive role in cancer, expression of LIMK1 has been reported to be elevated in breast,10 ,11 malignant melanoma12 and prostate13 tumours. However, there have been no studies reported to date that examined the expression of LIM kinases in CRC.
In this study, we found that LIMK2 expression is reduced in intestinal tumours from genetically modified mice, and in human CRC cell lines and tumours. Protein levels were progressively lower with advancing tumour grade, and reduced LIMK2 expression or substrate protein phosphorylation were each associated with shorter patient survival times. Increased LIMK2 promoter methylation was observed in tumours relative to patient matched normal tissue. Using genetic methods, we identified a repressive role for LIMK2 in intestinal stem cell proliferation in Drosophila melanogaster and in mice. Using a mouse model of colitis-associated CRC, we determined that LIM kinase 2 knockout (Limk2-KO) mice had increased intestinal tumour size and dysplasia. These data support the hypothesis that there is selective pressure for reduced LIMK2 expression in CRC to relieve negative constraints imposed on gastrointestinal stem cells.
Materials and methods
Cell culture
Mouse embryo fibroblast cells were isolated and cultured as described in D'Abaco and Olson.14 Intestinal epithelial cultures were isolated and cultured as described in Sato et al.15 Colorectal tumour cell lines were maintained, and cell lysates prepared, as described in Emaduddin et al.16
Promoter methylation
For de-novo methyltransferase inhibitor treatments, SW48 cells were plated in six-well plates at 2×10⁵ per well. The following day, RG108 (100 µM final), 5-azacytidine (5-Aza) (10 µM final) or 1% dimethyl sulfoxide vehicle (v/v) were diluted in Dulbecco's modified eagle medium supplemented with 10% fetal calf serum and applied to cells for 48 h at 37°C. Genomic DNA from cell lines or tissues was prepared using a QIAamp DNA Mini Kit (Qiagen). Bisulphite conversion of genomic DNA was performed using the EZ DNA Methylation-Gold Kit (Zymo Research), followed by PCR using custom-designed primers (Invitrogen). PCR products were purified using the QIAquick PCR Purification Kit (Qiagen) and cloned using the 2.1-TOPO vector, before transformation into TOP10 Escherichia coli (Invitrogen). Blue/white screening was utilised to select positive colonies for DNA isolation and sequencing. Sequencing analysis was done using CLC Genomics V.5.0 software.
Cell extraction and immunoblotting
Whole cell lysates were prepared and western blotted as described previously.17 Primary antibodies used were routinely used at 1:1000 for western blotting. Antibodies used were: cofilin (Cell Signaling Technology); LIMK1 (Cell Signaling Technology); LIMK2 (Santa Cruz Biotechnology, Inc.); α-tubulin (σ-Aldrich); phospho-cofilin (Cell Signaling Technology); β-catenin (BD Biosciences); GFP (Abcam); Olfm4 (Abcam); Bmi1 (Cell Signaling Technology); Erk2 (gift from Chris Marshall, Institute of Cancer Research); Stat1 (Cell Signaling Technology). Alexa-Fluor680 (Molecular Probes) or IRDye800 (Rockland)-conjugated secondary antibodies were detected by infra-red imaging (Li-Cor Odyssey). Goat anti-mouse and goat anti-rabbit horseradish peroxidase-conjugated antibodies were from Pierce.
Histology and immunohistochemistry
Histology and immunohistochemistry were performed as described.18 Antibodies and working concentrations used for immunohistochemistry and immunofluorescence were the following: LIMK2, 1:200 (Santa Cruz Biotechnology, Inc); Phospho-Cofilin, 1:100 (Cell Signaling Technology); GFP, 1:250 (BD Biosciences); Texas-Red phalloidin, 1:250 (Molecular Probes, Invitrogen); β-catenin, 1:1000 (BD Biosciences). DAB-stained slides were imaged using a Hamamatsu Nanozoomer NDP slide scanner (Hamamatsu Photonics) and Digital Slide Server (Slidepath) software. For immunofluorescence images a Nikon A1R confocal microscope was used. For Drosophila immunofluorescence, tissues were dissected in phosphate-buffered saline (PBS) and fixed for 30–45 min in 4% para-formaldehyde. After fixation, samples were washed three times in PBS+0.1% Triton X-100 (PBST) and incubated in primary antibodies overnight at 4°C. Samples were then washed and subjected to secondary antibody staining for 2 h at room temperature followed by washing and mounting on Vectashield containing DAPI (Vector Laboratories, Inc). Primary and secondary antibodies were incubated in PBST+0.5% bovine serum albumin. The antibodies used were anti-phospho-Histone 3 (1:100 dilution, from Cell Signaling Technology), anti-GFP (1:2000 dilution from Abcam) and anti-Armadillo (1:3 dilution, developed by E. Wieschaus and obtained from the Developmental Studies Hybridoma Bank developed under the auspices of the National Institute of Child Health and Human Development and maintained by the University of Iowa, Department of Biology, Iowa City, IA, USA). Primary antibodies were visualised with Alexa 488, Alexa 532 or 594-conjugated secondary antibodies (Molecular Probes, Invitrogen).
Mice
Lgr5-EGFP-ires-Cre:ER-T2 (Lgr5>GFP) mice were described previously.19 Limk2 gene-trap embryonic stem cells (sequence tag: RRE287; MMRRC stock # 001883-UCD) were obtained from BayGenomics and used for blastocyst injections at the Beatson Institute using standard methods. Experimental mice are from a mixed C57BL/6J and 129/ola strain background. Limk2-KO mice are viable and born at Mendelian ratios (observed genotype at birth 49/183=26.8%) with no macroscopic abnormalities. All procedures were performed under appropriate licences and according to the UK Home Office guidelines.
Colitis-associated CRC (AOM+DSS)
On day 1, eight mice of each genotype (8–12-week-old littermates) were weighed and injected intraperitoneally with 12.5 mg/kg of azoxymethane (AOM) solution (Sigma-Aldrich). On day 6 the drinking supply was filled with dextran sodium sulfate (DSS) solution (DSS salt, MW36 000–56 000 Da, MP Biomedicals). On day 8 the drinking supply was refilled with DSS solution and on day 10 replaced with autoclaved water for 14 days. This cycle (5 days DSS plus 14 days water) was repeated two more times. DSS regimes were the following: cycle 1–1%; cycle 2–1.5%; cycle 3–1.5%. The mice were culled and dissected on approximately day 70. Tumour volume was determined by assuming its quasi half-spherical shape .
.
Lgr5-GFP+ stem cell FACS sorting, RNA purification and quantitative reverse transcriptase PCR
Crypt-villus organoids removed from matrigel by centrifugation or freshly isolated intestinal crypts were single-cell dissociated in TrypLE (Life Technologies) combined with DNAse I (2000 U/ml) for 30 min at 37°C. Dissociated cells were passed through a 40 µm cell strainer and incubated with DAPI (1:500) for dead cell exclusion. DAPI−/GFP+-positive cells were analysed and sorted using a FacsAria (BD Bioscience). Cells were sorted into full organoid culture medium plus Y27632 (10 µM). RNA was purified from approximately 5000 GFP+ cells using the Arcturus PicoPure RNA isolation kit (Applied Biosystems). Complementary DNA was synthesised using the Quantitect Reverse Transcription Kit (Qiagen). Quantitative reverse transcriptase (RT)-PCR primers for murine Limk2, Lgr5, Olfm4, Ascl2, CD44, Bmi1, 18s and Hprt were acquired from Qiagen (Quantitect Primer Assay).
X-gal staining of mouse frozen sections
Tumour and adjacent normal tissue specimens from Ah-CreER APCFl/+ PTENFl/+ Limk2+/− mice were isolated, washed in PBS and mounted with OCT (Tissue-Tek, Sakura) and immediately frozen using Cryospray (CellPath Ltd). Twelve to 14 µm thickness sections were stained using the β-Gal Staining Kit (Invitrogen, Life Technologies) for 48 h at 37°C.
Flies
Fly cultures and incubations were carried out on standard molasses media, with food changes every 2 days, at 25°C with controlled 12 h light-dark cycles as described in.20 For RNAi experiments, male dLIMK IR 26 294 or 28 948 fly lines were crossed with virgin female dicer;esg-gal4>GFP;gal80 flies. F1 females were collected for incubation at 29°C for 14 days to see effect of RNAi. All initial Drosophila stocks used were described previously and were obtained from the Bloomington Drosophila Stock Center.
Human tissue microarrays
A CRC tissue microarray (TMA) was constructed containing normal colon mucosa (n=50), primary (n=650) and metastatic CRC (n=285) as previously described in O'Dwyer et al,21 Hope and Murray22 and Murray et al.23 The metastases were all lymph node metastasis from the corresponding stage 3 (Dukes C) cancers. The histopathology of the cancers was reported as previously described,21 ,22 and clinicopathological details are summarised in supplementary table S1 (available online only). The authors confirm that all tissue samples were collected under strict institutional review board-approved guidelines/protocols with informed consent (National Research Ethics Service, North of Scotland ref. nos. 08/S0801/81 and 11/NS/0015). All collected human tissues were treated under strict confidentiality and according to appropriate applicable laws that protect the confidentiality of personal information. No names or any other identity information were revealed during the development of tissue arrays, nor to end users, and as a result are exempt from consideration by the Beatson Institute Committee on Human Subjects in Medical Research due to being anonymised and non-traceable. Cancer Research UK guidelines were followed in the handling and analysis of this material.
Statistical analysis
Unless indicated, statistical significance was determined by one way analysis of variance followed by Tukey's post-hoc tests. Data are shown as means±SD unless indicated. Box plots indicate medians bounded by quartiles with whiskers denoting 5th–95th percentiles. Survival analysis was performed with SPSS V.19 using the method of Kaplan–Meier and the log-rank test to compare individual groups.
Results
LIMK2 expression in human CRC
To determine whether LIMK2 protein levels were affected in CRC cell lines, we first validated the specificity of an antibody that recognises both LIMK2a and LIMK2b variants17 by western blotting lysates from wild-type Limk2+/− and Limk2−/− mouse embryo fibroblasts (figure 1A; non-specific band denoted by*). Western blotting lysates from a panel of CRC cell lines revealed that expression of LIMK1, ERK2 and the LIM kinase substrate cofilin were relatively constant, while LIMK2 expression was variable in numerous cell lines (figure 1B). LIMK2 expression in HCT116 and SW48 cells was lower compared to normal human colon tissue (figure 1C) on a protein lysate mass/mass basis (first and second vs third lane) or when normalised to α-tubulin levels (vs fourth lane). To determine whether epigenetics might be influencing LIMK2 expression, we chose SW48 cells as an exemplar and treated them with the de-novo methyltransferase inhibitors RG108 or 5-Aza.24 Both treatments showed elevated LIMK2 levels within 48 h (figure 1D). Sequencing of bisulfite converted genomic DNA revealed methylation of the 7 CpG islands (positions indicated by vertical red lines in the figure 1D line diagram) in the LIMK2a promoter (−629 to −541 relative to the start of transcription) and the seven CpG islands in the LIMK2b promoter (+104 to +314) that were reduced by 5-Aza treatment (figure 1D, pie charts represent results from 10 independent DNA isolates). We next analysed LIMK2 gene expression from CRC microarray datasets obtained using Oncomine.25 There were statistically significant decreases in LIMK2 expression in adenocarcinoma samples from caecum, colon, colon mucinous, rectal, rectal mucinous and rectosigmoid tissue relative to normal colon tissue (figure 1E; left side;26 right side).27 LIMK2 gene expression was also significantly lower in lamina proprial or epithelial adenomas and carcinomas relative to matched normal cells that had been separated by laser capture microdissection from normal, adenoma and carcinoma samples28 (figure 1F). Similarly, LIMK2 expression was significantly lower in carcinomas relative to normal colorectal samples in two independent studies (figure 1G;28 right side).29 These results indicate that LIMK2 gene expression is frequently and significantly reduced in CRC.
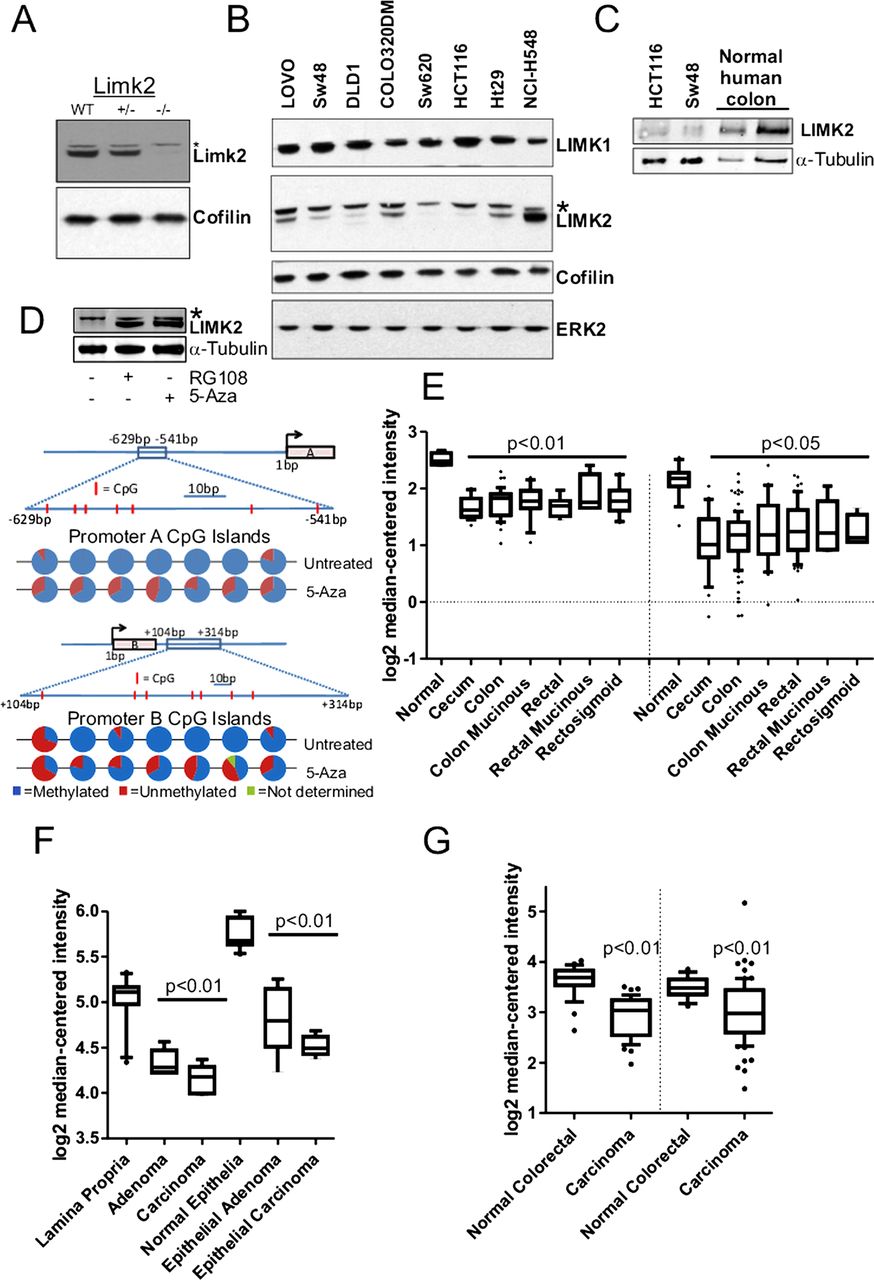
Limk2 expression in human colorectal cancers (CRC). (A) Western blot of mouse embryo fibroblast cell lysates from indicated genotyptes. *Non-specific band (B) Western blot of human CRC cell lysates. (C) Western blot of two CRC cell line and normal human colon lysates. Equivalent protein amounts were run in the three left lanes, equivalent α-tubulin amounts were run in the first two left lanes and last right lane. (D) Western blot of SW48 cell lysates following 48 h treatment with indicated de novo methyltransferase inhibitor. CpG methylation in LIMK2a and LIMK2b promoters without or with 5-azacytidine treatment. Line diagrams indicate position of CpG islands (red lines within boxed region) relative to the transcriptional start site for each promoter. Pie charts indicate proportion of methylation from multiple independent clones for each CpG island. (E) Log2 median-centred LIMK2 messenger RNA expression in indicated normal versus adenocarcinoma tissue samples from; left side26 right side.27 (F) Log2 median-centered LIMK2 mRNA expression in indicated microdissected normal lamina propria or epithelia, versus corresponding adenoma or carcinoma samples from Skrzypczak et al.28 (G) Log2 median-centered LIMK2 mRNA expression in normal versus carcinoma samples from left side,28 right side.29 LIMK2, LIM kinase 2.
We next examined Limk2 levels in murine normal intestines and intestinal tumours from genetically modified cancer-prone mice. We observed Limk2 expression throughout the intestines of wild-type mice, with highest levels at the base of crypts (figure 2A), which under higher magnification were found also to be marked by expression of GFP driven by the promoter of the stem cell marker Lgr519 (figure 2B, upper panels). Similarly, in colon sections Limk2 was found throughout with a degree of overlap with Lgr5 expressing cells (figure 2B, lower panels). Importantly, these staining patterns were absent in mice homozygous for gene-trapped Limk2 loci (figure 2A,B), thereby validating this antibody for use in immunohistochemistry. To determine whether Limk2 deletion was associated with reduced signalling output, we stained sections with an antibody that detects phosphorylation of the Limk2 substrate cofilin, which we previously validated for cofilin protein and phosphorylation specificity.30 Similar to Limk2, pCfl was localised throughout the intestinal cells with highest levels at the base of the crypts, which was clearly reduced in the Limk2-KO sections (figure 2C).

Limk2 expression in mouse intestine and tumours. (A) Limk2 expression (red) in intestine sections from wild-type (WT) or Limk2 knockout (KO) mice (B) Intestine or colon sections as indicated from WT or Limk2-KO mice that had been crossed with Lgr5>GFP mice were cut and stained for Limk2 (red) expression. Merged image also has DAPI staining of cell nuclei. (C) Intestine sections from WT or Limk2-KO mice were cut and stained for phosphorylated cofilin (pCfl; red). Merged image also has DAPI staining of cell nuclei. (D) Immunohistochemical analysis of Limk2 expression in intestinal tumour and adjacent normal tissue from Ah-Cre:ER, ApcFl/+, PtenFl/+ mouse. (E) β-Galactosidase activity in normal and dysplastic crypts as detected by X-gal staining of frozen intestinal tissue sections from heterozygous Limk2 gene-trap, Ah-Cre, ApcFl/+, PtenFl/+ mice.
We next examined Limk2 expression in intestinal tumours from the two-hit genetically modified mouse model that requires stochastic loss of heterozygosity for Apc and Pten.31 Limk2 expression in Ah-Cre:ER, ApcFl/+, PtenFl/+ mice was markedly lower in tumours than in surrounding normal tissue (figure 2D; tumour border outlined with red dashed line). Mice bearing one copy of a β-galactosidase gene-trap in the Limk2 locus in the context of a Ah-Cre:ER, ApcFl/+, PtenFl/+ genotype showed reduced β-galactosidase activity (visualised with X-gal) in dysplastic crypts compared to normal crypts, indicating inhibition of Limk2 promoter transcriptional activity (figure 2E). These data indicate that the apparently high expression of Limk2 in mouse intestinal cells becomes repressed, probably via promoter methylation and consequent inhibition, during tumorigenesis.
To determine how the patterns of LIMK2 expression changes are associated with oncogenesis and tumour progression, we used the LIMK2 antibody to stain representative human intestinal adenoma samples. Similar to normal tissue, LIMK2 expression was relatively high in low grade adenomas but markedly decreased in high grade adenomas with low or high levels of dysplasia (figure 3A). We next stained a well-characterised TMA comprised of 650 patient samples of normal intestines and tissue from Dukes A to Dukes C tumours, as well as representative lymph node metastases.21 By assigning staining intensity scores from 1 (low) to 6 (high), we established that median staining intensity in normal intestines scored 5 with relatively little variation (figure 3B,C). LIMK2 expression progressively dropped in tumours, with each Dukes stage having significantly lower LIMK2 expression than its predecessor (figure 3B,C, see supplementary table S2, available online only). LIMK2 expression in lymph node metastases was significantly lower than all stages except Dukes C (figure 3B,C, see supplementary table S2, available online only). To determine the association between LIMK2 expression and survival, we grouped staining categories into low (scores 1–3) or high (scores 4–6) and found that patients with low LIMK2 expression had significantly (χ2=14.51, p<0.001; log rank Mantel–Cox test) lower mean survival times (93.9 months) than high LIMK2 expressing patients (118.2 months) (figure 3D and see supplementary table S3, available online only). When the median and mean survival times were estimated for each scoring rank, there was a clear trend from highest survival for patients scoring 6 to lowest survival for patients scoring 1 (see supplementary table S4, available online only). To determine whether reduced LIMK2 expression levels were associated with lower signalling output, we stained the TMA with the antibody that detects cofilin phosphorylation.30 Levels of pCFL were significantly and progressively reduced relative to normal intestine and through each Dukes stage, with the exceptions that pCFL in Dukes B tumours did not differ from Dukes A, nor did pCFL in lymph node metastases differ from Dukes C tumours (figures 4A,B, see supplementary table S5, available online only). Mean patient survival was significantly (χ2=14.81, p<0.001; log-rank Mantel–Cox test) longer in high pCFL patients (119.3 months) than in low pCFL patients (91.2 months) (figure 4C and see supplementary table S6, available online only). When the median and mean survival times were estimated for each pCFL scoring rank, there was a clear trend from highest survival for patients scoring 6 to lowest survival for patients scoring 1 (see supplementary table S7, available online only). When examining on a patient by patient basis, there was an obvious correlation between LIMK2 expression and pCFL levels (figure 5A), which when compared using the SlidePath tissue image analysis system positive pixel algorithm32 ,33 yielded a Pearson product–moment correlation coefficient of r=0.59 (figure 5B). When both LIMK2 and pCFL variables were analysed together, best patient mean survival time was for high LIMK2 and pCFL (118.9 months, 38.7% of total patients; figure 5C, see supplementary table S8, available online only), while worst mean survival time was for low LIMK2 and pCFL (84.6 months, 36.1% of total patients; figures 5C, see supplementary table S8, available online only). These data reveal clear patterns of reduced LIMK2 expression and activity in CRC, and a significant association with patient mortality.
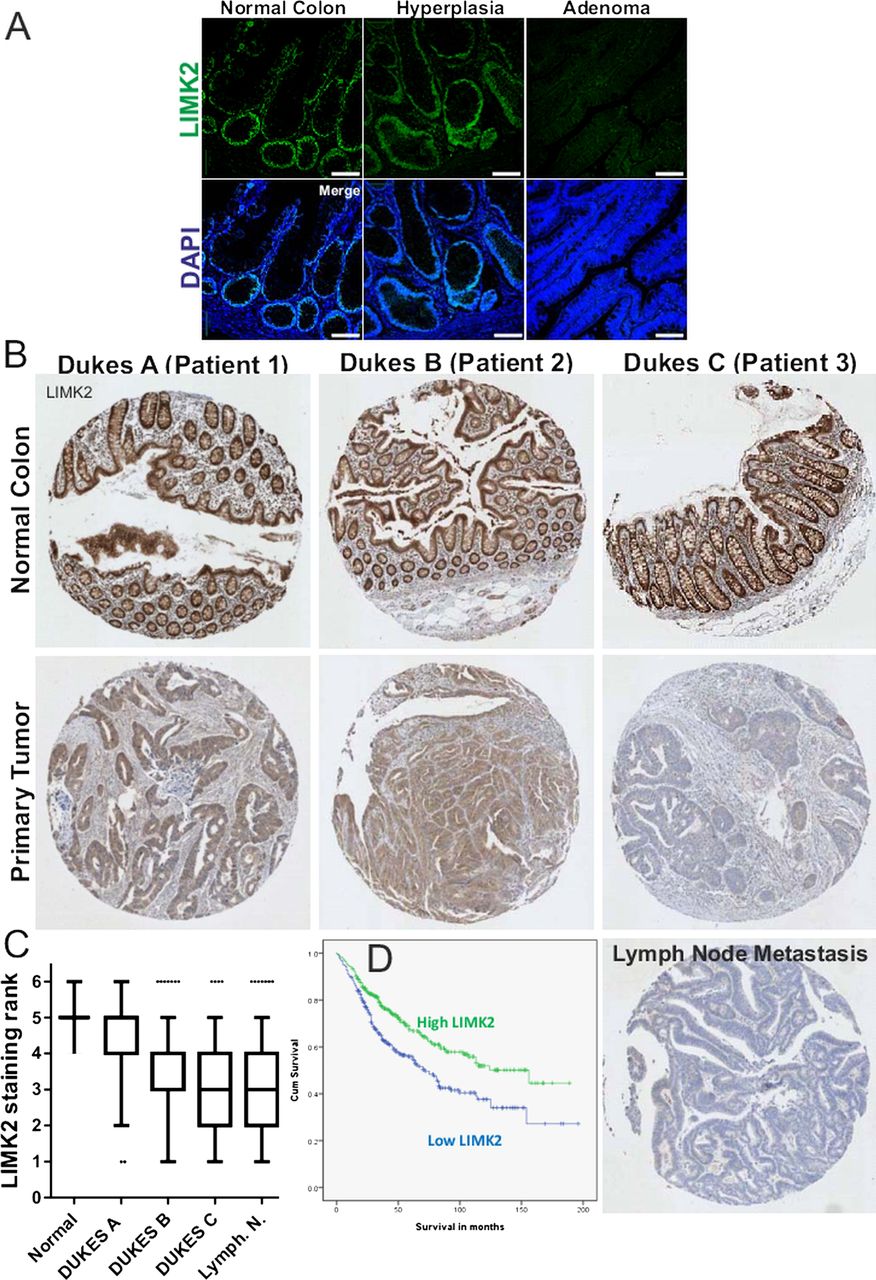
LIM kinase 2 (LIMK2) expression in human colorectal cancer (CRC) progression. (A) Immunohistochemical analysis of LIMK2 expression in human intestinal low grade and high grade adenomas. (B) Immunohistochemical analysis of LIMK2 expression in a tissue microarray (TMA) of human colorectal tumours and lymph node metastases. (C) LIMK2 staining intensities from TMA of human CRC. (D) Cumulative survival curves for high and low LIMK2 expressing patients.

Phosphorylated cofilin in human colorectal cancer (CRC) progression. (A) Immunohistochemical analysis of pCFL expression in a tissue microarray (TMA) of human colorectal tumours and lymph node metastases. (B) pCFL staining intensities from TMA of human CRC. (C) Cumulative survival curves for high and low pCFL-expressing patients.
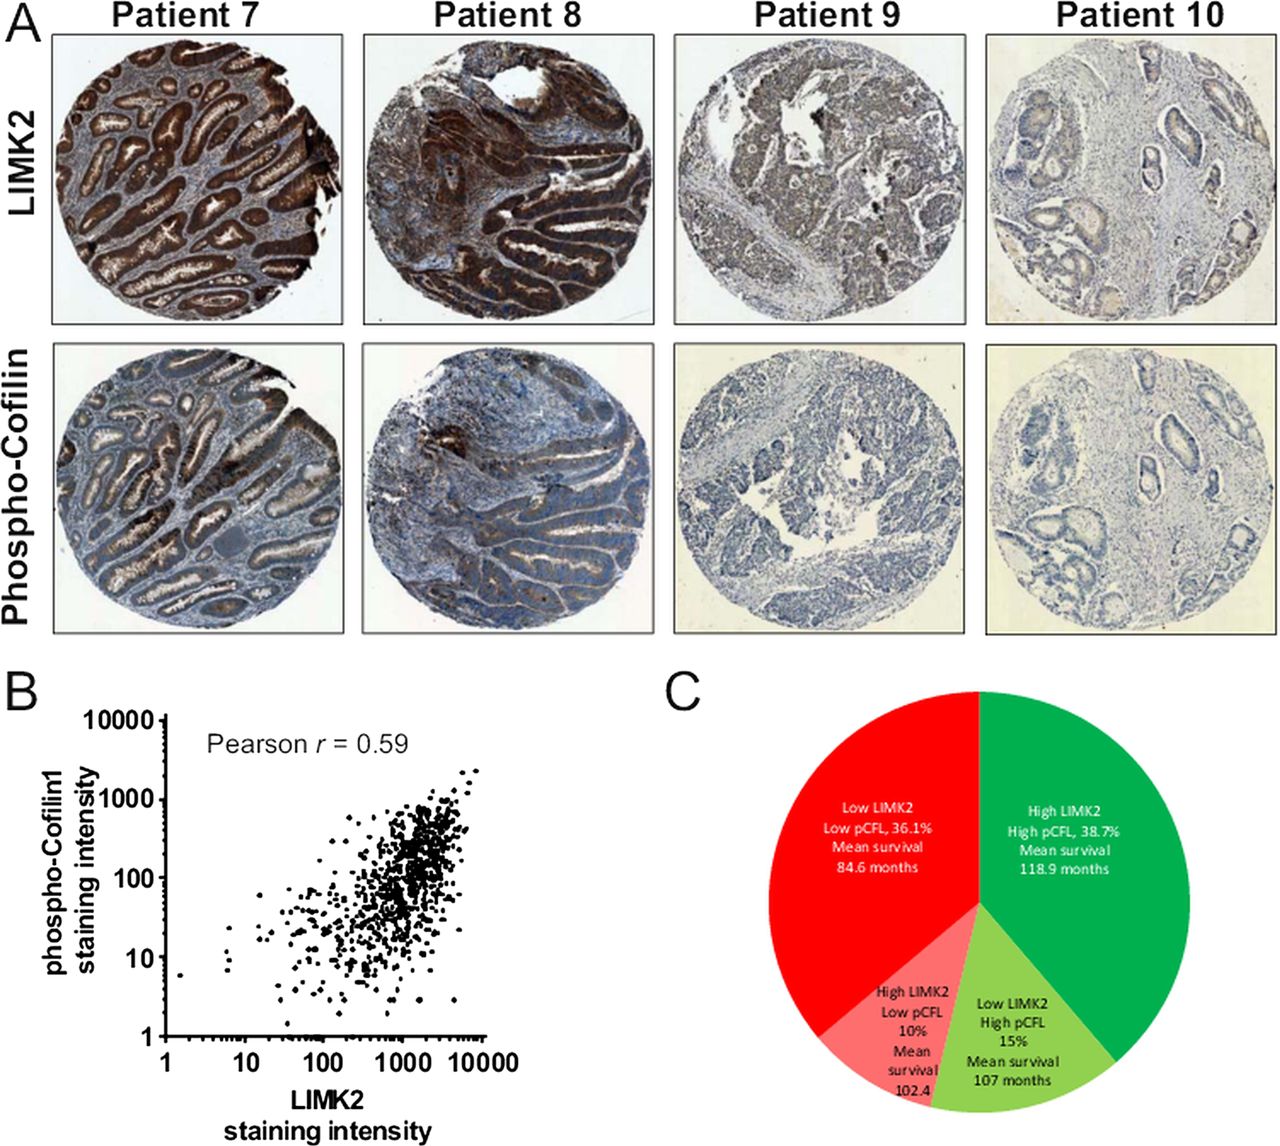
Association of LIM kinase 2 (LIMK2) expression and cofilin phosphorylation with patient outcomes. (A) Staining for LIMK2 and pCFL from paired patient sections. (B) LIMK2 and pCFL staining intensities were measured using SlidePath tissue image analysis system positive pixel algorithm.32 ,33 (C) Distribution of outcomes for all combinations of high and low LIMK2 and pCFL.

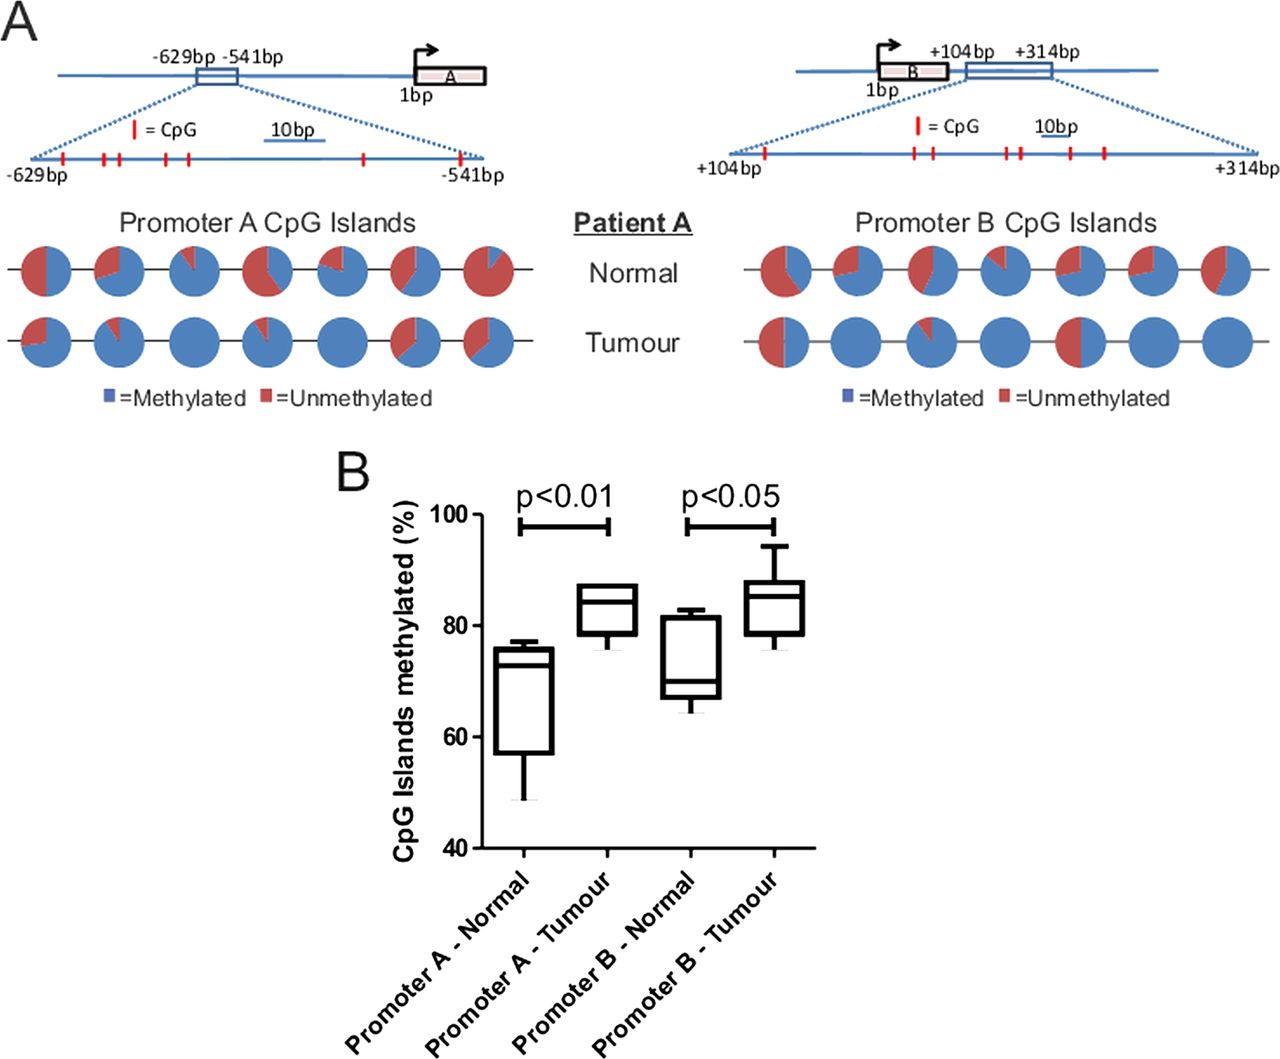
CpG methylation of LIMK2a and LIMK2b promoters in normal and tumour tissue. (A) Line diagrams indicate position of CpG islands (red lines within boxed region) relative to the transcriptional start site for each promoter. Pie charts indicate proportion of methylation from multiple independent clones for each CpG island in the genomic DNA of a representative patient. (B) Cumulative LIMK2a and LIMK2b promoter methylation data from matched normal and tumour tissue derived from six patients.
LIMK2 promoter methylation in human tumours
The DNMT inhibitor-sensitive promoter methylation in a CRC cell line (figure 1D) suggested that a similar effect on promoter methylation might account for the reduction in LIMK2 expression in human tumours (figure 3). By isolating genomic DNA from six frozen tumour sections represented in the TMA along with matched normal tissue isolated from these patients, we were able to compare patterns of promoter methylation using bisulfite sequencing. The seven CpG islands in the LIMK2a and LIMK2b promoters were typically more methylated in tumours than matched normal tissues (results from one patient example depicted in figure 6A). When percentages of CpG island methylation for LIMK2a and LIMK2b promoters were compiled from six patients, there was significantly higher CpG methylation in tumours compared to matched normal tissues. These results support the conclusion that reduced LIMK2 expression in human CRC is due to increased promoter methylation.

Knockdown of dLIMK increases Drosophila intestinal stem cell proliferation and tissue thickening. (A) Fly intestinal stem and progenitor cells are marked by esg-driven GFP and endogenous Armadillo (red) expression, flies expressing dLIMK RNAi inverted repeat hairpins have increased stem cell numbers compared to the control genotype (wild-type; WT). (B) GFP/DAPI-positive cells were counted in five sections from five WT and two dLIMK siRNA fly lines. (C) Cells expressing esg>GFP were also marked by their elevated expression of Armadillo and Delta relative to neighbouring cells. (D) Proliferation determined by staining for the mitotic marker phosphorylated Histone 3 (pH3) in control (WT) or dLIMK targeting RNAi. Higher magnification images of pH3 and DAPI staining reveal the appearance of condensed chromosomes in these mitotic cells. (E). Quantification of pH3 numbers in flies expressing two independent dLIMK RNAi hairpins revealed statistically significant increases relative to control WT flies. (F) Cross-sections of fixed and H&E stained midguts from control (WT) or dLIMK RNAi-expressing flies. (G) Average gut wall widths determined from four separate measurements for each cross-section from five WT and dLIMK RNAi flies. *p<0.05 by Student's t test.
Stem cell homeostasis in D melanogaster midgut
To understand how repression of LIMK2 expression might contribute to CRC, we used D melanogaster as a genetically tractable model system to examine the role of LIM kinase in gastrointestinal homeostasis.34–36 Importantly, experiments in the Drosophila posterior midgut, which is homologous to the mammalian intestine, have established that the orthologues of genes frequently mutated in human CRC (eg, APC, β-catenin, etc.) play important roles in the regulation of intestinal stem cell proliferation and tissue homeostasis.37–39 We used inverted-repeat RNA interference transgenes (RNAi) under the transcriptional control of the Gal4/UAS (upstream activating sequence) system40 to reduce expression of the single Drosophila LIM kinase homologue (dLIMK) in stem cells expressing the transcription factor Gal4 driven by the escargot (esg) promoter.41 When dLIMK was knocked down by esg-Gal4 driven expression of UAS-dLIMK RNAi in flies also carrying a UAS-GFP transgene to mark stem cells, it was readily apparent that, compared to control flies (wild-type), dLIMK knockdown significantly increased the proportion of GFP-expressing stem cells/progenitor cells (figure 7A,B) that were also demarcated by their relatively elevated expression of the β-catenin homologue Armadillo and Delta (figure 7C). This phenotype is consistent with increased stem cell proliferation.42 To measure whether dLIMK reduction affected cell proliferation directly, fixed midguts were stained with phosphorylated Histone 3 (pH3) antibody as a marker of mitotic cells.41 While pH3 staining was very low to absent in midguts from wild-type flies under homeostatic conditions, dLIMK knockdown with two independent RNAi transgenes significantly (p<0.001) increased the mean number of pH3-positive cells relative to the control genotype by more than fivefold (figure 7D,E). Co-staining with DAPI revealed patterns of condensed chromatin that supported the conclusion that pH3-positive cells were mitotic (figure 7D, right panels). Haematoxylin and eosin (H&E) stained cross-sections of paraffin-embedded posterior midguts from control flies were typical in their appearance, with a thin continuous cell layer surrounding a substantial lumen (figure 6D, left panel). In contrast, H&E stained midgut cross-sections from UAS-dLIMK RNAi flies were significantly thicker (figure 6D, right panel, figure 7G). These data indicate that in Drosophila, LIM kinase normally contributes to intestinal homeostasis by limiting the proliferation of stem cells.

Limk2 deletion increases cultured mouse intestinal stem cell proportion. (A) Self-renewing intestinal epithelial cells were isolated from wild-type (WT) and Limk2 knockout (KO) mice and propagated in vitro in the presence of the growth factors EGF, R-spondin1 and Noggin while embedded in three-dimensional Matrigel. Organoids were fixed, stained for filamentous actin with phalloidin, and visualised for Lgr5-driven GFP expression and phalloidin staining by confocal microscopy. (B) Organoids were isolated and disrupted to yield single cell suspensions. After a brief incubation with propidium iodide (PI), FACS analysis of 10 000 PI-negative live cells was used to determine the proportion of Lgr5>GFP-positive cells in each genotype. (C) Graph of results from three independent FACS experiments. *p<0.05 by Student's t test. (D) Equivalent cell numbers from disrupted organoids of intestinal epithelial cells from WTand Limk2 KO mice were used to prepare whole cell lysates that were western blotted as indicated. (E) RT-PCR analysis of stem cell marker expression in sorted GFP-positive cells from WT and Limk2-KO mice expressing Lgr5>GFP. The expression levels of each indicated stem cell marker did not vary significantly between the WT and Limk2-KO mice, indicating equivalent ‘stemness’.
LIMK2 deletion increases Lgr5-positive mouse intestinal stem cells
We next wished to determine whether there was a conserved role for Limk2 in regulating mouse intestinal stem cell homeostasis. Using a method that allows for the isolation and long-term in-vitro propagation of self-renewing intestinal epithelial cells,15 we examined whether Limk2 deletion affected proliferation of the Lgr5-positive stem cell population.19 When initially isolated from wild-type or Limk2-KO mice, intestinal epithelial cells showed no significant differences in the expression of various stem cell markers by western blotting or RNA microarray (see supplementary figure S1A,B, available online only), while the percentages of Lgr5>GFP-expressing cells also did not significantly differ (see supplementary figure S1C, available online only). However, when cells were cultured and passaged twice (every 7 days) in the presence of the proliferation-inducing growth factors epidermal growth factor, R-spondin1 and Noggin while embedded in three-dimensional Matrigel, there was a greater proportion of Lgr5>GFP-positive cells in the Limk2-KO organoids relative to wild-type as revealed by immunofluorescence microscopy (figure 8A; white arrows illustrating example GFP-positive cells). When cells from multiple independent organoids were dissociated and GFP-expressing cells counted by FACS (figure 8B, 10 000 events gated per condition), there was a significant (p<0.05, Student's t test) increase in the percentage of Lgr5>GFP-positive stem cells in the Limk2-KO relative to wild-type (figure 8C). Western blotting lysates from multiple independent organoids corroborated the elevation of Lgr5 driven GFP expression (indicating a greater proportion of GFP-positive cells) in the Limk2-KO (figure 8D). When GFP-positive cells were isolated and collected by flow cytometry, RT-PCR analysis revealed no significant differences in the expression of a number of stem cell markers including Lgr5, Bmi1, Olfm4, CD44 and Ascl2 between the wild-type and Limk2-KO, indicating equivalent levels of ‘stemness’ of the GFP-positive cells from each genotype (figure 8E). These results indicate that under conditions that strongly promote the proliferation of intestinal stem cells, the deletion of Limk2 provides a competitive advantage relative to wild-type cells, giving rise to an increased number of cells that are indistinguishable from their wild-type stem cell counterparts. By inference, epigenetic modifications to the LIMK2 promoters that resulted in transcriptional repression could be positively selected for in human CRC due to the increased response of stem cells to inducers of proliferation.

Limk2 deletion increases tumour volume and dysplasia in a colitis-associated colorectal cancer mouse model. (A). Timeline of experimental procedure. (B) Mean weights of wild-type and Limk2 knockout mice during the experimental procedure relative to starting weight (100%). (C) Coefficient of variation in weight curves for wild-type and Limk2 knockout mice. *p<0.05 by Student's t test. (D) Cross-sections of colon and caecum from wild-type and Limk2 knockout mice as indicated. Boxes indicate regions depicted in higher magnification images. (E) Serial sections of colon tissue from wild-type and Limk2 knockout mice as indicated. Boxes indicate regions depicted in higher magnification images. Elevated β-catenin staining relative to surrounding tissue was used to identify tumours and define dimensions. (F) Number of β-catenin-positive foci per colon section from wild-type and Limk2 knockout mice as indicated. p Value by Student's t test. (G) Volume of β-catenin-positive foci from wild-type and Limk2 knockout mice as indicated. *p<0.05 by Student's t test.
Limk2 deletion promotes crypt dysplasia and tumour size in a mouse model of colitis-associated CRC
To test the effect of LIMK2 deletion in a mouse model of colitis-associated CRC, 6–12-week-old mice were injected with a single dose of AOM (12.5 mg/kg), a potent carcinogen that induces the formation of O6-methyl-guanine, followed by three cycles of DSS administration in the drinking water (figure 9A). DSS administration will cause chronic inflammation, enhancing the incidence of AOM-induced tumours.43 Limk2-deficient mice display a higher sensitivity to the AOM+DSS protocol with a significant increase in weight variation (figure 9B,C), reflecting the increased weight loss after the second and third DSS cycles. At the end of the treatment regimen, Limk2-KO mice had a marked increase in crypt-villus dysplasia and hyperplasia throughout the middle to distal colon (figure 9D). The caecum also displayed a more severe dysplastic and hyperproliferative phenotype, which is a less common feature of this tumour model (figure 9D,E). There was a marked trend towards a higher tumour incidence in Limk2-KO mice (figure 9F). The tumours were mostly adenomas with high β-catenin expression. The most striking and significant effects were on the histology and volume of the β-catenin-positive tumour foci in the Limk2-KO mice. Limk2-KO foci were significantly larger (figure 9G) and locally invasive, showing a higher grade of dysplasia (figure 9E,G). These results indicate that the removal of Limk2 in a colitis-associated CRC mouse model had a mild effect on tumour initiation, but had a significant impact on tumour growth and on the acquisition of a more invasive phenotype. This could be a due to the relief of a proliferative constraint on gastrointestinal stem cells under conditions that favour their continuous self-renewal, thus contributing to CRC.
Discussion
We found that LIMK2 expression was reduced in the intestinal tumours of cancer-prone genetically modified mice, as well as in human CRC cell lines and tumours. To gain insight into the potential roles of LIMK2, we undertook genetic analysis in the Drosophila midgut, which is emerging as an informative model for gastrointestinal homeostasis and tumorigenesis,44 and using intestinal epithelial cells isolated from genetically modified mice. These studies revealed a conserved role for LIMK2 in constraining gastrointestinal stem cells in Drosophila and mice, such that relief of this constraint allowed for the expansion of stem cell numbers. Given that accumulating evidence indicates that stem cells are the predominant cells of origin for colorectal tumours,2–5 a logical conclusion of this study is that there is a positive selection for reduced LIMK2 expression and/or activity during CRC initiation and progression to allow propagation of gastrointestinal stem cells. Consistent with this conclusion, genetic deletion of Limk2 to reduce its expression in the AOM/DSS colitis-associated CRC mouse model resulted in increased average intestinal tumour volume and a more severe dysplastic and hyperproliferative phenotype.
The reduced LIMK2 expression in CRC was surprising given the reports of elevated LIM kinase expression in other cancers including breast,10 ,11 malignant melanoma12 and prostate13 tumours. Because of the role of LIM kinases in regulating actomyosin cytoskeletal dynamics, it has been assumed that there would consistently be elevated LIM kinase expression in advanced cancers to drive local invasion and distant metastasis. Indeed, we showed that inhibition of LIM kinase activity by RNAi or chemical inhibition blocked the collective invasion of breast cancer and squamous cell carcinomas by blocking the invasive ability of leading cells using in-vitro three-dimensional invasion models.45 However, by focusing on how LIM kinase activity influences processes involved in cell motility and invasion, reports of negative roles of LIM kinase on functions such as cell cycle regulation may have been overlooked. Elevated LIMK2 levels following DNA damage were found to promote G2/M arrest via cofilin,46 which is consistent with a proposed role for LIMK2 during mitosis in regulating microtubule organisation and spindle orientation.47 ,48 Given that expression of the LIMK2a and LIMK2b variants has also been reported to be reduced in thyroid cancers,46 it will be important to re-consider how LIMK2 contributes to specific cancers rather than attempting to construct a unified theory.
In actual fact, the role of LIM kinases in regulating cofilin phosphorylation and filamentous actin turnover is nuanced, and in some circumstances it may actually be more favourable for increased invasive ability for there to be reduced LIM kinase expression and activity. We previously found that ectopic expression of LIMK1 decreased the motility of Ras-transformed Swiss 3T3 fibroblasts,49 while overexpression of LIMK1 in MTLn3 rat mammary carcinoma cells inhibited lamellipod extensions,50 EGF-stimulated motility, and in vivo invasion.51 The relative proportions of LIM kinase and cofilin, as well as the activity of cofilin phosphatases such as Slingshot, contribute to regulating the cofilin activity cycle that is the key determinant of invasive and metastatic potential.52 ,53 The continuous decreases in LIMK2 expression and cofilin phosphorylation with advancing tumour grade suggests that, in addition to the effects on gastrointestinal stem cells, there may be additional contributions of reduced LIMK2 signal output ion promoting tumour cell invasiveness. As a result, there may actually be two distinct ways that the reduction in LIMK2 expression contributes to CRC; through relief of constraints on stem cells early in tumorigenesis, and by promoting cell invasiveness during more advanced stages.
An inference from this study is that because LIMK2 levels are decreased in a sizeable proportion of CRC patients, these cancers might be more effectively treated with some chemotherapeutics because knocking down and/or inhibiting LIMK2 sensitises cancer cells to DNA damaging agents,17 Aurora A inhibitors,54 Ras inhibition55 and microtubule-destabilising drugs such as vincristine and vinblastine.56 Therefore, knowledge of LIMK2 expression levels in CRC may have utility in patient stratification for the development of personalised therapies.
Acknowledgments
The authors would like to thank Colin Nixon and colleagues in histology services and the biological research service at the Beatson Institute of Cancer Research. They also acknowledge the support of the Think Pink breast cancer group who funded purchase of the NDP slide scanner.
References
Supplementary materials
Supplementary Data
This web only file has been produced by the BMJ Publishing Group from an electronic file supplied by the author(s) and has not been edited for content.
Files in this Data Supplement:
- Data supplement 1 - Online figure
- Data supplement 2 - Online tables
Footnotes
-
Contributors Study concept and design: FCL, JC, MV, GIM, MFO; acquisition of data: FCL, JM, JB, CO, GIM, MFO; analysis and interpretation of data: FCL, JC, OJS, MV, GIM, MFO; drafting of the manuscript: FCL, MFO; critical revision of the manuscript for important intellectual content: FCL, OJS, MV, GIM, MFO; statistical analysis: FCL, GIM, MFO; obtained funding: OJS, MV, GIM, MFO; administrative, technical, or material support: RS, KS, SMF.
-
Funding This study was funded by Cancer Research UK.
-
Competing interests None.
-
Patient consent Obtained.
-
Ethics approval All tissue samples were collected under strict institutional review board-approved guidelines/protocols with informed consent (National Research Ethics Service, North of Scotland).
-
Provenance and peer review Not commissioned; externally peer reviewed.
-
Data sharing statement Data will be shared on request.