Article Text

Abstract
Objective Octamer transcription factor 1 (OCT1) was found to be expressed in intestinal metaplasia and gastric cancer (GC), but the exact roles of OCT1 in GC remain unclear. The objective of this study was to determine the functional and prognostic implications of OCT1 in GC.
Design Expression of OCT1 was examined in paired normal and cancerous gastric tissues and the prognostic significance of OCT1 was analysed by univariate and multivariate survival analyses. The functions of OCT1 on synbindin expression and extracellular signal-regulated kinase (ERK) phosphorylation were studied in vitro and in xenograft mouse models.
Results The OCT1 gene is recurrently amplified and upregulated in GC. OCT1 overexpression and amplification are associated with poor survival in patients with GC and the prognostic significance was confirmed by independent patient cohorts. Combining OCT1 overexpression with American Joint Committee on Cancer staging improved the prediction of survival in patients with GC. High expression of OCT1 associates with activation of the ERK mitogen-activated protein kinase signalling pathway in GC tissues. OCT1 functions by transactivating synbindin, which binds to ERK DEF domain and facilitates ERK phosphorylation by MEK. OCT1-synbindin signalling results in the activation of ERK substrates ELK1 and RSK, leading to increased cell proliferation and invasion. Immunofluorescent study of human GC tissue samples revealed strong association between OCT1 protein level and synbindin expression/ERK phosphorylation. Upregulation of OCT1 in mouse xenograft models induced synbindin expression and ERK activation, leading to accelerated tumour growth in vivo.
Conclusions OCT1 is a driver of synbindin-mediated ERK signalling and a promising marker for the prognosis and molecular subtyping of GC.
- Gastric Cancer
- Cancer Genetics
- Signal Transduction
- Cell Proliferation
- Cell Migration
This is an Open Access article distributed in accordance with the Creative Commons Attribution Non Commercial (CC BY-NC 3.0) license, which permits others to distribute, remix, adapt, build upon this work non-commercially, and license their derivative works on different terms, provided the original work is properly cited and the use is non-commercial. See: http://creativecommons.org/licenses/by-nc/3.0/
Statistics from Altmetric.com
Significance of this study
What is already known on this subject?
-
Octamer transcription factor 1 (OCT1) is a homologue of OCT4 pluripotency factor, and it is expressed in intestinal metaplasia foci and in gastric cancers (GCs).
-
The mitogen-activated protein kinase (MAPK) pathway is one of the most frequently altered signalling pathways in GC.
-
Synbindin is a spatial regulator of the extracellular signal-regulated kinases (ERK)/MAPK signalling pathway.
What are the new findings?
-
The OCT1 gene is recurrently amplified in the genome of GC, and OCT1 amplification displays mutual exclusivity with KRAS and FGFR2 genes in the receptor tyrosine kinase (RTK) pathway.
-
OCT1 gene amplification and upregulation are associated with poor survival of patients with GC, and the association is supported by independent datasets.
-
OCT1 transactivates synbindin, which binds to the ERK DEF domain and potentiates ERK phosphorylation by MEK1, leading to activation of the ERK substrates ELK1 and RSK. The expression of OCT1 strongly correlates with the levels of synbindin and ERK phosphorylation in GC tissues.
-
OCT1 upregulation suppresses apoptosis and enhances proliferation and invasion of GC cells. Knockdown of synbindin expression blocked the pro-malignant effects of OCT1.
-
In xenograft tumour models, OCT1 substantially promoted synbindin expression and ERK activation, leading to accelerated tumour growth in vivo.
How might it impact on clinical practice in the foreseeable future?
-
Amplification of OCT1 contributes to ERK/MAPK activation, and it may join other components in the RTK pathway to mark patients with GC who are potentially treatable by RTK/RAS directed therapies (up to 46% of the GC population by simplified estimation).
-
OCT1 is an independent prognostic factor in GC, and combining OCT1 expression with American Joint Committee on Cancer staging could further improve the prediction of patient survival. OCT1 gene amplification and upregulation can be used as a promising biomarker for the prognosis of GC.
Introduction
Stomach adenocarcinoma, or gastric cancer (GC), is the fourth most common cancer and the second highest cause of cancer-related mortality worldwide.1 The prognosis of patients with GC continues to be dismal, despite improving surgical and adjuvant treatment approaches, with a 5-year overall survival less than 25%.2 It is of great clinical importance to identify genes that control the severity of GC and present predictive value for prognosis.3 ,4 In a systematic study of molecular signatures in GC, mitogen-activated protein kinase (MAPK) was found as the most frequently activated pathway in this deadly disease.5 In support of this, several components of the receptor tyrosine kinase (RTK)/RAS/MAPK pathway were found to be frequently amplified in GC.6 ,7 Since MAPK signalling is also controlled by spatiotemporal regulatory mechanisms,8 ,9 it is of interest to test if alternative pathways may contribute to MAPK deregulation in GC.
Octamer transcription factor 1 (OCT1) (POU2F1) belongs to the POU homeodomain family of transcription factors.10 This protein activates or represses the transcription of various genes, such as the immunoglobulin genes in B cells11 and several interleukins.12 Accumulating data suggest that OCT1 may contribute to the malignant transformation process, and loss of OCT1 inhibits oncogenic transformation in mouse embryonic fibroblasts and tumourigenicity in p53-deficient mice.13 Moreover, OCT1 is believed to facilitate the tumourigenesis of pancreatic and intestinal cancer cells through transactivating the CDX2 gene.14 Interestingly, OCT1 has been reported to be positive in 87% of intestinal metaplasia foci (a preneoplastic lesion) and in 74% of gastric carcinomas in one series.15 Nonetheless, in GC cells OCT1 was found without the ability to transactivate CDX2, although it could bind to the CDX2 promoter.15 Despite recent efforts to understand the activities of OCT1 as a transcriptional factor,16 little is known about the roles of OCT1 in gastric carcinogenesis and it remains unclear whether OCT1 expression may associate with any clinicopathological features of GC.
Here we report OCT1 as an independent prognostic marker for GC and it regulates the extracellular signal-regulated kinase (ERK) MAPK signalling by transactivating synbindin. Synbindin is a core subunit of the trafficking protein particle complex and it is involved in the targeting and fusion of vesicles from endoplasmic reticulum to Golgi apparatus.17 We previously found that synbindin functions as a scaffold protein that binds to MEK and ERK2, facilitating MEK-dependent phosphorylation and activation of ERK2 on the Golgi.9 In this study, we further show that OCT1 binds to and transactivates the promoter of synbindin, thereby inducing synbindin-mediated activation of ERK signalling in GC. We obtained in vitro and in vivo data supporting the major regulatory effects of OCT1 on ERK signalling and the aggressive behaviours of GC cells. Importantly, we demonstrate that OCT1 amplification and upregulation associate with poor outcome in patients with GC. By these approaches we aim to elucidate the functional and prognostic implications of OCT1 in GC.
Materials and methods
Immunofluorescence
Tissue specimens were from patients (89 cases for immunofluorescence and 10 for fluorescent in situ hybridization (FISH)) who underwent surgery at the Shanghai Renji Hospital from July 2003 to January 2009. The protocol had the approval of the Ethics Committee of the Shanghai Jiao-Tong University School of Medicine, Renji Hospital, and the research was carried out according to the provisions of the Helsinki Declaration of 1975. Written informed consent was obtained from all participants involved in the study, and clinical information was collected with Institutional Review Board approval. Meanwhile, 89 specimens of adjacent tissues were taken from these patients as the paired controls. The tissue sections were deparaffinised in xylene and rehydrated using a graded series of ethanol. All slides were treated with NaBH4 to suppress autofluorescence of tissues. The expression levels of OCT1 and synbindin were probed with the primary antibodies (OCT1, dilution 1:40; synbindin, dilution 1:40) according to the manufacturer's instructions. Secondary antibodies (Alexa488-anti-mouse and Alexa546-anti-rabbit) were used to label synbindin and OCT1, respectively. Protein expression was quantified based on staining intensity.
Fluorescent in situ hybridisation
The FISH protocol to detect gene copy number variation (CNV) in formalin-fixed paraffin embedded tissues has been described in detail previously.18 Briefly, the OCT1 DNA probes were labelled using spectrum green and control probes in spectrum orange (centromeric CEP probe for chromosomes 1) (Abbott Molecular Inc, Des Plaines, Illinois, USA). Hybridised slides were counterstained with DAPI and analysed using Zeiss LSM710 confocal microscope (Carl Zeiss, Regensburg, Germany).
Additional materials and methods including chromatin immunoprecipitation (ChIP), cell viability and invasion assays, flow cytometry, gene set enrichment analysis (GSEA), CNV analysis, TF binding identification, Western blotting, and in vivo experiments can be found in the online supplementary information.
Results
OCT1 expression and CNV in GC
We first investigated OCT1 expression level in gastric adenocarcinoma (90 cases) and their adjacent normal controls by immunofluorescence histochemistry. As a result, OCT1 was weakly or moderately detected in normal gastric mucosa (figure 1A), but its expression level was substantially increased in GC cells (p<0.0001, figure 1B,C). Notably, OCT1 was strongly positive in the nucleus of GC cells, suggesting its active status as a transcriptional factor (figure 1D). In addition, we detected increased OCT1 expression in gastric tissues with intestinal metaplasia (see online supplementary figure S1A), which confirmed previous findings.15

Amplification and overexpression of octamer transcription factor 1 (OCT1) gene in gastric cancer (GC). (A) Expression of OCT1 in normal gastric tissues as determined by immunofluorescence. Scale bars indicate 10µm in all panels. (B) Immunostain of OCT1 in gastric cancer tissues. (C) Statistical analysis of OCT1 expression in normal and GC tissues (P<0.0001, Mann Whitney test). (D) The immunofluorescent image shows OCT1 (in green) and cell nucleus (in blue)OCT1 is strongly expressed in the cell nucleus (red arrows). (E) The frequency of OCT1 amplification in three independent GC cohorts as indicated. (F) OCT1 genomic amplification confirmed by fluorescence in-situ hybridization (FISH) assay. Green signals indicate the OCT1 FISH probe, and red signals probe to centremore 1. Scale bars indicate 5µm in all panels. (G) OCT1 mRNA levels were significantly higher in samples with OCT1 gained CNA compared with the samples without CNV in the TCGA dataset (P<0.01, 2-sided t-test). (H) Relationship between the CNVs of OCT1 and frequently altered genes in Receptor tyrosine kinase (RTK) pathway. The mutual exclusivity between the CNVs of OCT1 (POU2F1) and other genes was determined by dimension reduction permutation (DRP) algorithm (*P<0.05).
Further, we analysed the CNV of OCT1 in GC tissues using data from The Cancer Genome Atlas (TCGA) GC cohort,19 the Singapore6 and the VUMC cohorts.20 The GISTIC 2.0 package was employed to identify focal alteration events based on Affymetrix SNP6 microarray data (TCGA and Singapore datasets), while the CGHCall algorithm was used to analyse aCGH data (VUMC dataset). The OCT1 (POU2F1) gene is located in a recurrently amplified region in chromosome 1 (see online supplementary figure S1B), with 31 of 305 patients (10.16%) showing focal amplification (q value <0.001) but only one patient with deletion (figure 1E). This result was confirmed by the Singapore GC patient cohort, which reported 18 in 193 patients with GC (9.33) with focal amplification of OCT1 gene (figure 1E). In fact, algorithms that identify focal and broad (q value<0.25) CNV events show much higher frequency of OCT1 amplifications, ranging from 22.2% (40 of 180 cases in VUMC cohort) to 32.1% (98 of 305 cases in TCGA cohort) (figure 1E, see online supplementary figure S1C–E). We performed FISH analysis on six GC tissues and found two samples with gained copy number of OCT1 gene (figure 1F). Combined analysis on the mRNA and CNV data in the TCGA cohort revealed that gained CNV of OCT1 associated with significantly higher mRNA level in GC (figure 1G). In addition, amplifications of OCT1 displayed mutual exclusivity with those of KRAS and FGFR2 genes in the RTK pathway, which are also frequently altered in GC (figure 1H).
OCT1 gene amplification and upregulation associate with poor survival of GC
We further studied the association between OCT1 expression level and different clinicopathological features of GC. When the patients were stratified according to OCT1 expression levels (median split), significantly larger tumour size was found in the OCT1-high group (p<0.0001, see online supplementary figure S2A). However, OCT1 was not associated with the sex, age, American Joint Committee on Cancer (AJCC) staging, or any histological subtypes of patients with GC (see online supplementary figure S2B, dataset shown in online supplementary table S1). Notably, OCT1 overexpression strongly associated with poor survival of patients with GC (p<0.0001, Mantel-Cox test, figure 2A), and the 5-year survival rate in the OCT1-high group (8.9%) was substantially lower than that of the OCT1-low group (51.1%). In fact, the stratification by OCT1 level displayed even higher prognostic significance than the widely employed AJCC staging (significance p=0.0002, 5-year survival: 20 vs 42.2 months, figure 2B). When the GC cases were stratified into four groups according to either OCT1 expression (quartile split) or AJCC staging (I–IV), a better discrimination was also achieved by the OCT1-based method (see online supplementary figure S2C,D). We determined the receiver operating characteristic curves for the prediction of patient survival using either AJCC stage or OCT1 level, or a combination of both (figure 2C). The area under curve (AUC) of OCT1-based prediction (0.751) was higher than that of the AJCC stage-based model (0.714), while the combination of both factors achieved the highest AUC value (0.800).

Octamer transcription factor 1 (OCT1) gene amplification and upregulation are associated with poor survival in patients with GC. (A) Kaplan-Meier survival analysis of GC patients stratified by OCT1 expression level (median split). (B) Kaplan-Meier survival analysis of GC patients with different AJCC tumor stages (I-II v.s. III-IV). (C) The receiver operating characteristic (ROC) curves for predicting patient survival using AJCC stage (left panel), OCT1 level (middle panel) or combination of two factors (right panel). The area under curve (AUC) and the corresponding 95% CI are shown in the plots. (D) Different factors (including OCT1, AJCC stage, tumor size, sex and age) were analyzed for their association with patient survival using Cox regression model. The hazard ratio and 95% confident interval (CI) are plotted for each factor. (E) The GC patients in the Singapore cohort were stratified according to OCT1 mRNA level (median split) and compared for the survival using Kaplan-Meier analysis. (F, G) Gain in OCT1 gene copy number associated with poor survival in both the Singapore cohort (F) and VUMC cohort (G).
Multivariate Cox regression survival analysis adjusting for AJCC stage, tumour size, sex and age of patients consistently reported strong correlation between OCT1 overexpression and shorter survival (p=0.0001, HR=3.27, 95% CI 1.80 to 5.92, figure 2D; also see online supplementary figure S2E). We validated the prognostic significance using the Singapore cohort and found downregulation of OCT1 mRNA significantly associated with survival in patients with GC (p=0.007, Kaplan–Meier analysis, figure 2E).21 In addition, the gained CNV of OCT1 was also significantly associated with shorter survival, as revealed by the Singapore cohort (p=0.015, figure 2F) and the VUMC GC cohort (p=0.040, figure 2G).20 These findings consistently suggest OCT1 as a promising prognostic marker for GC cells.
Identification of ERK signalling pathway as regulatory target of OCT1
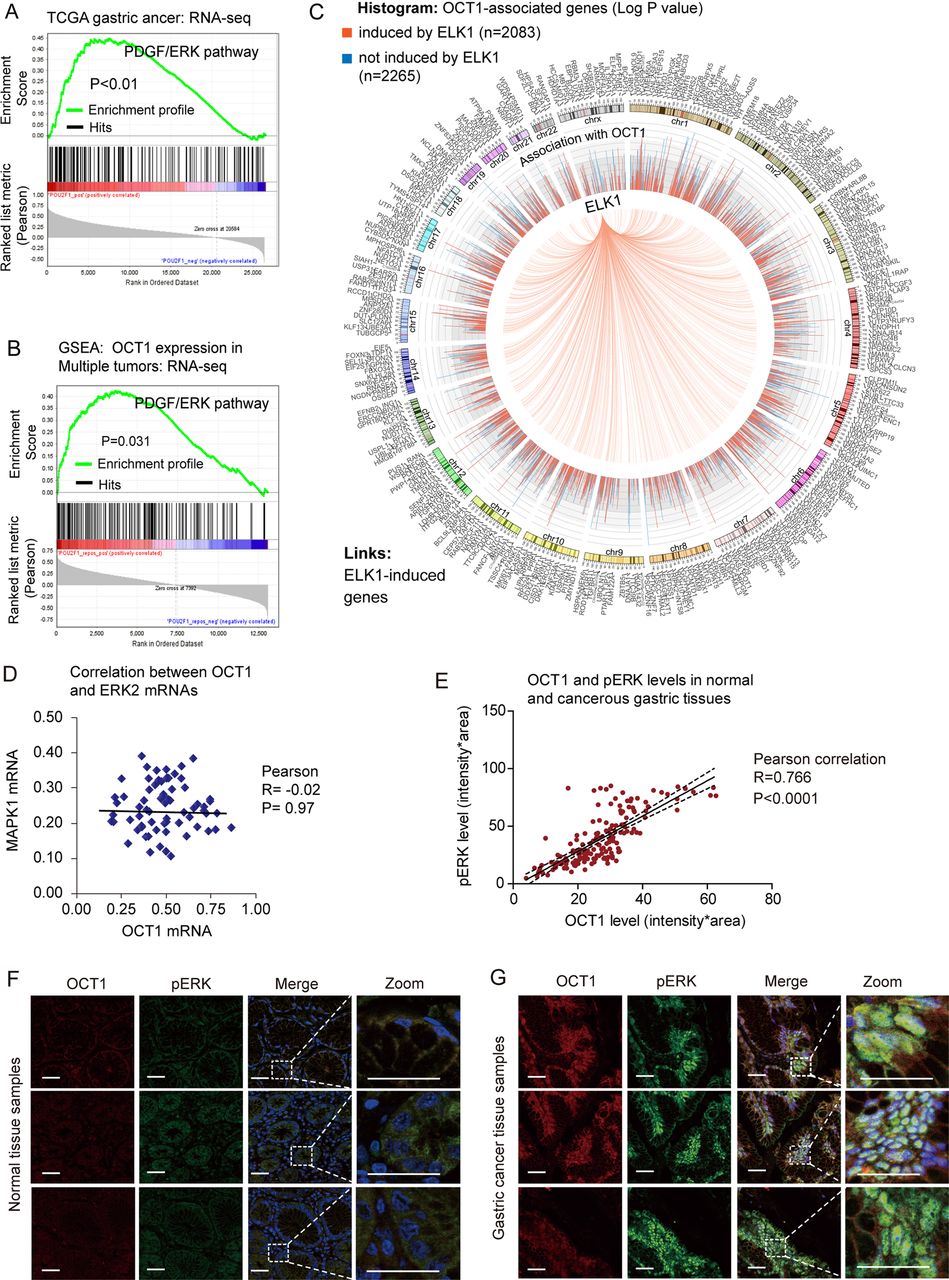
As described above, the exact pathways that OCT1 may regulate in cancers remain unclear. To probe the OCT1-associated pathways on an unbiased basis, we performed GSEA using high throughput RNA-sequencing data of the GC cohort of The Cancer Genomic Atlas project (TCGA, 282 patients) and a multi-tumour dataset (including 64 human tumours and 27 normal tissue samples) from the Gene Expression Omnibus database.22 GSEA is designed to detect coordinated differences in expression of predefined sets of functionally related genes.23 Among all the 189 predefined ‘oncogenic signature’ gene sets, the PDGF/ERK pathway was identified with the strongest association with OCT1 expression in the TCGA GC dataset (figure 3A) and the multi-tumour dataset (figure 3B). In addition, the Enrichment Map algorithm adjusting for gene set redundancy also identified the RAS-ERK signalling pathway in strong correlation with OCT1 expression (see online supplementary figure S3). Of note, approximately half (2083/4348) of OCT1-correlated genes were found as inducible targets of ELK1,24 which is a major effector in the ERK signalling pathway (figure 2C). These findings consistently suggest that OCT1 may be involved in the activation of the ERK signalling pathway.

Identification of extracellular signal-regulated kinase (ERK) signalling as a regulatory target of octamer transcription factor 1 (OCT1). (A, B) Gene Set Enrichment Analysis (GSEA) identified significant association between OCT1 and ERK signaling pathway in both the TCGA gastric cancer dataset and the multi-tumor dataset. (C) Circos plot showing 2083 of the 4348 OCT1-associated genes are inducible by ELK1, a major effector gene in ERK signaling pathway. The histogram shows corresponding P values (log1/2 transformed) of the associated genes, with red color representing ELK1-inducible genes while blue indicating non-inducible genes. (D) The expression levels of OCT1 and ERK2 were subjected to Pearson correlation analysis, which suggested no correlation between the two genes (P=0.97). (E) Correlation between the protein levels of OCT1 and phosphorylated ERK (pERK) as determined by immunostain of gastric cancer and normal tissues. (F) Representative immunofluorescent image of OCT1 (labeled in red) and pERK (green) in normal gastric tissues. Zoomed sections are shown on the right panels. Scale bars indicate 100µm in all panels. (G) Representative gastric cancer immunostain images acquired by the same procedures as described previously.
OCT1 expression associates with ERK phosphorylation in GC
In light of the association between OCT1 and ERK signalling, we explored whether OCT1 may correlate with ERK2 expression level or its phosphorylation/activation in GC tissues. Interestingly, analysis on RNA-sequencing data suggested no association between OCT1 and ERK2 mRNA levels (figure 3D), while the tissue immunofluorescence study revealed a strong correlation between OCT1 expression and the level of ERK2 phosphorylation (pERK2) in GC (figure 3E). In addition, the levels of OCT1 and pERK2 were coordinately increased from normal tissues to GC tissues (figure 3F,G). These results suggest potential implication of OCT1 in the phosphorylation/activation of ERK2 in GC.
Regulation of synbindin-mediated ERK phosphorylation by OCT1
Since our group has identified synbindin as a pivotal regulator of ERK2 phosphorylation in GC,9 we questioned whether OCT1 might affect ERK signalling by regulating synbindin. This assumption was well supported by the putative OCT1-binding sites in the synbindin promoter (within −700 bp upstream of the transcription starting site (TSS); see online supplementary figure S4A). Luciferse reporter assay suggested this promoter region could be transactivated by OCT1 (see online supplementary figure S4B). Further, we performed ChIP assay to test the binding of OCT1 to synbindin promoter in vivo. As a result, the promoter region of synbindin was amplifiable from the DNA recovered from the immunoprecipitation complex using a specific antibody for OCT1 but not a control IgG (see online supplementary figure S4C), thus confirming the binding of OCT1 on the promoter regions of synbindin. To identify the exact binding site of OCT1 on synbindin promoter, we developed a sequence scanning approach using the 3DTF method25 based on the crystallographic data on the OCT1 protein–DNA complex (pdb entry: 1O4X). The sequence ranging from −253 to −241 upstream of TSS of synbindin was found with the highest binding propensity to OCT1 (figure 4A). To confirm this finding, we analysed the enrichment of OCT1-binding stretches derived from previous ChIP-seq study26 in the synbindin promoter. This method also identified the −253 to −241 region as the strongest binder to OCT1 (figure 4B). Finally, a luciferase reporter inserted by this short sequence could be strongly transactivated by OCT1 (figure 4C), while other sequences mapping to non-predicted sites were not transactivated (see online supplementary figure S4D,E). These results confirmed the findings of the two dedicated prediction methods, indicating that OCT1 binds to and transactivates −253 to −241 region of the synbindin promoter.

Transactivation of synbindin by octamer transcription factor 1 (OCT1) and effects on extracellular signal-regulated kinase (ERK) activation. (A) TF-DNA crystallography structure-based prediction of OCT1 binding sites on synbindin promoter (OCT1-DNA complex structure shown on the right). Arrow heads in red and in grey respectively indicate the predicted binding sequence and other sequences tested by luciferase assay. (B) ChIP-seq enriched motif-based prediction of OCT1 binding on synbindin promoter (analysis scheme shown in the right panel). (C) The predicted OCT1-binding sequence (-253 to -241) and its mutated variant (both sequences indicated) were respectively inserted into a luciferase reporter and analyzed for their responses to OCT1. (D) Gastric cancer cells were transfected with OCT1 or control vector, and the mRNA level of synbindin was quantified by qPCR. (E) Western Blot of OCT1 and synbindin of cells treated as described as above. (F) Cells were treated by OCT1 siRNAs and control siRNA, and the level of synbindin mRNA was quantified by qPCR. The 18S rRNA level was used for normalization. (G) Western Blot showing decrease of synbindin protein upon knockdown of OCT1 using specific siRNAs. (H) Western blot showing the expression levels of OCT1, synbindin, p-ERK and ERK in five gastric cell lines. OCT1 expression is upregulated in GC cells as compared to normal gastric mucosa cell GES-1. (I) The mRNA level of synbindin in gastric cell lines was detected by RT-qPCR. (J) Cells were transfected by OCT1 or control vector, followed by Western Blot analysis using specific antibodies for synbindin, phosphorylated ERK (pERK) or total ERK.
In support of the effect of OCT1 on transactivating synbindin promoter, ectopic expression of OCT1 markedly upregulated synbindin expression at mRNA and protein levels (figure 4D,E). Consistently, inhibition of OCT1 by specific siRNAs significantly decreased mRNA and protein levels of synbindin (figure 4F,G). The expression levels of OCT1 and synbindin showed similar trends in different GC cell lines, which supported the regulatory effect of OCT1 on synbindin (figure 4H,I). Accordingly, the level of phosphorylated ERK (p-ERK) was also higher in the OCT1 and synbindin-expressing cells (figure 4H), although the genetic background of AGS (KRAS mutation) and MKN45 (MET amplification) should also be taken into account. Ectopic expression of OCT1 significantly increased synbindin level and ERK2 phosphorylation in GC cells (figure 4J). The subtle change on total ERK2 level confirmed that OCT1 has little effect on ERK2 expression. Taken together, these results indicate that OCT1 regulates ERK2 phosphorylation/activation by transactivating synbindin in GC cells.
OCT1 as a determinant of synbindin expression in GC tissues
Further, we performed immunofluorescence assay to analyse the expression levels of OCT1 and synbindin in normal gastric mucosa and GC tissues. As shown in figure 5A–C, OCT1 and synbindin protein levels showed remarkable correlation (p<0.0001, Pearson correlation). Consistently, RNA-sequencing data revealed significant correlation between the mRNA levels of OCT1 and synbindin across different cancer types and normal tissues (p<0.0001, Pearson correlation, figure 5D). The relationship between OCT1 and synbindin mRNAs in GC tissues was further analysed using microarray data,27 which suggested strong correlation between mRNA levels of the two genes (p=0.0002, Pearson correlation, figure 5E). These results, based on human cancer tissues, strongly suggest that OCT1 is a determinant of synbindin expression in GC cells.

Roles of octamer transcription factor 1 (OCT1) in regulating synbindin expression and cell aggressiveness. (A) Immunofluorescent detection of OCT1 and synbindin expression in normal gastric tissues. Scale bars indicate 20 μm in all panels. (B) Immunostain of OCT1 and synbindin in human gastric cancer tissues. (C) Correlation between the protein levels of OCT1 and synbindin in human gastric cancer tissues as determined by immunofluorescence. (D) The mRNA levels of OCT1 and synbindin determined by RNA-sequencing (GSE28866) showed strong correlation in cancer and normal tissues. (E) The OCT1 and synbindin mRNA levels detected by microarray (GSE27342) were strongly correlated in human gastric tissues. (F) Representative Transwell assays of MGC803 cells stably expressing the control vector or OCT1 vector treated without/with the specific siRNAs for synbindin. Scale bars indicate 100 μm in all panels. (G) Statistical result based on three independent Transwell assays. (H) Cell Counting Kit-8(CCK8) assay of MGC803 cells stably expressing control vector or OCT1 vector without/with treatment by synbindin siRNAs. (I) Apoptosis of cells treated by above-mentioned procedures as measured by flow cytometry combined with phycoerythrin (PE)-conjugated annexin V staining. (J) Statistics based on 3 independent apoptotic assays (**P<0.01; ***P<0.001, t-test). (K) The MKN45 cells were treated by two specific siRNAs (left and right panels) without or with ectopic expression of synbindin, and cell proliferation was measured by CCK8 assay (OD450 absorbance). (L) Effects of OCT1 silencing and synbindin ectopic expression on the invasiveness of MKN45 cells. Scale bars indicate 100 μm in all panels.
Synbindin-dependent effects of OCT1 in GC cells
To test whether the effects of OCT1 on ERK phosphorylation/activation is dependent on synbindin expression, the human GC MGC803 cells were transfected with OCT1 expression vector or control vector, in the absence or presence of siRNAs specific for synbindin. While OCT1 significantly increased the levels of pERK and pELK1 (without affecting p-MEK level), knockdown of synbindin efficiently suppressed the effects of OCT1 (figure 5F). These results supported our notion that synbindin plays a central role in mediating OCT1-induced ERK signalling.
Moreover, we found that synbindin is required for the effects of OCT1 on the malignant behaviours of GC cells. Transwell assay revealed a significant increase in the invasiveness of OCT1-expressing cells, which could be suppressed by knockdown of synbindin (figure 5F,G). In addition, MTT assay suggested pro-proliferation effect of OCT1 on GC cells (figure 5H), and flow cytometry combined with annexin V-FITC staining indicated the strong anti-apoptotic effect of OCT1 (figure 5I,J). Importantly, suppression of synbindin expression by specific siRNAs impaired these pro-malignant effects of OCT1 (figure 5F–J). Since the MKN45 cells expressed a higher level of OCT1, we examined the effect of suppressing OCT1 on cell proliferation and invasion. As a result, knockdown of OCT1 using specific siRNAs inhibited the proliferation and invasion of MKN45 cells, while ectopic expression of synbindin restored cell proliferation and invasion (figure 5K,L). These results suggest that OCT1 contributes to malignant behaviours of GC cells by regulating synbindin expression.
OCT1-synbindin signalling promotes ELK1 and RSK phosphorylation
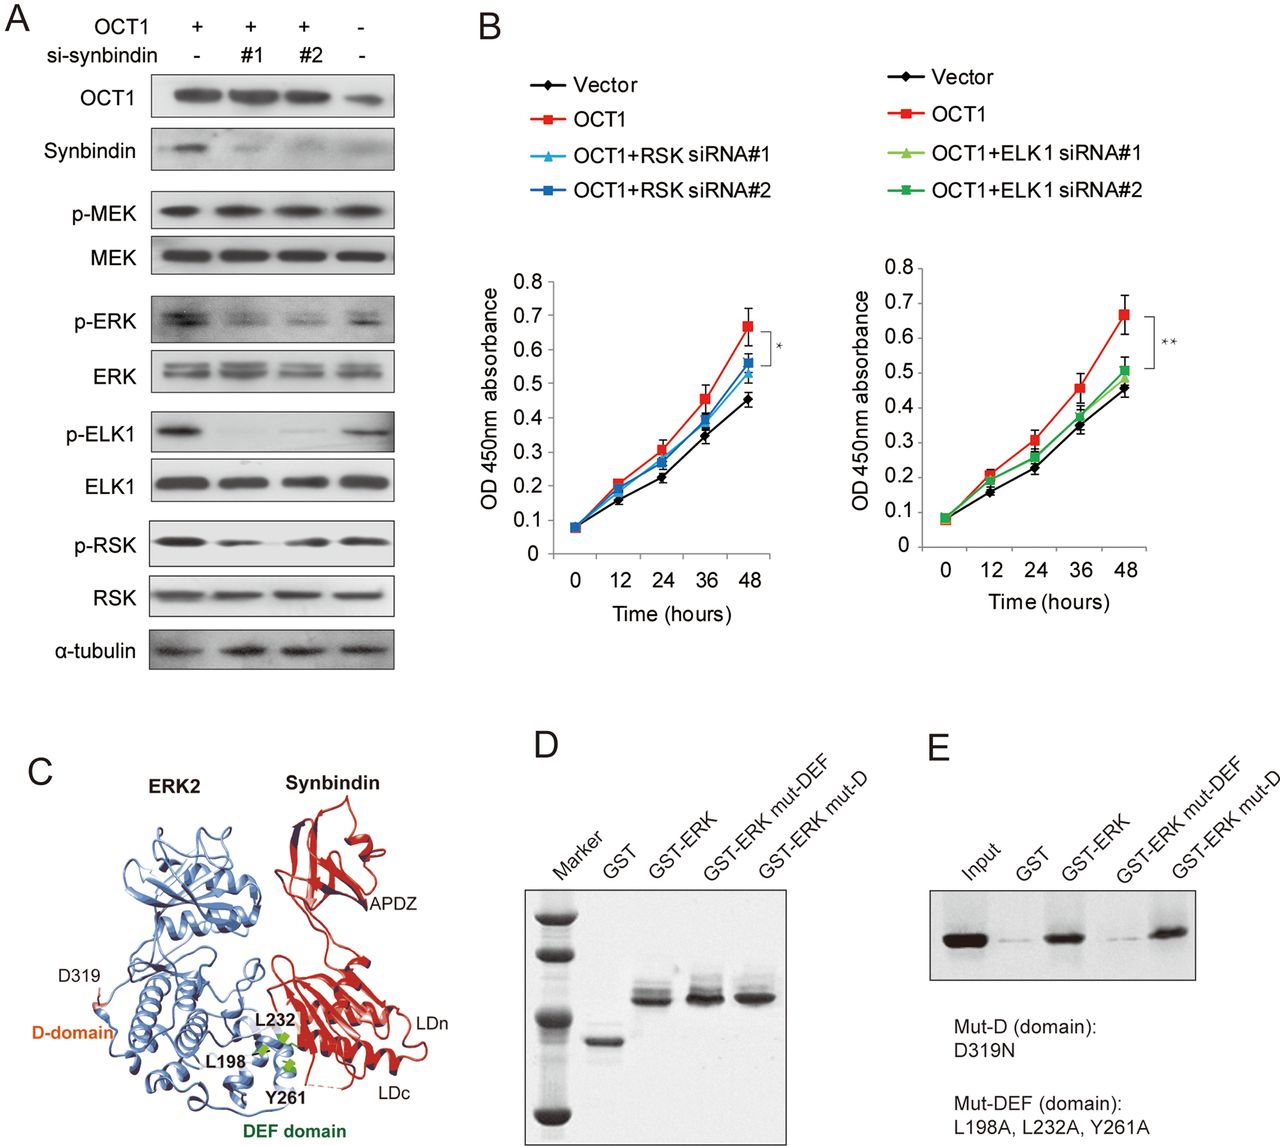
Previous studies suggested that ERK signalling can be spatially separated into substrates that bind to the DEF (docking site for ERK, FXFP) domain or the D (docing) domain.28 To determine the specific ERK substrates that are affected by OCT1 and synbindin, we used Western blot to detect the phosphorylation of ELK1 (DEF-domain substrate) and RSK (D-domain substrate) in MGC803 cells expressing ectopic OCT1. Interestingly, we found that the phosphorylation of ELK1 and RSK were both increased upon OCT1 upregulation, but the change of p-ELK1 was more pronounced (figure 6A). In support of this, OCT1 silencing in MKN45 cells substantially decreased ELK1 phosphorylation, while synbindin ectopic expression largely restored the p-ELK1 level. In contrast, OCT1 silencing only induced a mild decrease of p-RSK level (see online supplementary figure S5).

Effects of octamer transcription factor 1 (OCT1) on the phosphorylation of extracellular signal-regulated kinase (ERK) and substrate proteins. (A) Cells were transfected with OCT1 expression vector in the absence or presence of siRNAs specific for synbindin (si-synbindin #1 & #2), and the levels of pERK/ERK, p-ELK1/ELK1, p-RSK/RSK were detected by Western Blot. The α-tubulin level was used as loading control. (B) Effects of ectopic OCT1 expression and knockdown of ERK substrates (RSK and ELK1) on cell proliferation at the last time point (48h) using t-test (*P<0.05, **P<0.01). (C) The Hex spherical polar Fourier protein docking algorithm was employed to probe the synbindin-ERK complex conformation based on the crystallography structures of synbindin (PDB ID code 3EAP) and ERK2 (PDB ID code 2J0Z). (D) Input amount of the ERK mutants in D-domain (mut-D, D319N) and in DEF domain (mut-DEF, L198A, L232A, and Y261A) for GST pull-down assay. (E) The co-immunoprecipitated synbindin protein under each condition is shown in the Western Blot.
Accordingly, knockdown of ELK1 also abrogated the effect of OCT1 overexpression on cell proliferation, but RSK silencing only mildly affected the effect of OCT1 (figure 6B). Taken together, our data suggest that ELK1 (docked to DEF domain) plays more important roles in mediating the pro-malignant potentials of OCT1/synbindin.
Mode of synbindin–ERK interaction
We found previously that synbindin binds to MEK and ERK on the Golgi, facilitating ERK phosphorylation by MEK.9 In addition, the C-terminal Longin (LDc) domain of synbindin was found to interact with ERK protein. Here we further probe the structural motif of ERK that interacts with synbindin by protein–protein docking combined with experimental validation. The Hex spherical polar Fourier protein docking algorithm29 was implemented to determine the complex conformation of synbindin (PDB ID code 3EAP) and ERK2 (PDB ID code 2J0Z). Intriguingly, the synbindin LDc domain perfectly matched with the ERK DEF domain in terms of geometry and electrostatic complementation (figure 6C). The binding mode resembled the interaction between ERK and PEA-15 (an ERK spatial regulator)30 and a designed ankyrin repeat protein31 that has recently been determined by crystallography (see online supplementary figure S6A–C). Since the ERK amino acid residues Leu198, Leu232 and Tyr261 were found to be important for DEF docking,28 we proposed they might also be involved in the binding to synbindin. To test this, we fused ERK to glutathione S-transferase (GST) and generated mutations to disrupt the above residues (L198A, L232A and Y261A). The GST pull-down assay identified interaction between synbindin and wild-type ERK, which was abolished by mutations in the DEF domain (figure 6D,E). However, the control mutation D319N sitting in the D-domain did not affect the interaction between synbindin and ERK. These data suggest that synbindin binds to the DEF domain of ERK rather than the D domain. Protein docking suggested that synbindin–ERK interaction facilitates subsequent docking of MEK1 to the ERK activation loop (predicted model shown in online supplementary figure S6D), which seems to be relevant to the enhanced activation of ERK observed in our previous study.9
Further, we questioned whether potential phosphorylation of synbindin may be involved in this process. By analysing the PhosphoSite database32 that integrates published phosphorylation data using unbiased high-throughput proteomic approaches, we summarised the frequency of all detected protein phosphorylation in 32 reported GC cell lines (data in online supplementary table S2). The ERK2 protein was found as the most frequently phosphorylated protein in these GC cell lines (see online supplementary figure S6E), which is consistent with a previous report about the high prevalence of ERK activation in GC.5 Although 6497 phosphorylation sites were detected in the proteome, no phosphorylation of synbindin was identified in any cell line. Thus, the phosphorylation of synbindin does not seem to be required for ERK activation in GC cells. Taken together, these findings support our notion that synbindin facilitates MEK–ERK interaction and ERK phosphorylation, leading to activation of ERK substrates (proposed model shown in online supplementary figure S6F).
Effects of OCT1 on ERK activation and tumour growth in xenograft mouse model
Finally, we tested whether upregulation of OCT1 could promote tumourigenicity of GC cells in vivo using a xenograft model in nude mice. Stable cell lines carrying either OCT1 expression vector or the control vector were injected subcutaneously to the right flank of nude mice to allow xenograft tumour formation. At 14 days after first injection, mice in the OCT1 group and control group were sacrificed and the xenograft tissues were subjected to Western blot and immunofluorescence analyses. As a result, OCT1 was efficiently upregulated in the OCT1 group compared with the control group (figure 7A). Meanwhile, the expression levels of synbindin (figure 7B) and phosphorylated ERK2 (figure 7C) were significantly higher in the OCT1-upregulated group. These result were also confirmed by Western blot, which revealed a substantial increase in the levels of synbindin and phosphorylated (but not total) ERK2 in the tissues of the OCT1-upregulated group (figure 7D). As a result of enhanced ERK signalling, xenograft tumour growth in the OCT1-upregulated group was significantly faster than that of the control group (figure 7E–G). These results strongly supported our notion that OCT1 promotes gastric carcinogenesis and this effect involves synbindin-mediated ERK signalling activation.

Octamer transcription factor 1 (OCT1) promotes synbindin expression and extracellular signal-regulated kinase (ERK) phosphorylation in vivo. (A) The right panel shows statistical analysis of OCT1 expression based on multiple xenograft tumors (P<0.01, two-sided student t-test). (B) Representative image and statistical analysis of synbindin expression in xenograft tumors expressing OCT1 or control vector. Synbindin is stained using specific antibody in red. Scale bars indicate 10 μm. (C) The level of phoshporylated ERK (pERK) was dramatically increased by the expression of OCT1. (D) Western Blot of xenograft tissues in OCT1-expressing group and control group. (E) Growth curves of xenograft tumors expressing OCT1 or control vector. (F) Nude mice carrying xenograft tumors that expressed OCT1 or control vector. The ranges of tumors are marked by dashed lines. (G) Image of excised tumors expressing OCT1 or control vector. (H) Schematic representation for the OCT1-synbindin-ERK regulatory pathway proposed in this study. OCT1 transactivates synbindin, which is a core subunit of a tether complex on the Golgi involved in vesicle transportation. Synbindin functions as a molecular scaffold that binds to both MEK and ERK2, facilitating ERK phosphorylation on the Golgi apparatus. This promotes the activation of ERK substrates (especially the DEF-domain substrate ELK1), leading to potentiation of cell proliferation and invasion in gastric cancers.
Discussion
The OCT1 transcription factor, a homologue of the OCT4 pluripotency factor, was found to express in GC and its precancerous lesion. However, the functional implication and prognostic value of OCT1 in GC have been poorly defined. In this study we report recurrent amplification and upregulation of the OCT1 gene associated with poor prognosis of patients with GC. In addition, we reveal the underlying mechanism for such an association by demonstrating OCT1 as a determinant of synbindin-mediated ERK signalling and related aggressive phenotypes in GC cells.
First, our study identifies OCT1 as a promising biomarker for the diagnosis and prognosis of GC. OCT1 is significantly upregulated in GC and its precancerous lesion, and the expression of OCT1 can be conveniently detected by histochemistry of tissue biopsy obtained by gastric endoscopy. Thus, OCT1 should be further evaluated for its diagnostic value in early GC. Importantly, the strong association between OCT1 upregulation and poor outcome of patients with GC has been confirmed by our data and an independent dataset. In addition, the prognostic significance of OCT1 CNV is also supported by two independent datasets. These interesting results suggest that OCT1 overexpression (detectable by immunohistochemistry) or gained CNV (by FISH) can be used as prognostic markers in GC. The GSEA indicated that OCT1 overexpression marks activation of the RAS/ERK signalling pathway, thus may provide useful information for targeted therapy.
The recurrent amplification of the OCT1 gene and its prominent ability to increase tumour aggressiveness suggest that OCT1 may play a driving role in gastric carcinogenesis. Thus, targeting OCT1 may present a favourable therapeutic strategy for GC cells, especially for the cases with deregulated ERK signalling. Interestingly, OCT1 has recently been reported to be associated with ERK signalling in oesophageal carcinogenesis,33 suggesting that OCT1 may affect ERK signalling and cancer aggressiveness in a broader scenario. Thus, it warrants further studies to clarify the clinical and biological relevance of OCT1 in other types of cancers.
By demonstrating the effect of OCT1 on transactivating synbindin, we are able to provide a more complete model for the spatial regulation of ERK signalling on the Golgi apparatus (schematic representation in figure 7H). Apart from the canonical Ras-Raf-MEK-ERK signal transduction flow, recent studies have stressed the importance of ERK signalling regulation in specific subcellular compartments, a so-called ‘spatial regulatory’ mechanism.34 In our recent studies,9 we identified synbindin as a key molecular scaffold that confers spatial regulation of ERK signalling on the Golgi (illustrated in figure 7H). In this study, we further identify OCT1 as an upstream regulator of synbindin in GC and provide structural insight into synbindin-mediated ERK activation. We show that synbindin LDc domain binds to the DEF domain of ERK, leading to phosphorylation of ERK substrates (especially DEF-domain substrate) and increased cell aggressiveness. Importantly, our study on GC tissue samples reported a strong correlation between OCT1 expression and ERK2 phosphorylation levels (p<0.0001), suggesting that OCT1 is a crucial regulator for ERK2 activation in GC. The recurrent amplification of the OCT1 gene, together with its regulation on synbindin-related ERK signalling, suggests OCT1 as a potential driver of malignant behaviours of GC cells.
The effects of OCT1 on ERK signalling may also help to explain other reported activities of OCT1. As a homologue of OCT4 pluripotency factor, OCT1 has been found without the ability to induce pluripotency.35 Instead, OCT1 was suggested to associate with the self-renewal of cancer stem cells36 and the epithelial–mesenchymal transition (EMT) process.16 Interestingly, ERK signalling has also been found to be crucial for the stem-like cells in multiple cancers, including GC,37 colorectal cancer,38 prostate cancer,39 breast cancer40 and glioblastoma.41 Recent studies have also clearly demonstrated the important roles of ERK signalling in the EMT process.42–44 Thus, it warrants further study whether OCT1 may contribute to the stem-like behaviours of cancer cells and the EMT process by regulating of the ERK signalling pathway.
In conclusion, our results identify OCT1 as a determinant of synbindin-mediated activation of ERK signalling in GC, and OCT1 is a potential prognostic marker and therapeutic target in GC.
References
Supplementary materials
Supplementary Data
This web only file has been produced by the BMJ Publishing Group from an electronic file supplied by the author(s) and has not been edited for content.
Files in this Data Supplement:
- Data supplement 1 - Online supplement
- Data supplement 2 - Online table 1
- Data supplement 3 - Online table 2
Footnotes
-
Contributors JQ and JX wrote the paper. JQ, XK, JW, HC and YH conducted the experiments. ND and PT contributed data. JX, HC, WZ and J-YF analysed data. J-YF and JX supervised the research. JQ and XK contributed equally.
-
Funding This project was supported by grants from the National Basic Research Program of China 973 Program (2010CB5293), the National High Technology Research and Development Program of China 863 Program (2012AA02A504), the Program for Innovative Research Team of Shanghai Municipal Education Commission, and National Natural Science Foundation of China (30971330, 31371420, 81320108024) to JY Fang. The project was also partially supported by National Natural Science Foundation of China (81000861, 81322036, and 81272383), Shanghai ‘Oriental Scholars’ project (2013XJ), Shanghai Science and Technology Commission ‘Pujiang Project’ (13PJ1405900), and Shanghai Natural Science Foundation (12ZR1417900) to J Xu. The sponsors of this study had no role in the collection of the data, the analysis and interpretation of the data, the decision to submit the manuscript for publication, or the writing of the manuscript.
-
Competing interests None.
-
Patient consent Obtained.
-
Ethics approval Ethics approval was provided by the Ethics Committee of the Shanghai Jiao-Tong University School of Medicine, Renji Hospital.
-
Provenance and peer review Not commissioned; externally peer reviewed.