Article Text

Abstract
Objective Individuals with obesity and type 2 diabetes differ from lean and healthy individuals in their abundance of certain gut microbial species and microbial gene richness. Abundance of Akkermansia muciniphila, a mucin-degrading bacterium, has been inversely associated with body fat mass and glucose intolerance in mice, but more evidence is needed in humans. The impact of diet and weight loss on this bacterial species is unknown. Our objective was to evaluate the association between faecal A. muciniphila abundance, faecal microbiome gene richness, diet, host characteristics, and their changes after calorie restriction (CR).
Design The intervention consisted of a 6-week CR period followed by a 6-week weight stabilisation diet in overweight and obese adults (N=49, including 41 women). Faecal A. muciniphila abundance, faecal microbial gene richness, diet and bioclinical parameters were measured at baseline and after CR and weight stabilisation.
Results At baseline A. muciniphila was inversely related to fasting glucose, waist-to-hip ratio and subcutaneous adipocyte diameter. Subjects with higher gene richness and A. muciniphila abundance exhibited the healthiest metabolic status, particularly in fasting plasma glucose, plasma triglycerides and body fat distribution. Individuals with higher baseline A. muciniphila displayed greater improvement in insulin sensitivity markers and other clinical parameters after CR. These participants also experienced a reduction in A. muciniphila abundance, but it remained significantly higher than in individuals with lower baseline abundance. A. muciniphila was associated with microbial species known to be related to health.
Conclusions A. muciniphila is associated with a healthier metabolic status and better clinical outcomes after CR in overweight/obese adults. The interaction between gut microbiota ecology and A. muciniphila warrants further investigation.
Trial registration number NCT01314690.
- OBESITY
- INTESTINAL BACTERIA
- GLUCOSE METABOLISM
Statistics from Altmetric.com
Significance of this study
What is already known on this subject?
Evidence suggests that gut microbiota diversity and metabolic function play an important role in the development of obesity and related metabolic disorders.
Dietary changes including calorie restriction can profoundly impact the gut microbiota.
Akkermansia muciniphila is associated with healthier glucose metabolism and leanness in mice but this is less conclusive in humans.
What are the new findings?
Higher A. muciniphila abundance is associated with a healthier metabolic status in overweight/obese humans.
There is an interaction between gut microbiome richness, certain metagenomic species and A. muciniphila, whereby higher abundance of this species together with greater microbial gene richness are associated with a healthier metabolic status.
Higher abundance of A. muciniphila at baseline is associated with greater improvement in glucose homoeostasis, blood lipids and body composition after calorie restriction.
How might it impact on clinical practice in the foreseeable future?
Our findings demonstrate the need for further investigation to ascertain the therapeutic applicability of A. muciniphila in the treatment of insulin resistance.
A. muciniphila may be identified as a diagnostic or prognostic tool to predict the potential success of dietary interventions.
Introduction
Altered gut microbiota composition and function contribute to the development of obesity in mice and its associated comorbidities in mice and humans.1–5 There is increasing evidence showing interactions between environmental factors, gut microbiota, metabolic diseases and cardiovascular risks.5–7 Specific bacterial groups have been implicated in obesity and related metabolic diseases, and may therefore be considered as therapeutic targets. As such, Akkermansia muciniphila, a mucin-degrading bacterium, was proposed to be a contributor to the maintenance of gut health8–10 and glucose homoeostasis.11 We, and others, have shown in mouse studies a causative role for this species in lowering body fat mass, improving glucose homoeostasis, decreasing adipose tissue inflammation and increasing gut integrity.12–14 The latter was demonstrated following oral administration of A. muciniphila that led to increased mucin layer thickness, decreased metabolic endotoxaemia12 and increased number of goblet cells.13
In humans, the role of A. muciniphila remains ambiguous. One study reported that A. muciniphila was more abundant in subjects with normal glucose tolerance compared with a prediabetic group.15 The opposite relationship was seen by others, where A. muciniphila was enriched in patients with type 2 diabetes (T2D) compared with non-diabetic controls.16 These two studies were conducted in lean/overweight Chinese adult populations with a wide age range. A third study in normal weight 70-year-old European women showed that A. muciniphila was not among the species applicable to classify women as having T2D.17 This discrepancy may be due to differences in study design, methodology and population characteristics such as ethnicity, age and diet.18
Studying changes in A. muciniphila after an intervention known for improving metabolic health offers stronger evidence of its role than measuring cross-sectional relationships. Weight loss through calorie restriction (CR) or bariatric surgery has a profound effect on gut microbiota.19 ,20 Characteristics of the gut ecosystem, such as high microbial gene richness, have been associated with better cardiometabolic health and improvements in clinical characteristics after a diet-induced weight loss intervention.21 ,22 Limited available evidence suggests that A. muciniphila increases with bariatric surgery in humans and mice,23–26 but there is no evidence on the effects of CR.
We have previously published results from this dietary intervention,21 ,27 where overweight and obese individuals underwent weight loss through CR followed by weight stabilisation (WS). In the same cohort, we herein aim to evaluate the potential associations between A. muciniphila with microbial gene richness, diet, host anthropometric and metabolic parameters, and further address their changes after the intervention.
Materials and methods
Study population
This dietary intervention was conducted at the Institute of Cardiometabolism and Nutrition, Pitié-Salpêtrière Hospital in Paris, France. The 49 participants were overweight (N=11) or obese (N=38) (male:female=8:41), and have been previously described in detail.21 ,27 A smaller sample size has been specified when there is missing data. Briefly, subjects had no diabetes, chronic or inflammatory diseases. No antibiotics were taken for 2 months before stool collection. Details of the dietary intervention, which consisted of a 6-week CR diet enriched with fibres and protein followed by a 6-week WS period have been previously described.27
Body composition and biochemical parameters
Anthropometric measurements included body mass index (BMI), waist and hip circumference and waist-to-hip ratio. Total body fat, fat-free mass, gynoid and android fat proportions were determined using dual energy X-ray absorptiometry, as previously described.28
Blood samples were collected after a 12-h fast at baseline, week 6 and week 12. Measurements included blood lipids, namely non-esterified fatty acids (NEFA), triglycerides (TGs), total cholesterol (TC), low density lipoprotein (LDL), cholesterol and high density lipoprotein (HDL). Inflammatory and endotoxaemia markers included high sensitivity C reactive protein, interleukin 6 (IL-6)29 and lipopolysaccharide,30 as described previously.27 Aspartate transaminase, alanine transaminase and γ-glutamyl transpeptidase were measured as part of a clinical blood panel (laboratory-established normal ranges: 20–32 IU/L, 20–35 IU/L and 8–36 IU/L, respectively).
The Homeostasis Model Assessment of Insulin Resistance Index (HOMA-IR) was calculated using the HOMA2Calculator developed by Levy et al,31 which uses mathematical modelling and a healthy reference population to determine insulin sensitivity. Glucose and insulin area under the curve (AUC) from the oral glucose tolerance test (OGTT) were calculated, and the Disse index32 was derived using the formula:
Adipocyte morphology and adipose tissue macrophages
Subcutaneous white adipose tissue (scWAT) samples were obtained at baseline, week 6 and week 12 by needle biopsy from the periumbilical region under local anaesthesia.33 Adipocyte diameter was quantified as previously described.34 Adipocyte morphology in relation to fat mass was measured using the curve fitting model developed by Spalding et al to describe associations between adipocyte volume, number and body fat.35 ,36 The formula with re-estimated parameters is:
Observed adipocyte volume37 was calculated with the formula:
HAM56 was measured as a marker of scWAT macrophages with monoclonal antibody (DakoCytomation). HAM56 positive cells were quantified as a percentage of total adipocyte number.38
Metabolic phenotyping of serum by 1H NMR spectroscopy
Serum samples were prepared and analysed on a nuclear magnetic resonance (NMR) spectrometer (Bruker) operating at 600.22 MHz 1H frequency as previously described,39 using 350 µL of sample mixed with 350 µL of buffer before centrifugation at 12000 g at 4°C for 5 min. The 1H NMR spectra were preprocessed and metabolic signals were recovered using statistical recoupling of variables.40
Faecal microbiota
A quantitative metagenomics (QM) approach was used to characterise the faecal microbiota with high resolution. Briefly, high-throughput SOLiD sequencing was performed on total faecal DNA as described in Cotillard et al.21 Reads were mapped and counted onto the 3.9 million gene catalogue,41 after cleaning for quality, human, plant and cow origin using the Meteor Studio platform. The metagenomic species (MGS) catalogue published by Nielsen et al was used to cluster gene profiles in the current study. We used the Le Chatelier et al22 methodology implemented in the MetaOMineR pipeline to compute MGS tracer profiles, where we calculated the mean of the 50 most correlated bacterial genes after filtering at 20% presence and used only large MGS with more than 500 genes to focus on potential bacterial species. The taxonomic annotation is an updated version of the published data set. The methodology for stratification as a function of gene richness (low gene count, LGC and high gene count, HGC) was as formerly described and is based on the first metagenomics catalogue.21 ,22
A. muciniphila quantification
A. muciniphila was quantified with qPCR as described in Everard et al.12 Briefly, DNA was extracted from faecal samples,27 and qPCR (Applied Biosystems) was done using the 16S rRNA primers for A. muciniphila detection and amplification: forward CAGCACGTGAAGGTGGGGAC and reverse CCTTGCGGTTG GCTTCAGAT. Total 16S rRNA was also quantified and used to normalise A. muciniphila using bacterial universal primers: forward ACTCCTACGGGAGGCAGCAG and reverse ATTACCGCGGCTGCTGG. Each assay was performed in duplicate. The cycle threshold of each sample was then compared with a standard curve (performed in triplicate) made by diluting genomic DNA (fivefold serial dilution) (DSMZ, Braunschweig, Germany).
A. muciniphila was also quantified using QM (GU:154), as some of the analysis included direct comparisons between qPCR and QM data, and good agreement was found between the two methods (see online supplementary figures S1 and S2).
Diet mean adequacy ratio
Diet was assessed with 7-day unweighted food records completed just before baseline, week 6 and week 12, as previously described.34 We used the mean adequacy ratio (MAR) as an indicator of global nutrient adequacy of the diet.42 ,43 The MAR is the mean nutrient adequacy ratio (NAR) for 16 nutrients (proteins, fibre, retinol equivalents, thiamine, riboflavin, niacin, vitamin B6, folates, vitamin B12, ascorbic acid, vitamin D, vitamin E, calcium, potassium, iron and magnesium). Each NAR was calculated as the mean intake of a nutrient divided by the French Recommended Dietary Allowance44 and multiplied by 100. To avoid compensation of high intake of one nutrient for low intake of another, each NAR was truncated at 100. The MAR ranges from 0 to 100; the higher the score, the better the global nutrient adequacy of the diet.
Bayesian network
A Bayesian network was constructed in order to simultaneously study associations between relevant variables and A. muciniphila qPCR abundance. Bayesian networks are probabilistic graphical models used to represent complex associations. The variables are the vertices in the graph, and the edges are the direct dependencies between them. We applied the Hill Climbing algorithm, which belongs to a family of local search techniques that performs a heuristic search based on scoring metrics. The Bayesian Information Criterion was used as a scoring function. These procedures were conducted using the bnlearn R package, V.3.6.45
Statistical analysis
Normally distributed data were analysed using parametrical tests (paired t test and analysis of covariance (ANCOVA) with age and sex as covariates). For variables with a skewed distribution or when conducting analysis of groups with small sample size (ie, categorization by lower/higher A. muciniphila abundance and low/high gene richness: Akk LO/HI by LGC/HGC, see results section) non-parametrical tests were conducted (Wilcoxon rank sum test or Kruskal-Wallis followed by multiple signed rank sum tests for individual comparisons with Bonferroni correction). Spearman analysis was used to determine correlation between variables. Values in tables are reported as mean (SE), or adjusted mean (SE) in the case of ANCOVA. In figures data are reported as box plots or as means or adjusted means±SE. Statistical significance was set as α=0.05, except in post hoc analysis with Bonferroni correction. OGTT curve analysis was done using repeated measures analysis of variance (ANOVA). Microbiome analyses were performed using the MetaOMineR package (Prifti and Le Chatelier, in preparation). SAS V.9.3 for Windows (SAS Institute, Cary, North Carolina, USA) and R were used for all statistical analyses.
Results
Baseline comparison between Akk LO and Akk HI groups
A. muciniphila is associated with a healthier metabolic status
The log10 transformed A. muciniphila was normalised to log10 total bacterial content and we refer to this measurement as A. muciniphila. There was no difference in faecal A. muciniphila abundance between overweight and obese subjects (−2.57±2.18 and −2.38±1.72, p=0.97, respectively). A. muciniphila abundance had a bimodal distribution, consistent with that seen in QM (see online supplementary figure S1). Therefore, baseline A. muciniphila abundance was categorised around the baseline median and groups were defined as having lower abundance (Akk LO, abundance<median, N=24) or higher abundance (Akk HI, abundance≥median, N=25). Sex and average age did not differ between Akk LO and Akk HI groups (table 1). However, there was a higher number of younger subjects (age ≤median, N=17) in the Akk HI group than older subjects (age >median, N=8). Further analyses were subsequently adjusted by age and sex.
Comparison between clinical variables categorised into Akkermansia muciniphila abundance groups
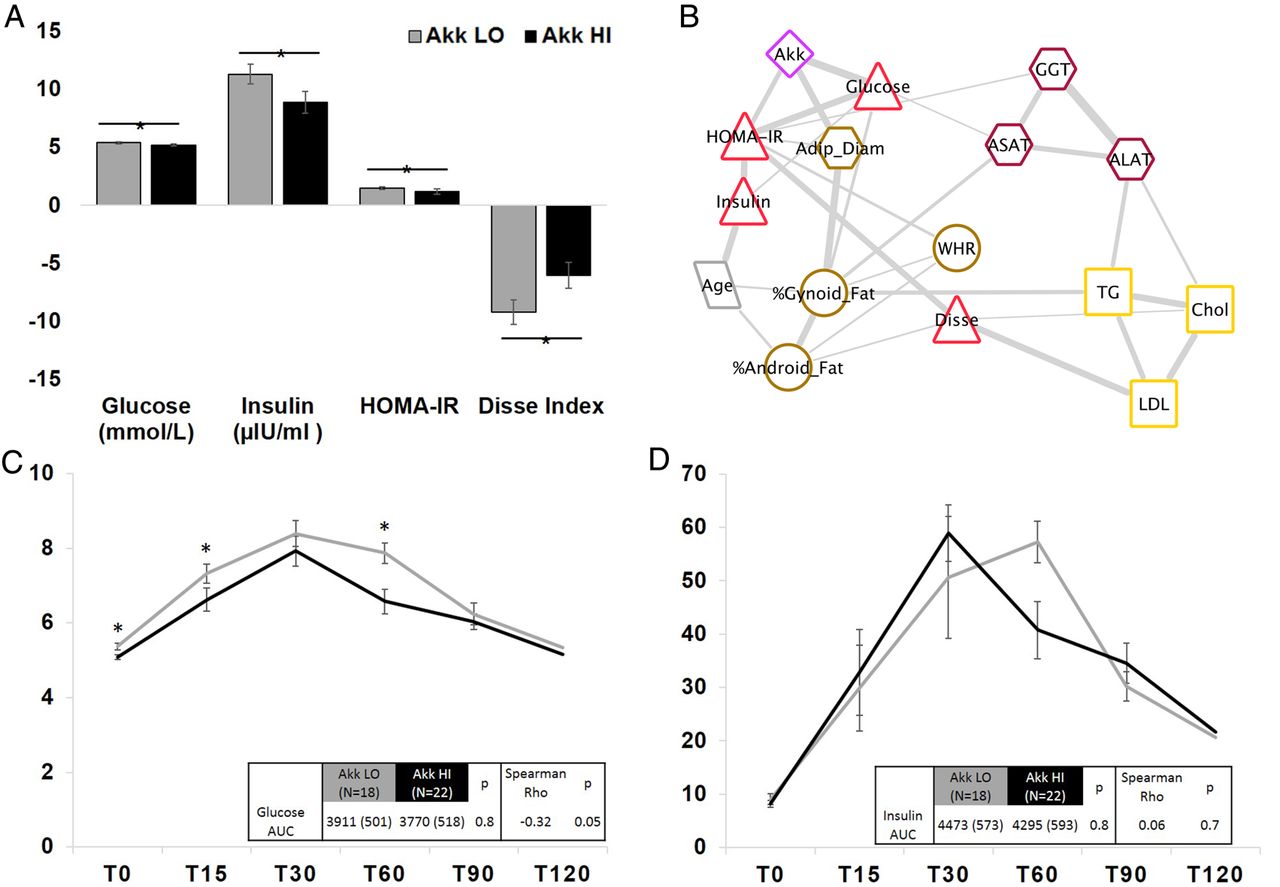
Subjects in the Akk HI group had a healthier metabolic status, as shown by a lower waist-to-hip ratio, leptin and surrogates of insulin sensitivity (table 1). The Akk HI group had lower fasting blood glucose and insulin. Fasting blood glucose was inversely associated with A. muciniphila (see online supplementary figure S3). HOMA-IR and Disse index suggested higher insulin sensitivity in the Akk HI group compared with the Akk LO group (table 1 and figure 1A). Furthermore, there was an inverse association between glucose AUC during OGTT and A. muciniphila abundance (figure 1C). Glycaemia at T15 and glycaemia at T60 were significantly higher in the Akk LO group. Aspartate transaminase and γ-glutamyl transpeptidase were lower in the Akk HI group and average values were in the normal range while they were elevated in Akk LO patients (table 1).

Association between Akkermansia muciniphila abundance and markers of insulin sensitivity. (A) Comparison of fasting glucose, insulin, HOMA-IR and Disse index between Akk LO and Akk HI groups. (B) Bayesian network showing the dependencies between variables selected based on their association with A. muciniphila. The thickness of the edges connecting the vertices (variables) represents the weight of dependencies between variables. Akk, A. muciniphila; WHR, waist-to-hip ratio; Adip_Diam, adipocyte diameter; TG, triglycerides; Chol, total cholesterol; HOMA-IR, Homeostasis Model Assessment of Insulin Resistance Index; Disse, Disse index; AST, aspartate transaminase; ALT, alanine transaminase; GGT, γ-glutamyl transpeptidase. (C and D) Oral glucose tolerance test (OGTT) glucose and insulin curves, respectively (included times: 0 min, 15 min, 30 min, 60 min, 90 min and 120 min), with comparison in glucose AUC between Akk LO (N=18) and Akk HI (N=22) by ANCOVA adjusting for age and sex. Spearman correlation between glucose or insulin AUC and A. muciniphila abundance is shown. Akk LO, A. muciniphila below the median; Akk HI, A. muciniphila at or above the median.
A. muciniphila is inversely associated with adipocyte size
ScWAT adipocyte diameter, but not total fat mass, was inversely associated with A. muciniphila abundance (figure 2A, B), and Akk HI had lower mean adipocyte size (table 1). When fitting the formula developed by Spalding et al35 to describe the association between adipocyte volume and fat mass the Akk HI group tended to fall below the theoretical curve (figure 2C) as quantified in a residual plot (figure 2D), suggesting increased adipocyte hyperplasia in Akk HI subjects.

Relationship between adipocyte volume and body fat mass according to Akkermansia muciniphila groups. (A) Spearman correlation between A. muciniphila and kg fat mass. (B) Spearman correlation between A. muciniphila and adipocyte diameter. (C) Association between adipocyte volume and body fat mass in relation to fitted curve, with black circles representing the Akk HI group and white circles the Akk LO group. (D) Residuals of data points in part C. Akk LO. A. muciniphila below the median; Akk HI, A. muciniphila at or above the median.
Signature associated with A. muciniphila abundance
To study associations between relevant variables simultaneously at baseline, and examine the strongest associations with A. muciniphila abundance, a Bayesian network was built (figure 1B). Corroborating the observations from the univariate analysis, the clinical factors most dependent (d) with baseline A. muciniphila abundance are fasting glucose (d=0.86), HOMA-IR (d=0.66) and mean adipocyte diameter (d=0.84).
Changes with CR intervention
The Akk HI group had greatest benefits from the dietary intervention
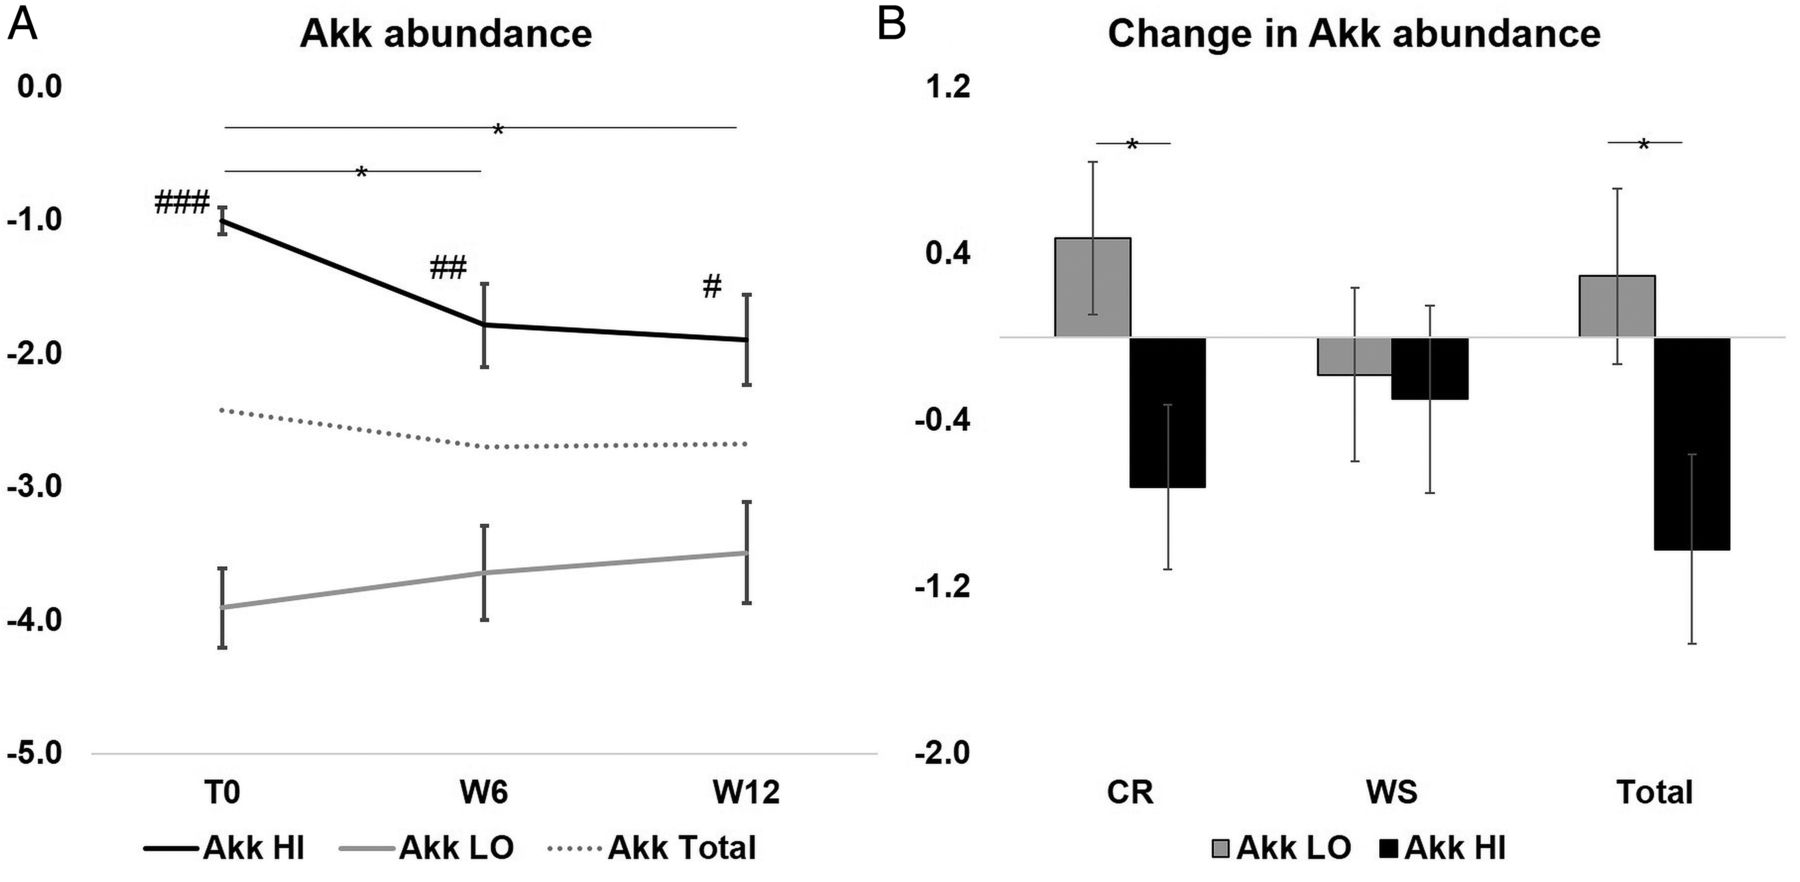
There was no difference in weight loss between the Akk HI and Akk LO groups (data not shown). While there was a decrease in A. muciniphila abundance in the Akk HI group after CR and the total intervention period, it remained consistently and significantly higher than the Akk LO group (more than 100 times difference, figure 3A and see online supplementary figure S2), although the range of abundance became more spread out after CR and WS in both groups (see online supplementary figure 4A). The change in A. muciniphila abundance was different between the two groups after CR and the 12-week period (figure 3B). The Akk HI group remained metabolically healthier throughout the dietary intervention, with a tendency for a higher Disse index after CR and WS (figure 4A, E), a greater improvement of total and LDL cholesterol after CR and total intervention period (figure 4C, D and G, H), and a continued decrease in waist circumference (WC) during the WS period (figure 4B, F).

Changes in Akkermansia muciniphila abundance with dietary intervention. (A) Paired t test was used to measure the within-group change in A. muciniphila abundance, mean (SE) is shown; *p<0.05 with paired t test; #p<0.01, ##p<0.001 and ###p≤0.0001 with t test between Akk LO and Akk HI at each time point. (B) ANCOVA adjusting for age and sex was used to compare the change between Akk LO and Akk HI groups, adjusted mean change (SE) is shown; p<0.05. CR, calorie restriction; WS, weight stabilisation; Akk LO, A. muciniphila below the median; Akk HI, A. muciniphila at or above the median.

Comparing the effect of dietary intervention on bioclinical parameters between Akkermansia muciniphila groups. (A–D) Paired t test was used to measure the within-group change in Disse index (A), waist circumference (B), and total and LDL cholesterol (C and D); mean (SE) is shown. (E–H): ANCOVA adjusting for sex, age and baseline value was used to compare the change between Akk LO and Akk HI groups in Disse index (E), waist circumference (F), and total and LDL cholesterol (G,H); adjusted mean change (SE) is shown. *p≤0.05; **p≤0.01; ***p≤0.001; ****p≤0.0001; CR, calorie restriction; WS, weight stabilisation; Total=T0 to W12. Akk LO, A. muciniphila below the median (grey bars and lines); Akk HI, A. muciniphila at or above the median (black bars and lines).
Serum acetate correlates with A. muciniphila at baseline
A. muciniphila is a producer of short chain fatty acids (SCFA), primarily acetate and propionate.46 ,47 The latter is not usually detectable in serum by 1H NMR spectroscopy, but serum acetate was positively correlated with A. muciniphila abundance (figure 5A). There was a reduction in serum acetate throughout the dietary intervention in the total population as well as the Akk LO and Akk HI groups. Although it remained higher in Akk HI group, change in serum acetate concentrations was not different between groups (figure 5B, C).

Serum acetate and Akkermansia muciniphila. (A) Spearman correlation between serum acetate and A. muciniphila abundance. (B) Within-group change in serum acetate assessed by paired t test, mean (SE) shown, *p≤0.05. (C) Comparison of change in serum acetate between Akk groups, mean (SE) shown; t test. Akk LO, A. muciniphila below the median; Akk HI, A. muciniphila at or above the median; CR, calorie restriction; WS, weight stabilisation.
A. muciniphila and the microbial ecosystem
It is likely that the association between faecal microbiota and health indicators is not attributable to a single microbe, but rather to an ecosystem that influences the complicated interaction between host biology and environment. As such, we studied A. muciniphila abundance in relation to the microbiome-wide MGS abundance and microbial gene richness.
A. muciniphila and MGS abundance
There were 27 large MGS (>500 genes) associated with A. muciniphila abundance throughout the intervention (p<0.01, including the A. muciniphila MGS, 13 Firmicutes, 5 Bacteroidetes, 1 Actinobacteria and 1 Euryarchaeota) (figure 6A). Nineteen of these MGS (70%) were more abundant in the Akk HI group. Some of the 26 MGS remained associated with A. muciniphila abundance throughout the intervention, while for others this association was lost at week 6, or lost and then regained at week 12. These 26 MGS represented less than 20% of the microbiome at all times when considering the large MGS as a reference (figure 6B).
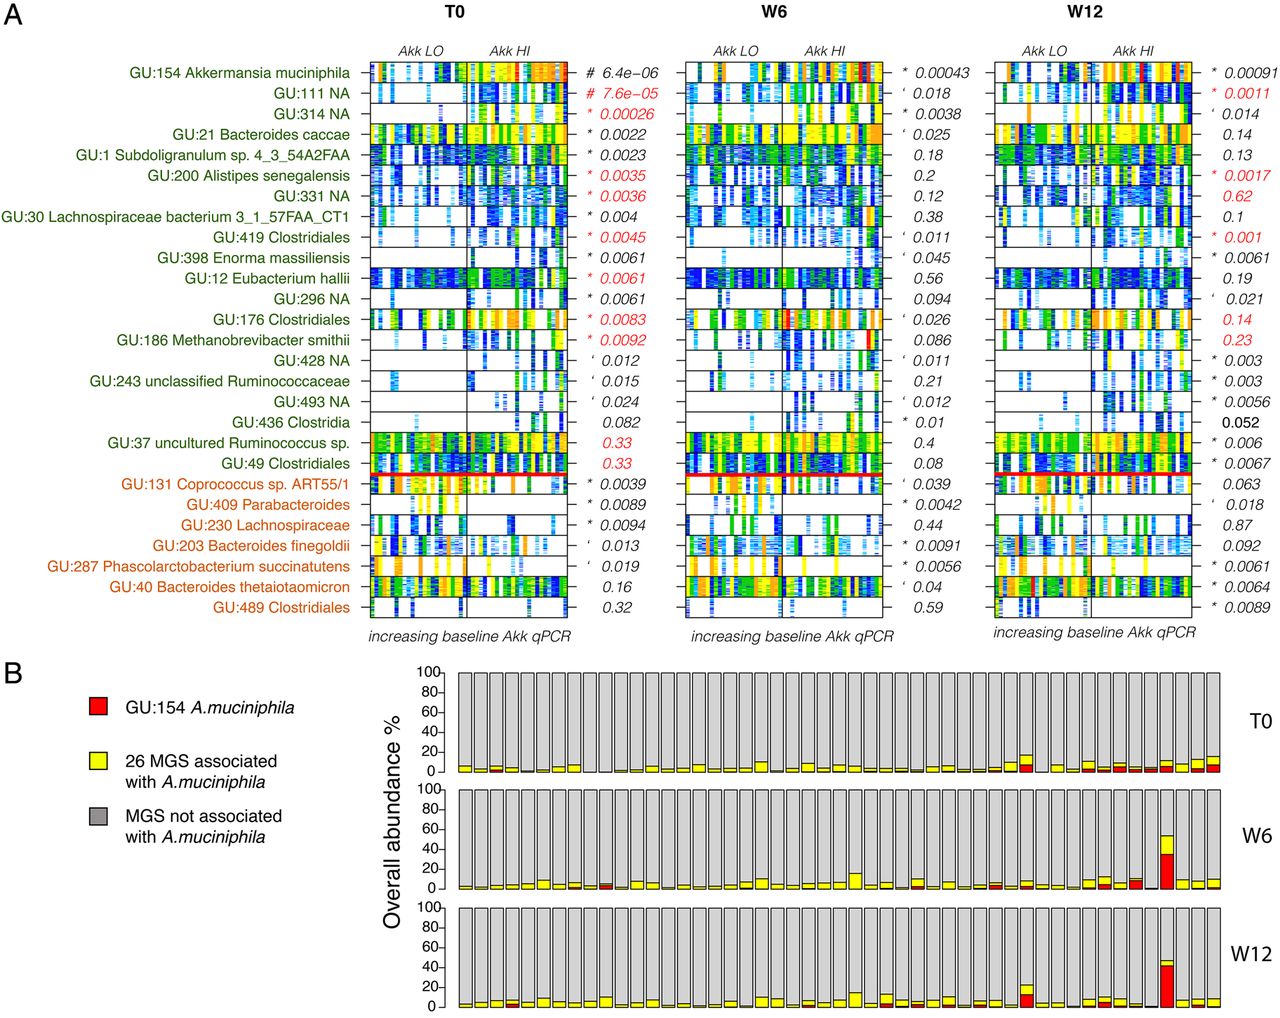
Association between Akkermansia muciniphila and metagenomic species. (A) Barcodes indicating the presence and abundance of the metagenomic species (MGS) that are significantly abundant between Akk LO and Akk HI (Wilcoxon p<0.01) in a given time point. White is absent and abundance increases from light blue to dark red. Samples are sorted by A. muciniphila baseline abundance. Green text indicates MGS that are more abundant in the Akk HI group at baseline and in brown in the Akk LO group. p Values in red indicate MGS that are correlated with gene richness; # significant q-value; ‘p<0.05; *p<0.01. (B) Cumulative abundance load of the A. muciniphila MGS (red) and the 26 associated MGS (yellow) compared with the rest of the MGS (with more than 500 genes) in grey.
Individuals with higher A. muciniphila and gene richness have healthiest metabolic profile
We previously reported that high faecal gene richness was associated with healthier baseline metabolic status and with better outcomes from the dietary intervention.21 We therefore studied the relationship between A. muciniphila abundance and bioclinical parameters in the context of gene richness, leading to the definition of four groups: Akk LO, LGC; Akk HI, LGC; Akk LO, HGC; and Akk HI, HGC. The Akk HI, HGC group had the best metabolic status with the lowest median per cent android fat, fasting glucose and TGs, and the highest median per cent gynoid fat (figure 7A–D). Most importantly, after the CR and WS phases, this group remained metabolically healthier (see online supplementary figure S5). Linear regression analysis showed that the interaction term had the largest effect size for body fat distribution and TGs, while Akk LO/HI had the biggest effect size for glucose (see online supplementary table S1).

Clinical parameters that differ across Akkermansia. muciniphila and gene richness groups. A. muciniphila x gene count groups were compared: (A) % android fat; (B) % gynoid fat; (C) fasting plasma glucose; and (D) fasting plasma triglycerides. Akk LO, A. muciniphila below the median; Akk HI, A. muciniphila at or above the median; HGC, high gene count; LGC, low gene count. Kruskal-Wallis followed by Wilcoxon rank sum test for individual comparisons with Bonferroni adjustment. Sample sizes are Akk LO, LGC N=9; Akk HI, LGC N=9; Akk LO, HGC N=11; Akk HI, HGC N=16 (p=0.56, Fisher's exact test).
A. muciniphila and dietary intake
At baseline, dietary intake did not greatly differ between the Akk LO and Akk HI groups. However, age was identified as a confounder for diet, with older subjects having a healthier diet than younger subjects, that is, higher consumption of dairy products, fruits and vegetables and fish, and lower consumption of sugary drinks.48 There were no significant differences in the 16 NARs and the MAR between the Akk LO and Akk HI groups (figure 8A and see online supplementary table S2), but older subjects tended to have higher NARs of several nutrients (data not shown) and had a significantly higher MAR than younger subjects (figure 8B). During the WS period, older subjects experienced a greater increase in MAR (figure 8D).

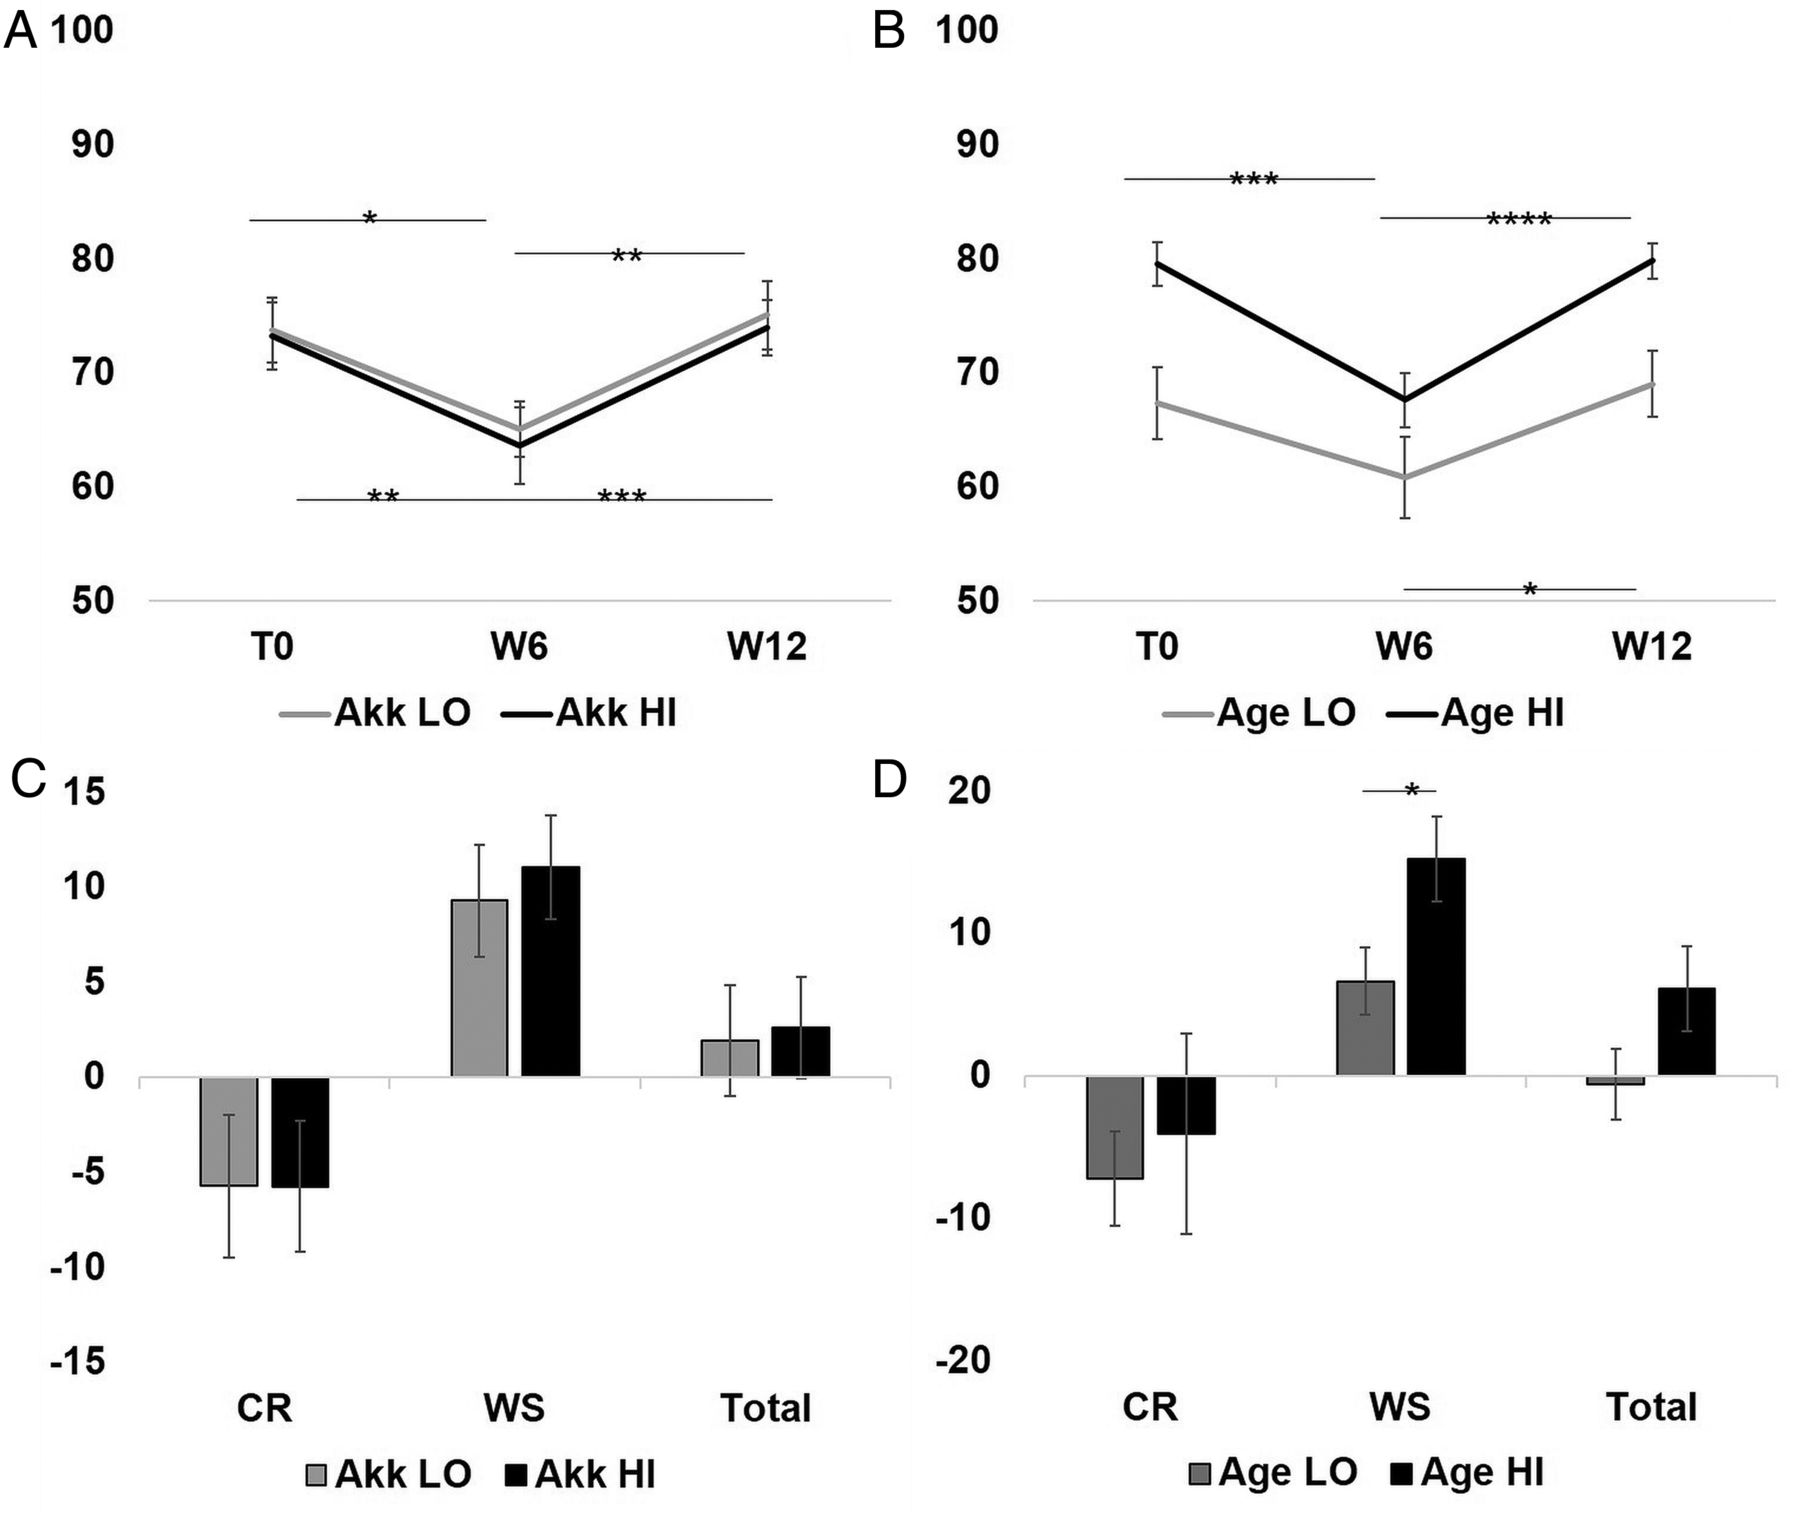
Change in mean adequacy ratio (MAR) diet quality score by Akkermansia muciniphila abundance and age over the different stages of the dietary intervention. (A and B) Paired t test was used to measure the within-group change in MAR. (C) ANCOVA adjusting for age, sex and baseline MAR value was used to compare the change between Akk categories. (D) ANCOVA adjusting for sex and baseline MAR value was used to compare the change between age categories. In A–B mean (SE), and in C–D adjusted mean change (SE) is shown. *p≤0.05; **p≤0.01; ***p≤0.001; ****p≤0.0001. CR, calorie restriction; WS, weight stabilisation. Akk LO, A. muciniphila below the median, N=15; Akk HI, A. muciniphila at or above the median, N=21. Age LO, Age below population median, N=18; Age HI, Age at or above the population median, N=18.
When studying the change in MAR, there was no difference in diet quality between Akk LO and Akk HI at any time point (figure 8A and see online supplementary table S2). These results did not change after adjustment for total energy intake. As expected, in either categorisation (age or A. muciniphila abundance) MAR significantly decreased during the CR period and increased after the WS period.
Discussion
We herein show in overweight and obese individuals that higher A. muciniphila abundance is associated with a healthier metabolic status, particularly with higher insulin sensitivity at baseline and improvement after CR and WS, thus confirming in humans what had been observed in murine models.12–14 Subjects with higher A. muciniphila and gene richness are metabolically healthier before and after the dietary intervention, thus demonstrating an interaction between gut bacterial richness and A. muciniphila abundance.
Murine studies showed a positive correlation between A. muciniphila and health, and established causality, where induced A. muciniphila expansion led to improved metabolism.12–14 Our results show an association between A. muciniphila and a healthier insulin sensitivity profile, and indicate that higher A. muciniphila abundance is linked to better outcomes after weight loss through CR. Importantly, A. muciniphila abundance in the Akk HI group remained approximately 100 times higher than in the Akk LO group throughout the intervention even if there was an intriguing reduction in the Akk HI group (figure 3). We suggest that there may be a range of A. muciniphila abundance associated with a healthier metabolic status and better outcomes after CR.
Adipocyte hypertrophy is associated with chronic proinflammatory cytokine secretion49 and greater risk for insulin resistance.36 Adipocyte diameter, glucose and surrogates of insulin sensitivity appear tightly linked with A. muciniphila in the Bayesian network (figure 1B). Primary defects in glucose homoeostasis were observed at fasting and during early OGTT time points, which reflect more hepatic insulin sensitivity, rather than peripheral glucose disposal.50 ,51 Therefore, our results suggest that the glucose homoeostatic defect in Akk LO individuals is primarily hepatic. In line with this, hepatic biology was solely impaired in Akk LO patients (table 1). Clamp studies are needed to validate this hypothesis more precisely.
A. muciniphila produces a variety of fermentation products, including SCFA, through mucin degradation. These substrates may serve as energy sources for other bacteria and the host.46 It is possible that through this cross-feeding18 A. muciniphila may contribute to the expansion of other beneficial species, while it may itself have a direct effect on host metabolism, consistent with rodent studies.12 Serum SCFA analysis showed an association between A. muciniphila abundance and acetate at baseline. Acetate plays a role in prevention of weight gain through an anorectic effect, inflammation, metabolic dysregulation, and it is the most predominant gut-produced SCFA in peripheral blood.52 ,53 However, it is unclear to what extent A. muciniphila contributes to circulating acetate. Indeed, while there is a strong correlation between A. muciniphila abundance and serum acetate concentration at baseline, this was not maintained throughout the dietary intervention.
Our results shed new light on the relationship between A. muciniphila, the gut ecosystem and host health. The healthiest metabolic status was seen in subjects with higher A. muciniphila abundance in the context of greater bacterial gene richness in this French population. A. muciniphila was also found more abundant in HGC individuals in a Danish population.22 Furthermore, we show that A. muciniphila was associated with 26 MGS, which represent up to 20% of the microbiome. One of these MGS is Methanobrevibacter smithii, believed to be a producer of mucin-like glycans, as proposed by Samuel et al.54 Interestingly, an association between A. muciniphila and mucin-degrader Ruminococcaceae was also observed. The latter was increased in abundance when nonobese diabetic (NOD) mice, a model for type-1 diabetes, were fed a diabetes-protective diet.55
In a study where germ-free mice with or without A. muciniphila gavage were infected with Salmonella typhimurium, the presence of A. muciniphila exacerbated the infection,56 which suggested that the effect of an unregulated growth of A. muciniphila without competition from other species led to a deleterious modification of the gut environment and thinning of the mucosal layer, enabling the infection. Conversely, a recent study shows in vitro that A. muciniphila may adhere to the intestinal epithelial cells, thereby strengthening the monolayer integrity.57
Dietary patterns influence gut microbiota diversity, yet little is known about the effect of diet on A. muciniphila.18 ,58 Consumption of various types of dietary fibre has yielded different results: an increase of A. muciniphila with a FODMAP (oligofructose12 ,59 and fermentable oligosaccharides, disaccharides, monosaccharides and polyols) diet,60 but a decrease with pectin or guar gum when compared with mice fed a fibre-free diet.61 We did not observe significant differences in baseline nutrient intake between Akk groups. Even though subjects increased consumption of fibre (particularly inulin-type fructans) during CR, this study design prevents us from reaching conclusions regarding A. muciniphila and diet. We can conclude, however, that the Akk HI group experienced greater metabolic improvement than the Akk LO group, while there was no difference between the groups in weight loss, or MAR scores. However, since MAR does not include saturated fats, sodium, or simple sugars intake it is not a complete diet quality indicator. Studies specifically designed to assess the effect of diet, particularly fibre intake, on A. muciniphila abundance in a population homogenous in age and health status are warranted.
Given the mostly glucose tolerant phenotype in this population constitutes a limitation of this study. Further investigation should focus on more diverse populations ranging from lean healthy to glucose intolerance or insulin resistance to overt T2D. Even though we have shown that higher baseline A. muciniphila abundance is associated with better clinical outcomes after CR, and literature suggests an increased abundance of A. muciniphila after gastric bypass,23–26 a direct comparison between the effect of energy restriction versus bariatric surgery should also be implemented to establish a link between energy restriction, nutrient malabsorption, A. muciniphila modifications and improved glucose metabolism.
From the present study we cannot conclude whether faecal bacterial abundance is directly proportional to abundance in the gut. Microbiota in the mucus layer differs from that of the intestinal lumen,62 and A. muciniphila is closely associated to the gut mucosal layer. The observed differences in abundance of A. muciniphila into faeces may be due to actual changes in bacterial numbers, or alterations of the mucosal layer and gut architecture. Host genetics may also play a role in how dietary interventions influence gut microbiota and metabolic health, as previously shown in mice, where different strains had notably different gut microbial composition and intestinal environment that correlated with a variety of cardiometabolic profiles.63 The host's innate and adaptive immune system may also influence the composition of gut microbiota.64 A recent study showed greater prevalence of A. muciniphila in the absence of pressure from the adaptive immune system in Rag1(−/−) immunodeficient mice.65 Furthermore, while dietary interventions have been proven to greatly impact gut microbiota characteristics,19 ,20 the stability of gut microbiota modifications after a dietary intervention needs to be assessed to verify whether gut microbiota changes are related to the maintenance of metabolic benefits over time. In conclusion, we demonstrated a significant association between A. muciniphila abundance and metabolic health and we provide a first view of A. muciniphila association with the gut ecosystem. Collectively, these observations demonstrate the importance of studying A. muciniphila in the context of the gut environment, as it may drive a favourable or deleterious contribution of A. muciniphila to health. The underlying mechanisms explaining these associations should be investigated in future studies.
Acknowledgments
The authors thank Sophie Gougis who contributed to the dietary counselling, Soraya Fellahi (Department of Biochemistry and Hormonology, Tenon hospital) for analyses of inflammatory markers, Dominique Bonnefont-Rousselot and Randa Bittar (Department of Metabolic Biochemistry, Pitié-Salpêtrière hospital) for help with the analysis of plasma lipid profile.
References
Supplementary materials
Supplementary Data
This web only file has been produced by the BMJ Publishing Group from an electronic file supplied by the author(s) and has not been edited for content.
- Data supplement 1 - Online figures
- Data supplement 2 - Online table 1
- Data supplement 3 - Online table 2
Press Release
Files in this Data Supplement:
Footnotes
Twitter Follow ICAN at @ICAN_Institute, Edi Prifti at @ediprisci and Lesley Hoyles at @BugsInYourGuts
Collaborators MICRO-Obes Consortium list of contributors: Sylvie Le Mouhaër; Aurélie Cotillard; Sean P Kennedy; Nicolas Pons; Emmanuelle Le Chatelier; Mathieu Almeida; Benoit Quinquis; Nathalie Galleron; Jean-Michel Batto; Pierre Renault; Jean-Daniel Zucker; Stanislav Dusko Ehrlich; Hervé Blottière; Marion Leclerc; Catherine Juste; Tomas de Wouters; Patricia Lepage.
Contributors KC and SWR designed the overall clinical research study and managed it; PDC and AE generated the A. muciniphila qPCR results; JD and FL generated the quantitative metagenomics results and EP analysed association between A. muciniphila and MGS; EOV was involved in analysis and interpretation of dietary data; BDK and JA-W were involved in analysis and interpretation of clinical results; MCD managed this project and implemented data integration and statistical analysis; NS created the Bayesian Network and contributed to statistical analysis; M-ED, JC and LH generated NMR acetate results; MCD, JA-W, EP, EOV, BDK and KC wrote the manuscript. All authors provided input on the analysis and interpretation of the results, and preparation of the manuscript.
Funding This work was supported by Agence Nationale de la Recherche (ANR MICRO-Obes), KOT-Ceprodi and the association Fondation Coeur et Arteres (clinical investigation) as well as European Union's Seventh Framework Program under grant agreement MetaHIT HEALTH-F4-2012-305312, and grant agreement HEALTH-F4-2012-305312 (METACARDIS). PDC is a research associate at FRS-FNRS (Fonds de la Recherche Scientifique), Belgium. AE is a postdoctoral researcher at FRS-FNRS, Belgium. PDC is the recipient of grants from FRS-FNRS (convention J.0084.15, convention 3.4579.11) and PDR (Projet de Recherche, convention: T.0138.14) and ERC Starting Grant 2013 (European Research Council, Starting grant 336452-ENIGMO). This work was supported by the Fonds de la Recherche Scientifique—FNRS for the FRFS-WELBIO under Grant n° WELBIO-CR-2012S-02R.
Competing interests None declared.
Patient Consent Obtained.
Ethics approval Ethical Committee (CPP N°1 Hôtel Dieu Hospital).
Provenance and peer review Not commissioned; externally peer reviewed.