Operative mortality in colorectal cancer: prospective national study
BMJ 2003; 327 doi: https://doi.org/10.1136/bmj.327.7425.1196 (Published 20 November 2003) Cite this as: BMJ 2003;327:1196
- Paris P Tekkis, resident surgical officer1,
- Jan D Poloniecki, senior lecturer in biostatistics2,
- Michael R Thompson, consultant surgeon3,
- Jeffrey D Stamatakis, consultant surgeon (jeff.stamatakis{at}bromor-tr.wales.nhs.uk)4 on behalf of the Association of Coloproctology of Great Britain and Ireland
- 1Department of Surgery, St Mark's Hospital, Harrow HA1 3UJ,
- 2Department of Public Health Sciences, St George's Hospital, London SW17 0WT,
- 3Department of Surgery, Queen Alexandra Hospital, Portsmouth PO6 3LY,
- 4Department of Surgery, Princess of Wales Hospital, Bridgend CF31 1RQ
- Correspondence to: J D Stamatakis
Abstract
Objective To develop a mathematical model that will predict the probability of death after surgery for colorectal cancer.
Design Descriptive study using routinely collected clinical data.
Data source The database of the Association of Coloproctology of Great Britain and Ireland (ACPGBI), encompassing 8077 patients with a new diagnosis of colorectal cancer in 73 hospitals during a 12 month period.
Statistical analysis A three level hierarchical logistic regression model was used to identify independent predictors of operative mortality. The model was developed on 60% of the patient population and its validity tested on the remaining 40%.
Results Overall postoperative mortality was 7.5% (95% confidence interval 6.9% to 8.1%). Independent predictors of death were age, American Society of Anesthesiology (ASA) grade, Dukes's stage, urgency of the operation, and cancer excision. When tested the predictive model showed good discrimination (area under the receiver operating characteristic curve = (0.775) and calibration (comparison of observed with expected mortality across different procedures; Hosmer-Lemeshow statistic = 6.34, 8 df, P = 0.610).
Conclusions Clinicians can predict postoperative death by using a simple numerical table derived from the statistical model of the ACPGBI. The model can be used in everyday practice for preoperative counselling of patients and their carers as a part of multidisciplinary care. It may also be used to compare the outcomes between multidisciplinary teams for colorectal cancer.
Introduction
Surgeons and the units in which they work are now clearly accountable for clinical outcomes.1 Consent to surgery cannot be truly informed unless operative risk is estimated by considering the patient's comorbid condition, extent of disease, and complexity of the proposed treatment. Patients and carers may then make decisions with greater awareness of the risks involved.
Currently no dedicated system exists in the United Kingdom that predicts operative mortality, adjusted for risk, in surgery for colorectal cancer. We describe the development of a dedicated model for colorectal cancer that estimates the operative risk for individual patients while providing an example of the general problem of quantifying surgical risk.
Data and methods
Data sources
The colorectal cancer study of the Association of Coloproctology of Great Britain and Ireland (ACPGBI) was conducted prospectively in 73 hospitals; participating surgeons joined the study on a voluntary basis. Data were collected locally, either by data managers dedicated to colorectal cancer or by participating surgeons, using the standardised ACPGBI dataset2 or equivalent on all patients presenting to the local hospitals with a new diagnosis of colorectal cancer. Data were submitted centrally by using electronic media and recorded on a Microsoft Access 2000 database (Microsoft Corporation, Seattle, USA). The data in the patients' records were edited extensively to check for missing values or values that were out of range and inconsistencies between data fields. The contributing hospitals reported a total of 8077 new cases of colorectal cancer over a 12 month period between 1 April 1999 and 31 March 2001.
Inclusion and exclusion criteria
We included data on patients undergoing emergency or elective surgery for colorectal cancer. We excluded patients with a diagnosis of colorectal cancer who did not undergo surgery and patients of whom only the name and demographic details were recorded on the database, without information on outcomes or risk factors.
Study end point and risk factors
The primary outcome was operative mortality, defined as death occurring within 30 days of an operative procedure, from whatever cause, occurring either in hospital or after discharge from hospital. The risk factors related to patients and procedures in the ACPGBI database included age; sex; American Society of Anesthesiology (ASA) grade3; cancer site in accordance with the World Health Organization's international classification of diseases and related health problems; surgical procedure categorised according to the UK classification of operative procedures (OPCS-4)4; operative urgency classified as emergency, urgent, scheduled, or elective according to the classification of the National Confidential Enquiry into Perioperative Deaths (NCEPOD)5; cancer staging according to the clinical findings and histological Dukes's classification as modified by Turnbull et al6; timing of surgery during a 24 hour period; cancer excision; and annual case volume.
Statistical analysis
We used unifactorial logistic regression to identify risk factors related to the operative mortality within 30 days. We grouped continuous variables into subcategories of increasing operative risk and used unifactorial logistic regression to compare these with a reference category (table 1). To maximise the information extracted from the predictor variables we used a median imputation technique to substitute for incomplete data.7 This method allows each case to be used by the multifactorial model, thereby reducing the 95% confidence intervals around the model estimates and odds ratios.
Patients' demographic characteristics, univariate and multivariate analysis for postoperative mortality for patients undergoing surgery for colorectal cancer
ACPGBI colorectal cancer model —We used multifactorial logistic regression analysis to adjust for multiple risk factors, their interactions, and the clustering of adverse outcomes in hospitals (see appendix 1 on bmj.com). We subsequently used the coefficients derived from the multivariate analysis as weights in the derivation of the ACPGBI colorectal cancer score (table 2).
The colorectal cancer model of the Association of Coloproctology of Great Britain and Ireland (ACPGBI) and conversion chart of ACPGBI score to predicted 30 day operative mortality for patients undergoing surgery for colorectal cancer
Model validation— We validated the model internally by dividing the data into two distinct sets. We developed the model on 60% of the study population, selected randomly, and the remaining 40% of patients used for testing the model. We used the Hosmer-Lemeshow statistic8 to evaluate the performance of the ACPGBI colorectal cancer model to assess calibration or goodness of fit (the ability of the model to assign the correct probabilities of outcome to individual patients). To obtain this statistic we computed the estimated probability of death for each patient on the basis of the model, ranked them into 10 equal groups of ascending operative mortality, and then statistically evaluated the expected and observed number of outcomes in each tenth. Smaller values represent better calibration of the model. Model discrimination refers to the ability of the model to assign higher probabilities of death to patients who actually die than to patients who live: we measured this by the area under the receiver operator characteristic curve or c-index. Values ranging from 0.7 to 0.8 represent reasonable discrimination, and values exceeding 0.8 represent good discrimination.9 We analysed subgroups by comparing the observed and expected 30 day operative mortality for individual procedures on the validation set of 3000 patients.
Statistical software— We used the following software packages for our analyses: Intercooled STATA 6.0 for Windows (STATA Corporation, College Station, Texas, USA), Statistical Package for the Social Sciences, version 11 for Windows (SPSS, Chicago, Illinois, USA), and MLwiN Version 1.2 (University of London, United Kingdom).
Results
Altogether, 7374 (91.3%) of 8077 patients presenting with colorectal cancer satisfied the inclusion criteria. We excluded from the analysis 499 (6.2%) patients who did not have surgical treatment and 204 (2.5%) patients whose records were incomplete. Operated cases were submitted by 73 hospitals scattered across all 11 geographical regions in the United Kingdom. A total of 4491 patients (60.9%) had complete data for the risk factors included in the final ACPGBI model. We found no evidence of systematic under-reporting of risk factors, and missing data were distributed evenly among hospitals, with no significant differences in outcomes between missing and non-missing data. Unadjusted postoperative mortality was 7.5% (range 2-14.5%). Table 1 shows the patients' demographic characteristics, 30 day postoperative mortality, unifactorial and multifactorial analysis.
Figure 1 shows the relation between age, ASA grade, and 30 day operative mortality R (plotted on the log [R /1- R] scale). Hospitals are depicted by individual prediction lines, parallel to each other but with different intercepts on the vertical axis. Increasing age was found to be associated with a higher operative mortality among the four ASA grades; adjusted odds ratio of 1.53 per 10 years' increase in age (95% confidence interval 1.36 to 1.73). Operations performed on patients with ASA grade II, III, and IV were associated with a 2.0-fold (1.2 to 3.2), 5.3-fold (3.2 to 8.5), and 15.8-fold (9.2 to 27.0) increase in operative mortality compared with patients with ASA grade I, after adjusting for age and hospital effect.
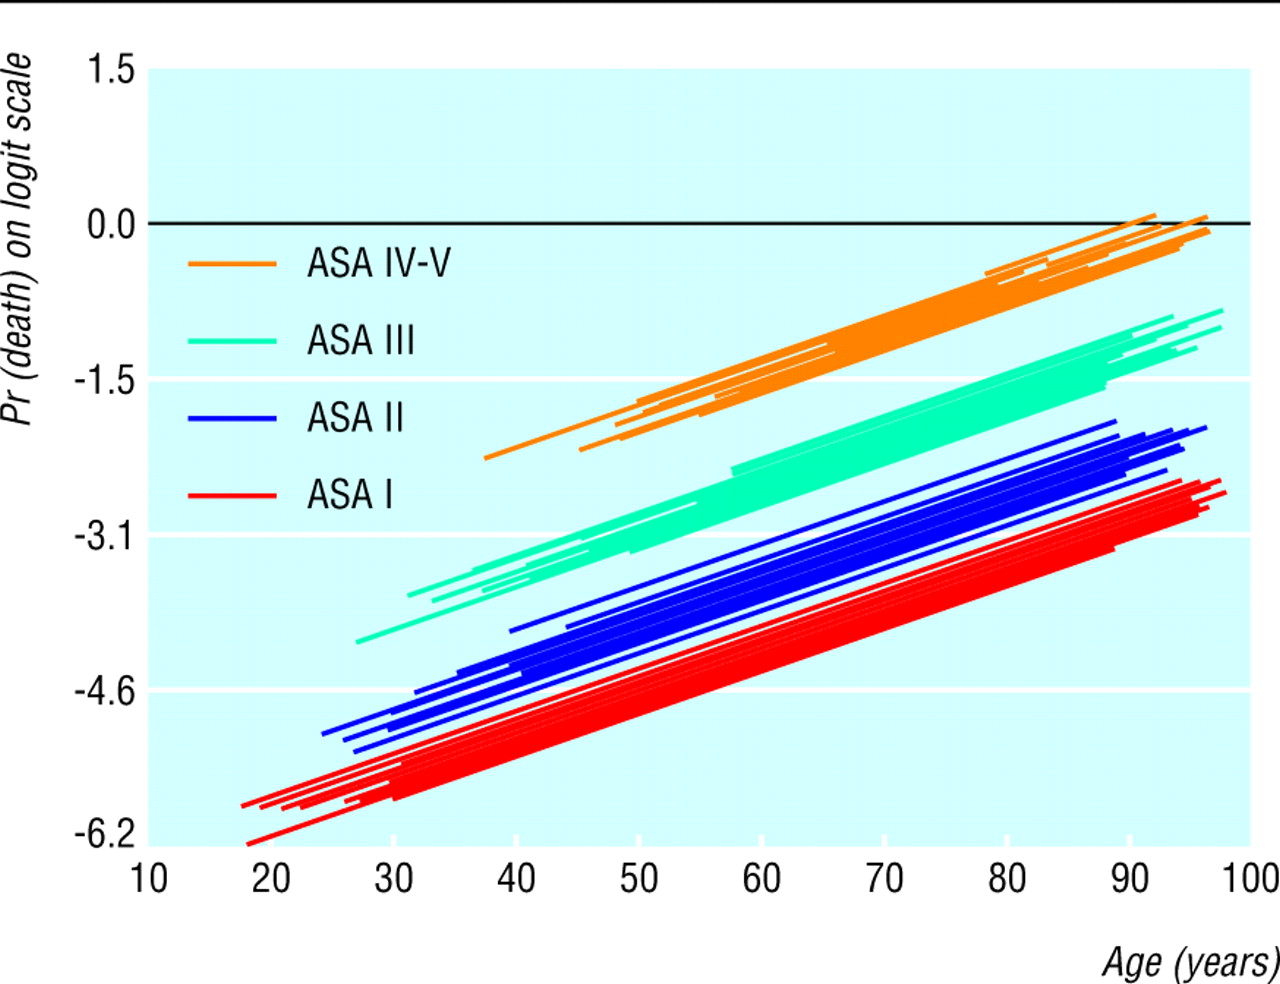
Variation of 30 day operative mortality with age across the strata of ASA grade. Individual prediction lines are provided for individual hospitals parallel to each other but with different intercepts on the vertical axis. The variability in the intercept represents the “hospital effect,” which is an indirect proxy of the structure and process of care in each hospital
Figure 2 shows the variation of postoperative mortality by age, ASA grade, and cancer excision. Increasing ASA grade was associated with a higher operative mortality, but this effect differed according to whether or not patients had their cancer resected (first order interaction). Cancer excision seemed to confer an advantage in terms of predicted outcome in three of the four ASA categories. This effect diminished with increasing ASA grade, and for patients with ASA grade IV-V the two lines overlapped, indicating a similar outcome between patients who underwent cancer resection and those who did not. On further testing we observed no other significant interactions between any other risk factors in the dataset.

Variation of operative mortality by age, ASA grade, and cancer resection. The regression lines have been adjusted for age, ASA, and the interaction term ASA xcancer resection by using a three level logistic regression model
Development of the ACPGBI colorectal cancer model— Table 1 shows the risk factors of the ACPGBI model for colorectal cancer, their adjusted odds ratios, and 95% confidence intervals. On multivariate analysis, the patient's age, ASA grade, urgency of procedure, Dukes's stage, cancer excision, and the product of ASA grade and cancer excision (interaction term) were found to be independent predictors of outcome. Table 2 shows the ACPGBI colorectal cancer model, which is a simple additive score. We categorised each risk factor into relevant subgroups with weights derived directly from the βcoefficients (log odds ratios) of the multifactorial analysis shown in table 1. The probability of 30 day operative mortality for each of the ACPGBI scores is also shown on a conversion chart in table 2.
Model performance— The model fitted the data well, as evidence from by the calibration Hosmer-Lemeshow statistic shows: development set = 5.98, 8 df, P = 0.649; validation set = 6.069, 8 df, P = 0.640. Figure 3 shows the calibration chart for the validation set. The area under the receiver operating characteristic curve was 0.775 (95% confidence interval 0.744 to 0.806). On subgroup analysis, the predicted mortality for various types of operations for the validation set (n = 3000), as calculated by the ACPGBI colorectal cancer model, was well within the confidence limits of the observed outcome as shown in figure 4 (Hosmer-Lemeshow statistic: 6.34, 8 df, p = 0.610). Observed and expected mortality did not show any significant differences among the strata of age, ASA grade, Dukes's stage, and urgency of the procedure.

Calibration chart of the observed and model predicted operative mortality for the ACPGBI colorectal cancer model based on the validation set (n=3000)

Comparison of observed and predicted 30 day operative mortality by type of procedure on the validation set of 3000 cases (Hosmer-Lemeshow statistic 6.34, 8 df, P=0.610). For each procedure the number of cases, the observed 30 day operative mortality (%), and its 95% confidence intervals are displayed
Discussion
Clinicians can predict postoperative death in patients with colorectal cancer by using a simple numerical table derived from the statistical model of the ACPGBI, which may provide patients and carers with an estimated numerical probability of survival from surgery as part of the decision making process in the perioperative setting. Our study represents a nationwide attempt to provide accurate risk adjusted outcomes in colorectal cancer care. Review of the observed performance statistics (validity and accuracy) of the model indicates that this was adequate for the prediction of risk to individual patients. A further use for the ACPGBI model might be to compare the results of treatment between units. However, before such comparative studies can be undertaken it will be essential to ensure inclusion of all patients and to have robust methods of data validation.
We used mortality in hospital as an indirect measure of the quality of care. In comparison with 30 day operative mortality, in-hospital mortality can be quantified more reliably. With the current tendency to discharge patients early, in the future the need might arise to include a combination of in-hospital and 30 day operative mortality. It is important to note that if surgeons are simply governed by achieving the lowest death rates they may fail to understand that well informed patients may trade off a short term risk in exchange for “cancer cure.”10 Patients with advanced cancers may not be suitable for cancer resection as the risks of resectional surgery outweigh the benefits of a simpler and possibly safer palliative operation. This is particularly true for obstructed, metastatic cancers of the large bowel, where palliation with colonic stenting offers an alternative definitive treatment to potentially high risk surgery.
Validity of the data
An essential prerequisite for the evaluation of healthcare outcomes is the provision of comprehensive, accurate, clinically valid, and reliable information. Although currently the quality of the data may be limited by the observational nature of this study, implementation of such a system should increase awareness of the minimum required data, with subsequent improvement in quality. The study was based on data that we had carefully and voluntarily collected from hospitals throughout the United Kingdom. Since these hospitals were self selected, inferences cannot be made about how representative the outcomes are for the overall population. Although the model was internally validated for the study population, it would require external validation by testing the model on further prospective series in different hospitals. As data on an increasing number of cases are collated centrally the colorectal cancer model is expected to evolve from year to year, with individual “hospital effects” becoming more important in modelling the variability of outcome between hospitals or regions. At present the sample size of the cases submitted by individual hospitals is not sufficient to draw any meaningful inferences about the quality of care between providers. In the future, model reliability (the ability to obtain similar values for the same variable in specific patients at different times or in different locations) can be formally assessed, both centrally and at the local level.
Quality of statistical analysis
The ACPGBI colorectal cancer model used a relatively new technique called hierarchical regression analysis. This is particularly useful in modelling observations that have a hierarchical or clustered structure, as they allow for the possibility that patients from the same hospital have more similar outcomes than patients chosen at random from different hospitals. This is often found in studies of patients within hospitals or pupils within schools.11 Multilevel models have been shown to provide more accurate predictions of outcome, and similar techniques have been adopted to display the comparative performance of organizations in cardiac surgery,12 and clinics for in vitro fertilisation.13
What is already known on this topic
Risk factors associated with postoperative mortality in colorectal cancer surgery are well established
Predictive models are available for surgical patients in general but are not applicable for predicting individual risk and analysis of subgroups in patients with colorectal cancer
What this study adds
A dedicated model has been developed to predict operative mortality for patients undergoing surgery for colorectal cancer
This modified model is presented in a format that is suitable for frontline clinicians
Usefulness of the ACPGBI colorectal cancer model and future developments
In the model adjustment was made for age, ASA grade, Dukes's stage, urgency of the procedure, and cancer excision, which are well established, independent, prognostic factors in colorectal cancer.14 In addition, we introduced an interaction term, which was clinically relevant and clearly improved performance of the model. Although ASA grade is simple to use and has been incorporated by other predictive indices,15 it is open to subjectivity and manipulation. In future years the ACPGBI dataset can be augmented with other measures of patients' comorbidity, such as the risk factors from the POSSUM physiological score16 or from the Veterans Affairs surgical risk model.17 The drawback of using specialised investigations such as albumin, prealbumin, or liver function tests is that, although they may be readily, prospectively, collected in elective situations, in the emergency setting data collection and score generation may be incomplete and lead to incorrect assessment of operative risk.18 Further work is therefore required to evaluate the accuracy, reliability and cost involved in collecting such data in addition to the ASA grade. Although POSSUM and p-POSSUM systems have been widely applied in general and colorectal surgery,19 20 disease specific models have been shown to outperform models designed to predict over a range of different conditions. The weights assigned to clinical variables depend on the specific disease context, such as colorectal cancer.21
We describe an accurate and validated model for providing risk adjusted outcomes in patients undergoing surgery for colorectal cancer. The study represents a valuable tool in the multidisciplinary management of cancer patients. The method used in the development of the ACPGBI colorectal cancer model can be applied to other surgical specialties for the objective quantification of operative risk in patients with and without cancer.
 The statistical model used by the Association of Coloproctology of Great Britain and Ireland and a list of hospitals participating in data collection appear on bmj.com
Acknowledgments
The research on which this article is based was funded by the Hue Falwasser fellowship of the Royal College of Surgeons of England. The authors thank all the consultants who contributed patients to the study and the data collection officers, managers, and audit facilitators for their invaluable assistance. For a list of hospitals that took part in data collection for the ACPGBI study see bmj.com
Footnotes
-
Contributors JDS and MRT initiated the study; data harvesting and data aggregation were undertaken by PPT and JDS; data analysis and risk modelling were performed by PPT and JDP; drafting of this report was undertaken by PPT and edited by JDP, MRT, and JDS. All investigators contributed comments and corrections on the final draft. JDS and PPT are guarantors of the study.
-
Funding PPT is funded by the Hue Falwasser research fellowship of the Royal College of Surgeons of England.
-
Competing interests None declared.
-
Ethical approval The study was approved by the multicentre ethics research committee for Wales, 10 January 2001.