Article Text

Abstract
Background: Few studies have correlated computed tomography (CT) enterography findings with endoscopic severity and C reactive protein (CRP) concentrations.
Aim: To examine whether small bowel inflammation at CT enterography correlates with endoscopic severity and CRP in patients with Crohn’s disease (CD).
Methods: CT enterography datasets from 143 CD patients undergoing ileoscopy were examined for three different CT parameters: CT bowel enhancement, as defined by the ratio of terminal ileal versus control ileal loop attenuation; vascular enlargement of the vasa recta (“the comb sign”); and mesenteric fat density. Correlations between CT scan parameters, endoscopy, and histology severity scores, and CRP were assessed using Spearman’s rank correlation and logistic regression.
Results: Endoscopic score was significantly correlated with CT bowel enhancement, comb sign, and fat density (Spearman correlation coefficients 0.33–0.39; p<0.001). Correlations with histological inflammation were strongest for bowel enhancement (r = 0.34–0.38; p<0.001). CRP was elevated in patients with increased fat density versus those with increased bowel enhancement only (median 0.96 v 0.23, p = 0.002). CRP did not differ significantly between patients without evidence of active Crohn’s and those with bowel enhancement and endoscopic inflammation not involving the perienteric tissues by CT (median 0.24 v 0.36; p = 0.38).
Conclusion: Quantitative measures of bowel enhancement at CT enterography correlate with endoscopic and histological severity. CRP correlates with radiological findings of perienteric inflammation (increased fat density), but not of inflammation limited to the small bowel wall, underscoring the potential role of perienteric inflammation in CRP response in CD.
- CT, computed tomography
- CTE, CT enterography
- CRP, C reactive protein
- CD, Crohn’s disease
- CDAI, CD activity index
- HU, Hounsfeld units
- OR, odds ratio
- IL-6, interleukin 6
- computed tomography enterography
- computed tomography
- ileoscopy
- C reactive protein
- Crohn’s disease
Statistics from Altmetric.com
- CT, computed tomography
- CTE, CT enterography
- CRP, C reactive protein
- CD, Crohn’s disease
- CDAI, CD activity index
- HU, Hounsfeld units
- OR, odds ratio
- IL-6, interleukin 6
Assessment of inflammatory activity in Crohn’s disease (CD) is vital in the management of patients and in monitoring the effects of therapy. Activity of CD is usually evaluated using clinical parameters, endoscopy, or biochemical markers such as C reactive protein (CRP) concentrations. However, because CD is a transmural inflammatory process which also involves the mesentery, assessment of solely mucosal inflammation by endoscopy may be incomplete. Although computed tomography (CT) has traditionally been used to guide patient care for extraenteric complications such as abscesses, fistula, or obstruction, CT also holds promise in the assessment of small bowel activity.1,2 CT enterography (CTE) varies from routine abdominal CT scanning techniques by using high resolution multidetector CT, intravenous contrast, and large volumes of neutral oral contrast, thereby improving visualisation of the small bowel wall and lumen. CTE findings of mural stratification, segmental mural hyperenhancement, increased density of mesenteric fat, and engorged vasa recta (the “comb sign”) have been shown to correlate with active inflammation.3–,8 Additionally, Doppler ultrasound measurements of increased small bowel blood flow have correlated with inflammatory activity.9
The relationships between endoscopic severity, serum biochemical markers of inflammation, and CT findings of small bowel inflammatory activity have not yet been thoroughly investigated, and a link was therefore sought between these three elements in patients with ileal CD.
PATIENTS AND METHODS
Patients
The Institutional Review Board of Mayo Foundation approved this retrospective study, conducted from data in institutional patient databases and archives. Patient inclusion criteria for this study were: (1) signed consent from the patient to use past medical data for research purposes; (2) contrast enhanced CTE examination conducted for clinical purposes on an outpatient CT scanner between March 2001 and July 2004; (3) ileocolonoscopy within 30 days of the date of CTE; and (4) clinical diagnosis of CD. Patients were not required to have a terminal ileal biopsy accompanying this ileoscopy.
Parameters
Endoscopy and C reactive protein
All 143 patients underwent ileoscopy and CTE. A total of 123 patients had the distance of ileum scoped specified in their ileoscopy report (median distance of ileum scoped 10 cm). For 20 patients without the distance of ileal intubation reported, 10 cm was assumed for the purposes of this investigation. Endoscopic severity of CD was retrospectively graded from ileoscopy reports, according to Rutgeerts’ score.10 Only the terminal ileum was graded. In order to account for the presence of non-ulcerated and ulcerated stenosis, two supplementary grades (that is, grades 0b and 5) were created (table 1⇓).
Endoscopic score of activity modified from Rutgeerts and colleagues.10
Serum C reactive protein levels obtained during the same clinical visit as ileoscopy and CTE were recorded
Histology
Ileal biopsies were available in 121 patients. The severity of acute and chronic ileitis by histology were graded based on the greatest severity of inflammation found, as reported in the written histopathology reports and labelled as follows: 0, no inflammation; 1, mild ileitis; 2, moderate ileitis; and 3, severe ileitis.
CT enterography technique
CTE examination was conducted on each patient. Each patient was given 10 mg of oral metoclopramide (Reglan; Pharmaceutical Associates, Greenville, South Carolina, USA) 75 minutes prior to CT examination in order to increase gastric and small bowel peristalsis. Patients then drank four 375 ml aliquots of diluted methylcellulose solution composed of 1000 ml water and 500 ml enterocele methylcellulose solution (Mallinckrodt Pharmaceuticals, St Louis, Missouri, USA). The first aliquot was given immediately after metoclopramide, with subsequent aliquots given at 25, 50, and 65 minutes after ingestion of the peristaltic agent. CT examination was performed 75 minutes after metoclopramide ingestion. Patients were given 1 mg of glucagon intravenously immediately prior to scanning. Contrast enhanced CT imaging was performed using 270 mA, 120 kVp, tube rotation time of 0.5 s, and 2.5 mm slice thickness, and 1.5 mm reconstruction interval. Intravenous contrast material (150 ml) (Omnipaque 300 mg I/ml; Amersham Health Inc., Princeton, New Jersey, USA) was administered at a rate of 4 ml/s, with scanning initiated after a 45–70 s delay. Median interval between endoscopy and CTE was one day (range 0–12 days).
Visual image evaluation
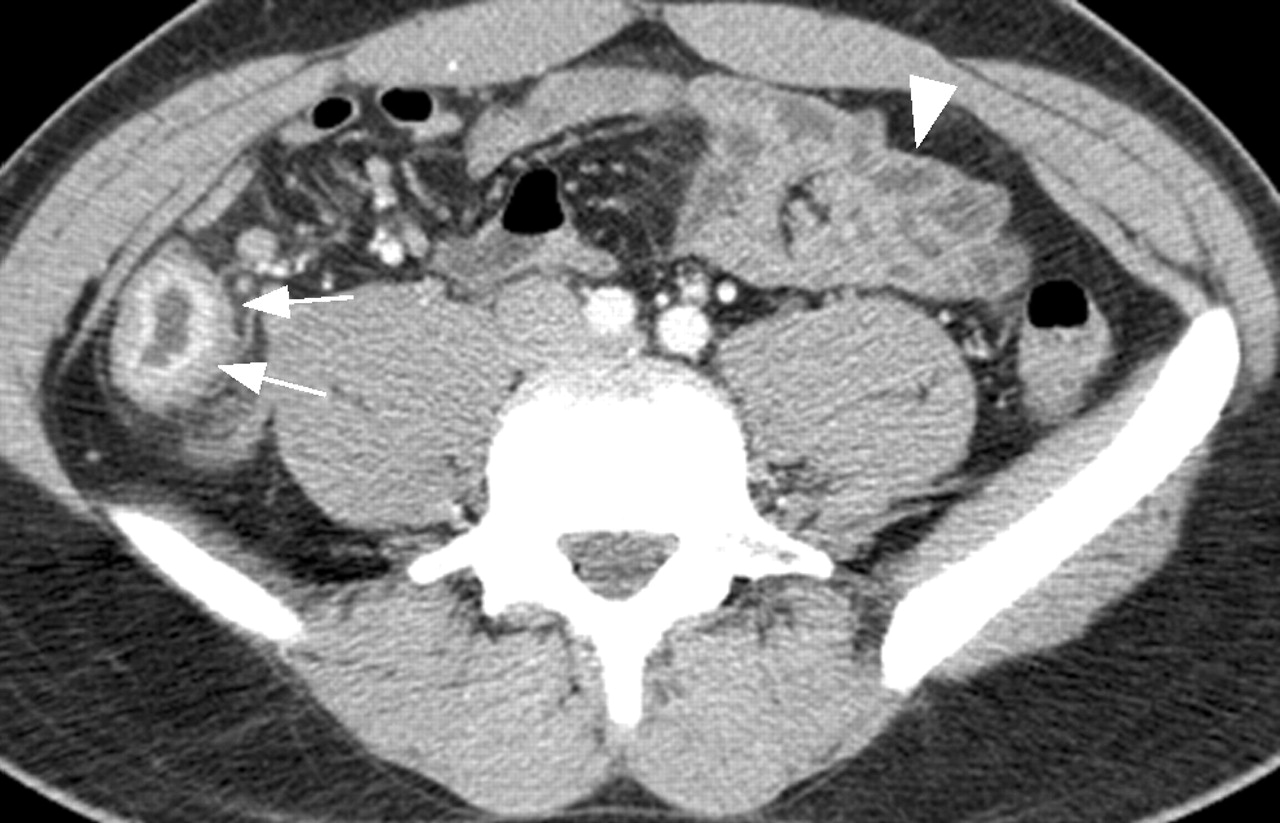
One gastrointestinal radiologist (JGF) reviewed all images and was blind to all endoscopic, radiological, and pathological information, except for the extent (in cm) of terminal ileal intubation at ileoscopy. He was asked to evaluate the corresponding segment of terminal ileum in each CTE dataset for several CT signs of active CD: mural enhancement, increased density in perienteric fat, and comb sign. Mural enhancement was defined as segmental enhancement of all or part (in the case of mural stratification) of the small bowel wall, greater than enhancement of the adjacent small bowel loops (fig 1⇓). Increased density in perienteric fat was defined as focally and increased inhomogeneous attenuation in the perienteric fat, compared with the appearance of subcutaneous fat, or perienteric fat adjacent to non-inflamed bowel loops. The comb sign is defined by spiral CT features of segmental dilatation of the vasa recta involving a bowel loop (figs 2⇓–4⇓). Each of these CT signs was graded along a four point scale as not present, definitely present to a mild degree, present to a moderate degree, or present to a severe degree. Measurement of bowel enhancement has been previously reported in 80 patients in this series3,4 while grading of perienteric findings and correlation of radiological findings with Rutgeerts’ score and CRP are completely unique for all patients.

Transverse enteric phase computed tomography enterography image in a 25 year old male with active Crohn’s disease, demonstrating typical increased terminal ileal mural attenuation. Mural attenuation of the terminal ileum (arrows) was higher than that of the distended ileal loops (arrowhead) (128 Hounsfeld units (HU) v 78 HU, respectively). TI ratio = 1.6 (TI ratio above 1.3 is considered abnormal).

Mild degree of comb sign (arrowheads) in a 28 year old female with Crohn’s disease.

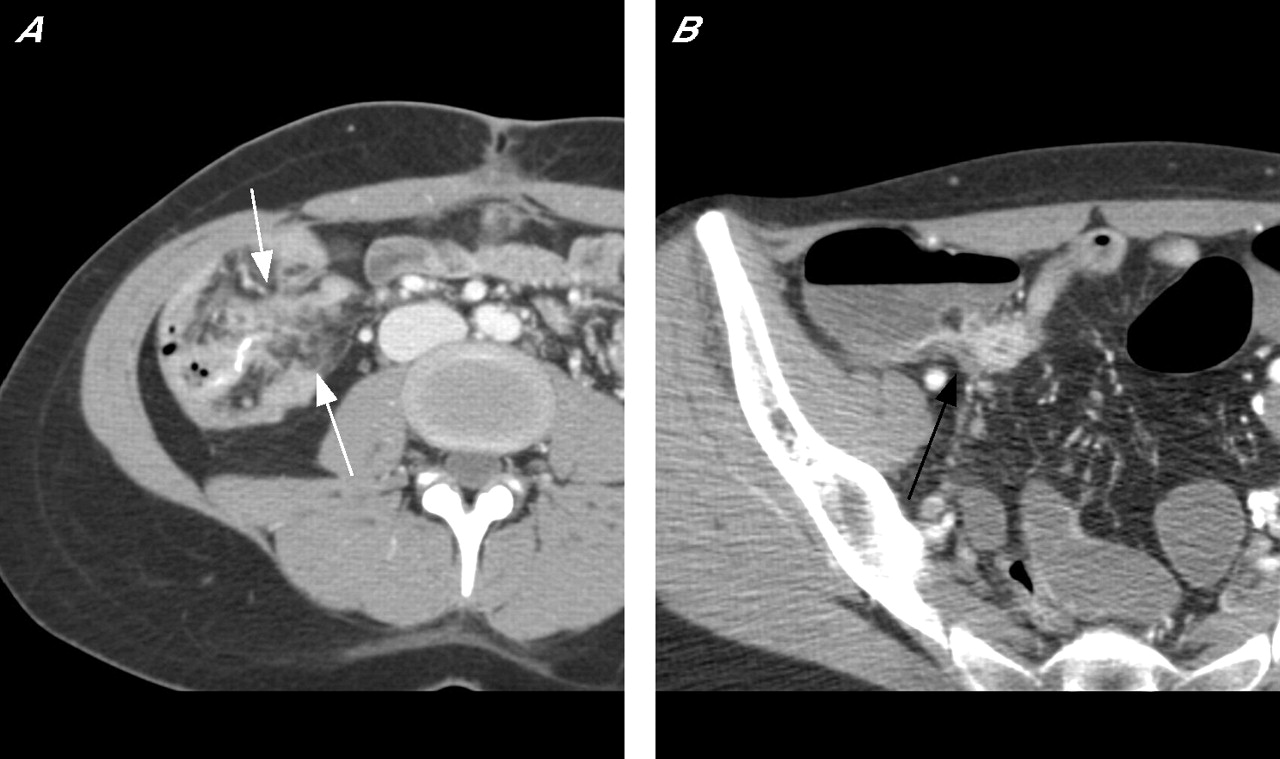
Crohn’s ileitis in an 18 year old female (A, arrowheads) and moderate comb sign (B, arrows). (B) Transverse computed tomography section slightly cephalad to (A).

(A) A 29 year old female with Crohn’s disease (CD) and severe degree of increased fat density at ileocolic anastomosis (arrows). (B) A 27 year old female with CD and mild degree of increased fat density (arrow).
To insure that comparisons between radiological findings of enteric and extraenteric inflammation were not confounded due to mesenteric or perianal abscess or colonic inflammation, the radiological and endoscopic reports were reviewed. Based on endoscopic reports, colonic inflammation in these Crohn’s patients were rated as: (i) inflammation inactive, (ii) mildly active chronic colitis, or (iii) moderately to severely active chronic colitis. Similarly, based on the clinical radiology report of CTE, patients were rated as having an abscess present or not present. The frequency of other extraenteric complications of CD were also abstracted from CTE reports with respect to the presence of fistula, cholelithiasis, renal stones, and sacroiliitis.
Semiautomated quantitative image evaluation
One blinded gastrointestinal radiologist (JGF), who was aware of the distance intubated at ileocolonoscopy, defined axial images displaying two bowel segments to be used in the quantitative analysis of small bowel enhancement for each patient: (1) normal appearing distended ileum; and (2) the most enhancing segment of the terminal ileum (either collapsed or distended, limited to the region visualised at ileoscopy). Images for all selected bowel segments were digitally analysed to quantify average maximal bowel wall attenuation using the Line Profile tool of the Analyze 5.0 software package (Analyze Direct, Lenexa, Kansas, USA). Measurements were taken of maximal bowel wall attenuation, at 1 mm increments when a 2 cm bowel segment was displayed in the axial plane, or at 10 degree increments using a radial tool when the selected bowel segment was transected by the axial cut plane. The Line Profile tool was configured in both instances so that measurements were sampled across the entire bowel wall (from the mesenteric fat to the water filled lumen). For each image, the first 20 data points for maximal mural attenuation were saved and additional data points, if any, were discarded. In all cases, analysis of 20 segments spaced at 1 mm intervals or 36 segments spaced at 10 degrees intervals was sufficient to collect 20 data points. Mean maximal mural attenuation was calculated for the normal appearing ileal loop and the terminal ileal loop in each patient from the 20 data points and was used in subsequent analysis. Both terminal ileal attenuation (TI) and the ratio of terminal ileal attenuation to normal distended ileum (TI ratio) were used in the analysis. The rationale for using the ratio is that attenuation of normal appearing bowel loop is an internal reference, taking into account idiosyncratic patient factors such as stroke volume, weight, and mesenteric vasculature and perfusion.
Statistics
Correlations between CT scan parameters and endoscopy score, histology score, and CRP concentrations were estimated using Spearman’s rank correlation. Polychotomous logistic regression analysis was performed to examine the correlation between log CRP, absence of small bowel inflammation, small bowel inflammation limited to the gut wall only (that is, not involving the perienteric tissues at CTE), and small bowel inflammation involving perienteric fat (as evidenced by CT comb sign or increased perienteric fat density on CTE). Polychotomous logistic regression analysis is a logistic regression model with the dependent variable having more than two categories. Log CRP was used in these comparisons as CRP values were heavily skewed to lie between 0 and 1. Specific a priori classifications of patients into three groups was done based on the presence of radiological evidence of Crohn’s disease: (i) absent (that is, absence of mural hyperenhancement at CT with/without negative endoscopy); (ii) involving only the bowel wall and not the perienteric tissues (that is, presence of mural hyperenhancement but without comb sign or without increased density in the perienteric fat); and (iii) involving the perienteric tissues (that is, comb sign present or increased density in perienteric fat). For each classification scheme, a multiple logistic regression model was used to estimate the odds for being in two of the groups versus a reference group using a generalised logit link function. The odds ratios (95% confidence interval (CI)) were estimated from the model parameter estimates (and standard errors). The result of the 2 degree of freedom test is reported for the association of CRP, with the specific classification being considered, and the OR (95% CI) for the selected comparison of interest. We performed a separate analysis including abscess, and moderate and severe colitis, as covariates in the polychomotous logistic regression analysis, in order to determine if any associations between CT findings and CRP would be altered.
RESULTS
A total of 143 patients with CD were studied by CTE and ileoscopy. There were 89 females and 54 males. Median age was 42 years (range 15–75). Median duration of CD was eight years (range 0.1–47). At the time of the study, 39 patients were on no treatment, 37 were on 5-ASA, 34 were on steroids, 58 were on immunosuppressants, and 31 were on infliximab therapy. Sixty two patients (43%) had a previous ileocolonic resection. CRP at the time of CTE and ileoscopy was available in 97 patients. CTE demonstrated that 13 patients had fistulas, eight patients had abscesses, nine patients had cholelithiasis, 10 patients had renal stones, and three had sacroiliitis.
Table 2⇓ depicts CD endoscopic, histological activity, and CT scan parameters of activity in our patient population. Sixty eight patients (48%) had active disease at endoscopy (Rutgeerts’ score ⩾1), which was severe (score ⩾3) in 29 (20%). Seventy three patients (60%) had ileitis at histology, which was moderate to severe in 29 (24%). Previous studies using our CT acquisition technique have suggested that absolute ileal enhancement >108 HU and TI ratio >1.3 correlate with active disease.3,4 Sixty three per cent (90 patients) demonstrated absolute ileal enhancement >108 HU, and 71% (101 patients) had an elevated TI ratio >1.3. CT scan displayed hypervascularity (comb sign ⩾1) in 38 patients (27%) and increased fat density (fat density index ⩾1) in 32 patients (22%). CRP concentration ranged from 0 to 23.7 mg/dl, with a median of 0.4 mg/dl. Fifty nine patients (61%) had a normal CRP (as defined as >0.8 mg/dl) whereas 25 patients (26%) had an elevated CRP between 0.8 and 2.0 mg/dl, and 13 patients (13%) had an elevated CRP greater than 2.0 mg/dl.
Endoscopic, histological, and computed tomography scan parameters of Crohn’s disease activity
Spearman correlation coefficients comparing different parameters of CD activity are given in table 3⇓. All radiological markers of ileal CD severity correlated modestly but significantly with endoscopic severity (p<0.001 for all radiographic markers). Terminal ileal attenuation and the ratio of ileal/control ileal loop attenuation were significantly correlated to histological score (Spearman rank coefficients 0.34–38; p<0.001), with the comb sign and increased fat density also significantly correlated, albeit to a lesser extent (Spearman rank coefficients 0.29 and 0.22, respectively). While no correlation was found between quantitative measures of small bowel enhancement and CRP, CRP did correlate significantly with extraenteric findings of inflammation (Spearman rank coefficient CT comb sign 0.26; p = 0.012; Spearman rank coefficient CT increased fat density 0.36; p<0.001). A significant correlation was found between CRP and Rutgeerts’ score (Spearman rank coefficient 0.24; p = 0.02) but not between CRP and histological inflammation at ileal biopsy (Spearman rank correlation 0.08; p = 0.49). No correlation was found between CD duration and any parameter.
Spearman rank correlations coefficients (and p values) between endoscopy, histology, C reactive protein (CRP), and parameters of Crohn’s disease (CD) activity at computed tomography scan
Table 4⇓ summarises the relationship of CRP to radiological findings of small bowel inflammation localised to the small bowel wall only, versus inflammation extending into the perienteric fat. Table 4⇓ shows that CT findings of increased density in perienteric fat were significantly correlated with CRP levels: when the log CRP of patients with CT findings of increased density in perienteric fat was compared with log CRP of patients with CT findings of patients with normal perienteric fat (with or without mural hyperenhancement), significant associations were found (OR 0.3 (95% CI 0.1, 0.6; p = 0.005)). Median CRP for patients with CT findings of increased fat density was 0.96, compared with a median CRP of 0.23 in patients with CT findings of enteric inflammation limited to the bowel wall (mural hyperenhancement only). While CRP did not differ significantly between patients with versus without the CT comb sign (p = 0.07), this association was significant when only patients with the CT comb sign were compared with those with mural inflammation only (as defined by mural hyperenhancement; p = 0.03). As anticipated, the proportion of patients with Rutgeerts’ scores of 0 to 1 (out of 5) decreased with CT findings of mural hyperenhancement and CT findings of perienteric inflammation.
Relationship of C reactive protein (CRP) to radiological findings of Crohn’s disease in 97 patients, for three different comparisons, with classification schemes based on the presence or absence of inflammation in the perienteric tissues or confined to the small bowel wall
Of the 97 patients in table 4⇑ with serum CRP values, there were only five with an abscess and 15 that had moderate to severe colitis at endoscopy. The interaction of log CRP with abscess and moderate/severe colitis was not significant although the power for these tests was limited. The polychotomous logistic regression model therefore indicated that the associations between log CRP and radiological findings of perienteric inflammation did not depend on the presence of abscess or moderate/severe colitis.
Interestingly, there was no significant difference between log CRP in patients with CT findings of enteric inflammation limited to the bowel wall only (that is, positive endoscopy and CTE but no extraenteric inflammation) compared with patients without enteric inflammation (that is, negative endoscopy and normal ileal enhancement). Median CRP in patients with enteric inflammation only was 0.36 mg/dl compared with 0.24 mg/dl in patients without enteric inflammation by endoscopy or CT (p = 0.38).
DISCUSSION
CTE has assumed an increasing role in the management of CD because of its ability to display exquisite images of the small bowel wall and perienteric tissues. Previous studies from our group and others using either CT or magnetic resonance enterography have validated the ability of quantitative measures of mural hyperenhancement and, in particular, the ratio of mural enhancement in the terminal ileum compared with normal appearing ileum (TI ratio), to detect active small bowel inflammation.3–7,11–,14 Bowel enhancement has also been used to monitor patients with CD before and after anti-inflammatory therapy.1 As expected, we found a statistical correlation between the intensity of bowel enhancement and the severity of inflammation at endoscopy and histology.
The unique aspect of our investigation is that we were able to establish a modest but highly significant correlation between extraintestinal inflammation (as manifest by increased fat density at CTE, and to a lesser extent the comb sign) and CRP levels. For CT and MRI, there are only a few studies in a limited number of patients investigating the correlation between radiological findings of intestinal inflammatory activity and CRP.1 Maccioni et al examined 20 patients with CD. All but one had no clinical signs of active disease at the time of examination.12 Typical MRI appearance (wall thickening, contrast enhancement, oedema in the perienteric fat) was compared with a biological activity score combining white cell count, CRP concentration, and orosomucoid level. The authors reported a significant correlation between all MRI findings of intestinal inflammation and biological activity score. Interestingly, the T2 signal of the perienteric fat correlated most closely with the biological activity score. Contrary to the observations of Maccione et al, three other studies, including one we authored, described only a very weak or no correlation between radiological findings of active CD and serum CRP levels.13–,15 None of these studies however correlated radiological findings of extraenteric inflammation with CRP levels. These studies examined only the relationship of serum CRP to enteric inflammation (as is evidenced by bowel enhancement, for example). Similarly, in the current study, CRP was not correlated with findings of enteric inflammation by itself. However, when we divided patients with active disease into two groups based on radiological criteria—those with enteric inflammation only versus those with radiological evidence of inflammation involving the perienteric tissues (as demonstrated by increased fat density or comb sign)—significant differences were demonstrated: patients with comb sign or increased density of perienteric fat had higher CRP levels than those with inflammation limited to the small bowel wall only (table 4⇑). These findings suggest that elevated CRP may depend more on perienteric inflammation typical of CD than on mucosal involvement, and raise interesting questions regarding the origin of CRP in CD. The fact that Rutgeerts’ score of ileal inflammation correlated weakly with CRP concentration may relate to the fact that severe enteric inflammation may extend to the perienteric tissues.
Meyers and McGuire referred to tortuosity and dilatation of the ileal vessels as “vascular jejunization of the ileum” or the “comb sign,” noting the occurrence of this finding in patients with CD.8 In common with them, who suggested hypervascularity as a feature of early CD, our results indicate that the presence of the “comb sign” is associated with endoscopic severity, histological inflammation, and CRP. Similar to our findings, Lee et al analysed 33 patients with CD using endoscopic and pathological examination as well as barium enema and abdominal CT, and found that CRP and length of hospitalisation were correlated with the presence of comb sign.7 Whether increased vascularisation as assessed by mesenteric angiography or Doppler ultrasound does reflect CD activity is still disputed.9,16
The presence of hypertrophied mesenteric adipose tissue is another characteristic feature of CD.17 At CT, fibrofatty proliferation appears as an increased quantity (but not density) of mesenteric fat, producing a mass effect on adjacent loops, predominantly along the mesenteric side of the bowel. We did not measure or assess fibrofatty proliferation, but rather graded fat density, which we believe represents oedema and infiltration/activation of inflammatory cells into the perienteric fat. Similar to increased vascularity, increased fat density correlated with the endoscopic severity in our study. Correlating with our macroscopic radiological findings, Yamamoto et al recently found significant infiltration of inflammatory cells in hypertrophied mesenteric adipose tissue adjacent to the involved intestine in patients with CD.18 Infiltrated cells were mainly CD68 positive and CD3 positive T lymphocytes, suggesting that the inflamed mucosa and its adjacent mesentery share a common inflammation in CD.
Increased fat density was the radiological finding with the strongest correlation to serum CRP. Mean and median CRP values in patients with this CT finding were 2.66 and 0.96, compared with 0.93 and 0.23, respectively, in patients with CT findings of mural hyperenhancement only (p = 0.005). There is accumulating evidence that adipocytes from the mesentery may participate in the immune response in CD.19–,21 Identification of a distinct secretion pattern of adipocytokines from mesenteric adipose tissue is in progress. Among these, interleukin 6 (IL-6) is an important determinant of hepatic CRP synthesis. A negative correlation between adiponectin concentrations in hypertrophied mesenteric tissue of CD patients and serum CRP concentrations was recently reported.18 Adiponectin was also negatively correlated with IL-6 production, suggesting that it may inhibit inflammatory cytokine production in mesenteric adipose tissue and may be the missing link between IL-6 and CRP. Correlation between increased fat density in CD and CRP may reflect infiltration of adipose tissue by inflammatory cells and particularly macrophages. Macrophages can transdifferentiate from local preadipocytes, suggesting the hypothesis that adipocytes and macrophages may be interconvertible.22 Finally, it was recently shown that CRP mRNA was expressed by adipose human tissue23 and whether mesenteric fat accumulation per se could contribute to high CRP levels in CD remains to be determined.
The importance of clearly defining the relationship between serum CRP concentrations and inflammatory bowel disease activity is highlighted by the outcome of several recent randomised controlled trials of biological agents in CD. In post hoc analyses of these trials (where the primary end points were not met), the subgroup of CD patients with elevated CRP concentrations appeared to have lower rates of placebo response whereas patients with normal CRP concentrations had higher rates of placebo response, raising the possibility that patients with symptoms and low CRP may not have had endoscopic and/or radiographic evidence of inflammation.24,25 The GETAID group compared CD activity index (CDAI), CD endoscopic index of severity, and several biological parameters of activity in 121 patients with colonic or ileocolonic CD. Clinical, endoscopic, and biological findings were poorly correlated.26 In our study, CRP concentration was also weakly correlated with disease activity confined to the bowel wall (that is, with endoscopic and histological activity) but significantly correlated with extraenteric inflammation, as depicted by CTE findings, comb sign, and increased fat density.
Our study has several weaknesses. We did not stratify mural hyperenhancement into categories (for example, mural stratification versus mural hyperenhancement without stratification) but simply examined the degree of mural hyperenhancement. We also did not stratify patients based on prior surgical procedures. In our experience, the same radiological criteria for the presence of active CD can be applied to patients who have undergone prior resection.2 In addition, we did not report a CDAI for patients. Our data were collected retrospectively, and we believed any estimations of clinical symptoms would be highly prone to error. The purpose of our study was to investigate the effect of enteric and extraenteric ileal inflammation on CRP concentrations in a group of Crohn’s patients. The modest degree of correlation we observed between extraenteric small bowel inflammation and serum CRP was most likely due to the fact that several other variables affect changes in serum CRP concentration. Finally, we did not include patient medications as a covariate in the logistic regression models.
In conclusion, quantitative parameters reflecting bowel enhancement (terminal ileal attenuation and ratio of terminal ileal/control ileal attenuation) correlate highly with histological and endoscopic severity. Serum CRP showed no or minor correlation with radiological and endoscopic findings limited to the bowel wall but correlated significantly with radiological findings of perienteric CT inflammation (comb sign and increased attenuation of the perienteric fat). Further experiments are needed to explore the mechanism linking CRP with mesenteric vascularity and fat in CD.
REFERENCES
Footnotes
Published online first 28 April 2006
Conflict of interest: None declared.
Presented in part at the 106th Annual Meeting of the American Gastroenterological Association, Digestive Disease Week, May 15–20, 2005, Chicago, USA
Linked Articles
- Digest