Article Text

Abstract
Background and aims: Infliximab is an effective treatment for ulcerative colitis with over 60% of patients responding to treatment and up to 30% reaching remission. The mechanism of resistance to anti-tumour necrosis factor α (anti-TNFα) is unknown. This study used colonic mucosal gene expression to provide a predictive response signature for infliximab treatment in ulcerative colitis.
Methods: Two cohorts of patients who received their first treatment with infliximab for refractory ulcerative colitis were studied. Response to infliximab was defined as endoscopic and histological healing. Total RNA from pre-treatment colonic mucosal biopsies was analysed with Affymetrix Human Genome U133 Plus 2.0 Arrays. Quantitative RT-PCR was used to confirm microarray data.
Results: For predicting response to infliximab treatment, pre-treatment colonic mucosal expression profiles were compared for responders and non-responders. Comparative analysis identified 179 differentially expressed probe sets in cohort A and 361 in cohort B with an overlap of 74 probe sets, representing 53 known genes, between both analyses. Comparative analysis of both cohorts combined, yielded 212 differentially expressed probe sets. The top five differentially expressed genes in a combined analysis of both cohorts were osteoprotegerin, stanniocalcin-1, prostaglandin-endoperoxide synthase 2, interleukin 13 receptor alpha 2 and interleukin 11. All proteins encoded by these genes are involved in the adaptive immune response. These markers separated responders from non-responders with 95% sensitivity and 85% specificity.
Conclusion: Gene array studies of ulcerative colitis mucosal biopsies identified predictive panels of genes for (non-)response to infliximab. Further study of the pathways involved should allow a better understanding of the mechanisms of resistance to infliximab therapy in ulcerative colitis.
ClinicalTrials.gov number, NCT00639821.
Statistics from Altmetric.com
Ulcerative colitis is a chronic inflammatory bowel disease involving the mucosa of the colon distal to the anal verge. The pathogenesis of ulcerative colitis is believed to result from an interaction of genetic factors, the immune response to microbial dysbiosis and environmental factors. Cigarette smoking and appendectomy have both been associated with a decreased risk of developing ulcerative colitis.1 5-Aminosalicylates, corticosteroids and azathioprine/6-mercaptopurine are the current treatments for ulcerative colitis and patients who fail these treatments were until recently referred for colectomy. The ACT trials have shown that infliximab (Remicade; Centocor, Malvern, Pennsylvania, USA), a mouse/human chimeric monoclonal IgG1 antibody to tumour necrosis factor α (TNFα), is efficacious in the treatment of patients with refractory ulcerative colitis and may avoid colectomy.2 However, around 40% of patients treated do not respond to infliximab and predictors of response are currently lacking.
Microarray technology is a powerful tool that enables the measurement of the expression of thousands of genes simultaneously.3 This technology has been used to elucidate the pathogenic processes underlying different diseases and to identify predictive gene profiles.4 5
The aim of the present study was to identify mucosal gene signatures predictive of response to infliximab in patients with ulcerative colitis, and who were anti-TNFα naive, by using high-density oligonucleotide arrays. We studied two independent cohorts of patients, one at the University Hospital Leuven (cohort A) and another cohort of patients who participated in the placebo-controlled ACT1 study2 (cohort B).
Methods
Patients
Cohort A
Twenty-four patients with active ulcerative colitis, refractory to corticosteroids and/or immunosuppression, were studied in cohort A (table 1(a)). The study was carried out at the University Hospital Leuven (tertiary referral centre) and all patients were followed-up long-term. All individuals gave written informed consent.
Baseline characteristics of the ulcerative colitis patients from cohorts A and B
Consecutive patients with active ulcerative colitis who consented with the study were included. The patients had a total Mayo score between 6 and 12 and an endoscopic subscore of at least 2.2 The patients with ulcerative colitis underwent colonoscopy with biopsies from diseased rectum within a week prior to the first intravenous infusion of 5 mg infliximab per kg body weight. The patients underwent a second flex sigmoidoscopy with rectal biopsies 4 weeks after the first infliximab infusion in the case of a single infusion and at 6 weeks if they received a loading dose of infliximab at weeks 0, 2 and 6. The endoscopist was not blinded to treatment. Half of the biopsies were immediately snap-frozen in liquid nitrogen and stored at −80°C for isolation of RNA. The residual biopsies were fixed in Carnoy’s fixative for up to 5 h and then dehydrated, cleared and paraffin-embedded for histological examination. The features of chronic intestinal inflammation were scored in haematoxylin–eosin-stained slides from the paraffin blocks of each patient using a previously reported scoring system for ulcerative colitis.6 The pathologists who scored the biopsies (KG and GDeH) were blinded to treatment.
The response to infliximab was assessed 4 weeks after the first infliximab treatment for patients who received a single infusion at induction and 6 weeks after the first infliximab treatment for patients who received a loading regimen. Response was defined as a complete mucosal healing with a Mayo endoscopic subscore2 of 0 or 1 and a grade 0 or 1 on the histological score for ulcerative colitis.6 Patients who did not achieve healing were considered non-responders although some of them presented endoscopic and/or histological improvement.
Colonic biopsies were also obtained from six control subjects who underwent colonoscopy for screening for polyps. These subjects gave informed consent for the study.
Cohort B
Endoscopies were carried out and biopsies were collected during the ACT1 trial,2 a placebo controlled trial of infliximab therapy in refractory ulcerative colitis (ClinicalTrials.gov number, NCT00036439), at protocol-specified time points from a subset of randomised patients. Endoscopists and pathologists in this study were blinded to therapy. The institutional review board or ethics committee at each site approved the ACT1 protocol and all patients provided informed consent.
For the current study, 23 pre-treatment colonic mucosal biopsies from 22 patients with active ulcerative colitis (two colonic mucosal biopsies were obtained within 2 weeks from the same patient), who received a loading dose of infliximab (5 or 10 mg/kg) at weeks 0, 2 and 6 for refractory ulcerative colitis were analysed in cohort B (table 1(b)). The biopsies were collected 15–20 cm distal from the anal verge.
The response to infliximab was assessed 8 weeks after their first infliximab treatment. The definition of response was identical to cohort A.
Isolation of RNA
For cohort A, total RNA was extracted from the biopsy specimens using the RNeasy Mini Kit (Qiagen, Valencia, California, USA), according to the manufacturer’s instructions. The integrity and quantity of total RNA were assessed with a 2100 Bioanalyzer (Agilent, Waldbronn, Germany) and a Nanodrop ND-1000 spectrophotometer (Nanodrop Technologies, Wilmington, Delaware, USA). The extracted RNA was used for microarray analysis and in some cases for quantitative RT-PCR (qPCR) analysis.
For cohort B, total RNA was isolated from the biopsies with RNeasy mini-kit according to the manufacturer’s instructions (Qiagen). RNA quality and quantity were analysed with a 2100 Bioanalyzer (Agilent Technologies, Palo Alto, California, USA).
Oligonucleotide array hybridisation
For samples from both cohorts, all steps were performed according to Affymetrix expression analysis technical manual 701021Rev.5 (Affymetrix, Santa Clara, California, USA). Briefly, total RNA was reverse-transcribed into cDNA using the SuperScript Choice System (Invitrogen, Carlsbad, California, USA). cDNA was in vitro transcribed to cRNA and biotin labelled (Affymetrix). Biotinylated cRNA was purified and fragmented. The quality of labelled and fragmented cRNA was assessed with the Agilent 2100 Bioanalyzer. Fragmented cRNA (15 μg) was hybridised overnight to the Human Genome U133 Plus 2.0 Array (Affymetrix), which was comprised of 54 675 probe sets. The arrays were washed, stained with streptavidin–phycoerytrin and scanned on the Affymetrix 3000 GeneScanner. The resulting image files (.dat files) were analysed using Affymetrix GCOS software, and intensity values for each probe cell (.cel file) were calculated. Quality evaluations of the microarrays were as expected. The data were deposited at Gene Expression Omnibus under the series accession numbers GSE14580 for cohort A and GSE12251 for cohort B.
Data analysis
The microarray data were analysed using Bioconductor tools7 in R (version 2.7.2, http://www.r-project.org/). The robust multichip average (RMA) method8 was performed on the Affymetrix raw data (.cel files) from both cohorts to obtain an expression value for each probe set. In cohort B, there were two pre-treatment colonic microarray profiles obtained from the same patient but only one of these was used for further data analysis. Because the severe correction for 54 675 comparisons may have caused false negatives, we next performed the analysis with probe sets that hybridised above background levels to the patient samples. A non-specific filtering was applied on the log2 RMA normalised data from the pre-treatment ulcerative colitis samples from both cohorts to remove the probe sets with low overall intensity and variability that are unlikely to carry information about the phenotypes under investigation. Only probe sets with an intensity >log2 100 in at least 10% of the samples and an interquartile range (IQR) of log2 intensities across the samples >0.5 were included, leaving 9183 probe sets for further data analysis (supplementary table 1). Probe set annotations were obtained through the Affymetrix NetAffx website (http://www.affymetrix.com/analysis/index.affx) or the UCSC Genome Browser website (http://genome.ucsc.edu/). Linear models for microarray data (LIMMA)9 and prediction analysis of microarrays (PAM)10 were used for supervised data analyses. For comparative analysis, LIMMA was used to identify probe sets that are different between responders and non-responders, based on moderated t-statistics. To correct for multiple testing, the false discovery rate (FDR) was estimated from p values derived from the moderated t-statistics using the method of Benjamini and Hochberg (B–H).11 Probe sets with a >2-fold change and a FDR <0.05 were selected as differentially expressed. For class prediction, PAM with leave-one-out cross-validation was carried out on the filtered dataset and on the top 20 and top five differentially expressed known genes that were identified by LIMMA analysis between responders and non-responders, to see if these subsets accurately predict response or non-response to infliximab and to identify the lowest misclassification error rate based on these subsets. Unsupervised average-linkage hierarchical clustering, using Euclidian distance as metric, was applied to data obtained from the data analysis to visualise gene/sample relationship. The results of the clustering were visualised as a two-dimensional heatmap with two dendograms, one indicating the similarity between patients and the other indicating the similarity between genes. The Bio Functional Analysis tool in the Ingenuity Pathway Analysis program (Ingenuity Systems; www.ingenuity.com) was used to identify biological functions and/or diseases that were most significant to the dataset of differentially expressed probe sets, identified by LIMMA analysis between responders and non-responders.
For both cohorts the baseline characteristics were compared between responders and non-responders (table 1(a,b)). The comparisons were performed with the Mann–Whitney U-test for continuous variables and Fisher’s exact test for categorical variables, using SPSS 16.0 software. A p value of <0.05 was considered significant.
Quantitative RT-PCR
To validate the microarray data, qPCR was performed for osteoprotegerin (TNFRSF11B), stanniocalcin-1 (STC1), prostaglandin-endoperoxide synthase 2 (PTGS2), interleukin 13 receptor alpha 2 (IL13Ralpha2), interleukin 11 (IL11) and β-actin, which was used as the endogenous reference gene. cDNA was synthesised from 0.5 μg of total RNA from cohort A samples using the RevertAid H Minus First Strand cDNA synthesis kit (Fermentas, St. Leon-Rot, Germany), following the manufacturer’s protocol. Primers and dual-labelled probes were designed using OligoAnalyzer 3.0 software (http://biotools.idtdna.com/analyzer/;) and synthesised by Sigma–Genosys (Haverhill, UK). The oligonucleotide sequences are available upon request. qPCR was performed in a final reaction volume of 25 μl on a Rotor-Gene 3000 instrument (Corbett Research, Mortlake, Australia), using QuantiTect Multiplex PCR NoROX Kit (Qiagen, Venlo, Netherlands), according to the manufacturer’s instructions. Cycle threshold values were determined by Rotor-Gene 6.0.16 software. All samples were amplified in duplicate reactions. The relative expression of target mRNA levels were calculated as a ratio relative to the β-actin reference mRNA.12 Results were analysed using the Mann–Whitney U-test using SPSS 16.0 software. A p value of <0.05 was considered significant.
A glossary of terms used in methods is provided in supplementary appendix 1.
Results
Response to infliximab
Two independent ulcerative colitis cohorts (cohort A and cohort B) were studied to identify mucosal gene signatures predictive of response to infliximab in ulcerative colitis. The response to infliximab was defined as complete endoscopic and histological healing. Of the 24 patients in cohort A who had ulcerative colitis, eight were responders and 16 were non-responders, while cohort B had 12 responders and 10 non-responders. No baseline characteristics were significantly different between responders and non-responders in both cohorts, except for age in cohort A which was significantly lower in responders than in non-responders (table 1(a,b)).
Comparative analysis between responders and non-responders
For predicting response to infliximab treatment based on gene profiles, pre-treatment expression profiles were compared for responders and non-responders in each cohort and both cohorts combined, using LIMMA.
When all probe sets on the microarray (54 675 probe sets) were included in the LIMMA analysis, the stringent correction for multiple testing resulted in only one differentially expressed probe set between responders and non-responders for ulcerative colitis in cohort A, namely IL13Ralpha2. Therefore a non-specific filtering was first applied on the normalised data from the pre-treatment ulcerative colitis samples from both cohorts to eliminate non-relevant probe sets, leaving 9183 probe sets for further comparative analyses (supplementary table 1).
In cohort A, LIMMA analysis identified a total of 179 probe sets that were decreased in responders compared with non-responders (table 2 and supplementary table 2). Since age in cohort A was significantly different between responders and non-responders, LIMMA analysis with age as confounder was performed. No probe sets were differentially expressed between responders and non-responders, when adjusted for age (lowest FDR 0.06). However, the top-ranked probe sets were similar as compared to the LIMMA analysis without age as confounding factor. A higher FDR can be explained by a reduction in power due to the decreased number of degrees of freedom by inclusion of age in the model. Moreover, no evidence was found for age-related differential gene expression (results not shown).
Summary of the results from LIMMA analyses between the pre-treatment expression profiles of responders and non-responders in cohort A, cohort B and both cohorts combined
In cohort B, a total of 361 probe sets were differentially expressed in responders compared to non-responders, with 38 probe sets showing an increased signal and 323 probe sets a decreased signal in responders compared to non-responders (table 2 and supplementary table 2). For the two cohorts combined (cohort A and cohort B), a total of 212 differentially expressed probe sets were identified by LIMMA analysis, with five probe sets showing an increased signal and 207 probe sets a decreased signal in responders compared to non-responders (table 2 and supplementary table 2).
There was an overlap of 74 differentially expressed probe sets, representing 53 different known genes, between the LIMMA analyses in cohort A and B, and these common probe sets were all downregulated in responders compared to non-responders (table 3 and fig 1).

Venn diagram of the differentially expressed probe sets between responders and non-responders before treatment in ulcerative colitis cohort A and ulcerative colitis cohort B. An overlap of 74 differentially expressed probe sets, representing 53 different known genes, was observed between both cohorts. Ten (bold italic) and three (underlined) overlapping genes were present in the top 20 significantly genes of cohort A and B, respectively. The full annotation for each gene is given in supplementary table 1.
Fold change of the 74 common differentially expressed probe sets between LIMMA analysis in cohort A and LIMMA analysis in cohort B
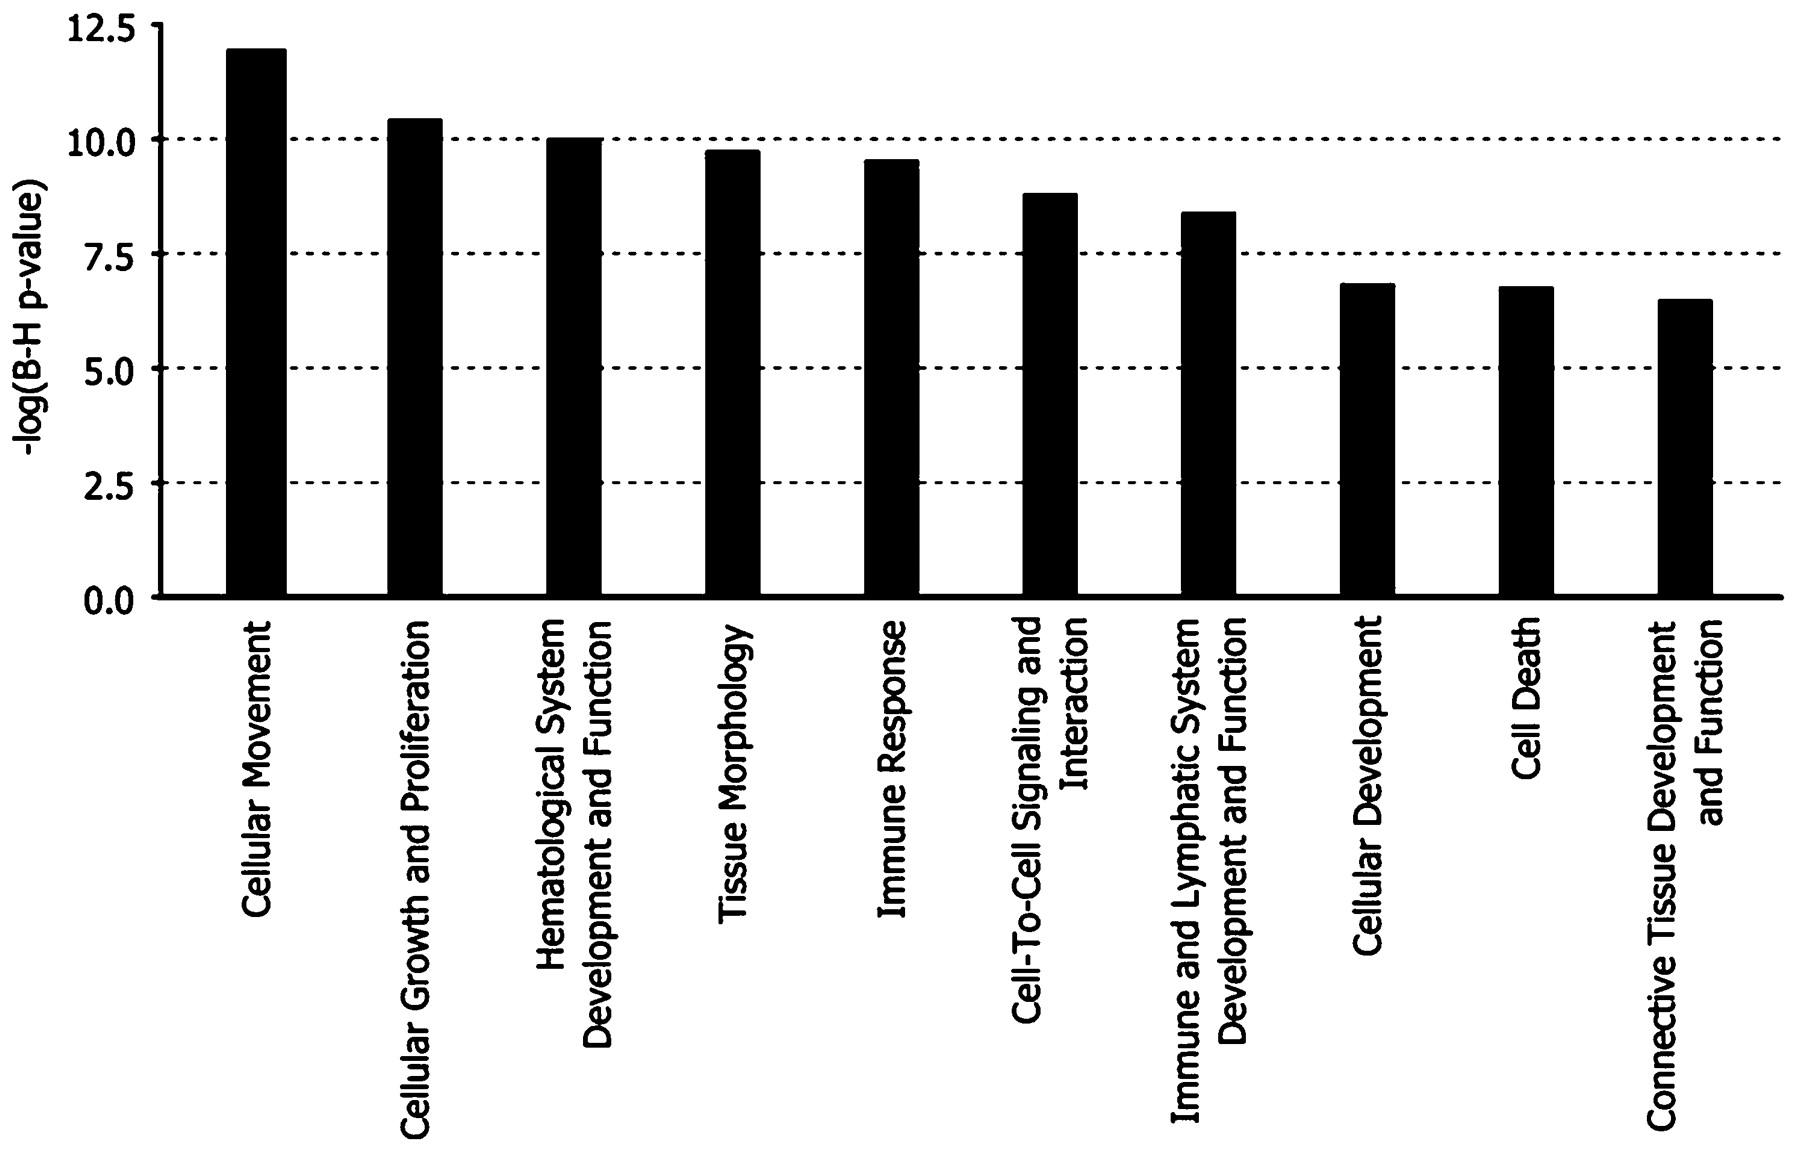
Ten overlapping genes came up in the top 20 differentially expressed known genes for cohort A and three overlapping genes belonged to the top 20 genes of cohort B (fig 1). Figure 2 shows the top 10 most significant biological functions that were associated with the list of the common probe sets.

Bar chart representing the top 10 most significant biological functions that were associated with the list of overlapping probe sets of the LIMMA analysis in cohort A and in cohort B. The functional categories are displayed along the x-axis and the y-axis indicates the significance score. LIMMA, linear models of microarray data.
To identify which biological processes and/or diseases are associated with (non-)response to infliximab treatment, a Bio Functional Analysis was performed on the differentially expressed probe sets from each LIMMA analysis (supplementary table 3). The Bio Functional analyses showed a common predominance of the biological functions: immune response, cellular movement, cellular growth and proliferation, haematological system development and function, cell-to-cell signalling and interaction, cell death and tissue morphology/development.
Class prediction analysis of responders and non-responders
PAM analysis was carried out on the top 20 and top five differentially expressed known genes that were identified by LIMMA analysis between responders and non-responders in cohort A, cohort B and both cohorts combined (table 4). The top 20 and top five gene classifiers used for the PAM analyses in cohort A, cohort B and both cohorts combined are listed in supplementary table 4.
Summary of the results from prediction analysis of microarrays (PAM) in cohort A, cohort B and both cohorts combined
In cohort A, PAM analysis of the top 20 and top five genes allowed classification of samples as responder and non-responder with an overall accuracy of 91.7% (22/24) and 83.3% (20/24), respectively. The top 20 and top five gene classifiers of cohort A were used to predict the (non-)response of the samples from cohort B. Both cohort A classifiers predicted 3/12 responders (25% sensitivity) and 10/10 non-responders (100% specificity) in cohort B correctly. Hierarchical clustering of the log2 expression values from the top 20 (fig 3a) and top five (fig 3b) genes in cohort A resulted in two major clusters of responders versus non-responders, with two non-responders misclassified in the cluster of responders.

Hierarchical cluster analysis of responders (R) and non-responders (NR), based on the log2 expression values of the top 20 and top five differentially expressed known genes**, identified by LIMMA analysis in cohort A (a, b), cohort B (c, d), the two cohorts combined (e, f). Individual samples are shown in columns and genes in rows. The log2 expression values for individual genes are indicated by colour, as shown in the scale (colour key), with yellow indicating a high level of expression and blue a low level of expression. The responders (R) and non-responders (NR) are coloured red and blue, respectively. **For probe sets representing the same gene, the most significant probe set representing that gene was taken for the analysis. LIMMA, linear models of microarray data.
In cohort B, PAM analysis of the top 20 and top five genes revealed an overall accuracy of 86.4% (19/22) and 90.9% (20/22), respectively. The top 20 and top five gene classifiers of cohort B predicted the samples from cohort A with an overall accuracy of 66.7% and 70.8%, respectively. Cluster analysis of the log2 expression values from the top 20 and top five genes in cohort B are shown in fig 3c and fig 3d, respectively.
For the two cohorts combined, PAM analysis of the top 20 and top five genes from the LIMMA analysis for both cohorts combined allowed classification of responders and non-responders with an overall accuracy of 84.8% (39/46) and 89.1% (41/46), respectively. Hierarchical cluster analysis of the two cohorts combined, using the 20 and the five gene classifier, are shown in fig 3e and fig 3f, respectively. For the two cohorts combined, PAM analysis showed that a predictive signature of 20 gene probes was not better than a panel of five gene probes to differentiate responders from non-responders.
PAM analysis was also performed on the filtered dataset for every cohort separately and for both cohorts combined. The minimum misclassification error rate for cohort A was obtained by 13 probe sets, for cohort B by 5877 probe sets and for the pooled data by 15 probe sets. The genes referred by these probe sets overlapped with the top 20 and top five differentially expressed genes.
Validation of the microarray data by qPCR
To confirm the microarray data, qPCR was performed for the top five differentially expressed known genes of the LIMMA analysis of both cohorts combined (TNFRSF11B (fig 4a), STC1 (fig 4b), PTGS2 (fig 4c), IL13Ralpha2 (fig 4d) and IL11 (fig 4e)). LIMMA analysis in cohort A showed also increased mRNA expression of these genes in untreated ulcerative colitis when compared to controls. qPCR confirmed the differential expression of these genes between the responders, non-responders and controls in cohort A.

Quantitative RT-PCR analysis of TNFRSF11B (a), STC1 (b), PTGS2 (c), IL13Ralpha2 (d) and IL11 (e) in controls and pre-treatment ulcerative colitis samples from cohort A. The small horizontal lines in the graphs indicate the average of each group. NR, non-responders; R, responders. *p value <0.05, **p value <0.01.
Discussion
There is a great need to define molecular mechanisms that underlie (non-)response to anti-TNFα therapy in ulcerative colitis. In this study we investigated endoscopic mucosal biopsy derived mRNA expression to identify a “gene expression fingerprint” distinguishing primary non-responders from responders and to identify gene panels predictive of response to infliximab, a chimeric IgG1 monoclonal antibody to TNFα.
Two independent cohorts of patients with refractory ulcerative colitis who received a first treatment with infliximab were studied. We classified patients as responders if they achieved complete healing both endoscopically and histologically. All other patients were considered non-responders although some of them showed clinical improvement or showed mucosal healing at a later time point. We used mucosal healing as an endpoint as it is less open to bias than a symptom score, and there is little chance that complete mucosal healing would occur only by spontaneous disease evolution.
Microarray analysis of pre-treatment mucosal biopsies for both cohorts A and B yielded 179 and 323 probe sets, respectively, that were downregulated in responders versus non-responders. Although the differentially expressed probe sets were not the same for the two cohorts, a comparative analysis of cohort A and B showed an overlap for 74 differentially expressed probe sets, representing 53 different known genes. These common probe sets were all downregulated at baseline in responders compared to non-responders. The top biological functions that were over-represented within the lists of differentially expressed probe sets were cellular movement, haematological system development and function, immune response and cell death. It is not surprising that there is no perfect overlap for the signatures found in both cohorts. This is likely due to differences in patient populations, different environmental background and concomitant therapies.
For each cohort, the top differentially expressed genes were used for predicting response to infliximab in ulcerative colitis and the overall accuracy with the sensitivity and specificity were calculated. The overall accuracy of the top 20 and top five genes for cohort A were 92% and 83%, respectively. For cohort B, overall accuracy was 86% and 91% for the top 20 and top five genes, respectively. When using cohort B to validate the predictive signature obtained in cohort A, we found a 100% sensitivity but a low specificity. When using cohort A to validate the predictive signature of cohort B, we found an overall accuracy of around 70%.
We also carried out an analysis of the microarray data from both cohorts combined. For both cohorts combined, the number of gene probes used for prediction was reduced from an initial panel of 20 to five gene probes. The defined five gene signature panel encoded the following proteins: osteoprotegerin (TNFRSF11B), stanniocalcin-1 (STC1), prostaglandin-endoperoxide synthase 2 (PTGS2), interleukin 13 receptor alpha 2 (IL13Ralpha2) and interleukin 11 (IL11), and predicted the response to infliximab therapy with 89% accuracy. We confirmed the predictive value of each of the top five probes derived from the combined analysis by qPCR.
TNFRSF11B is a member of the TNF-receptor superfamily that functions as a soluble decoy receptor. It is binding to RANK ligand, thus preventing the interaction with RANK and thereby inhibiting the differentiation and activation of osteoclasts. Moreover, modulation of RANKL-RANK interaction with exogenous recombinant osteoprotegrin reverses skeletal abnormalities and reduces colitis by decreasing colonic dendritic cell numbers.13 It is also binding to TNF-related apoptosis-inducing ligand (TRAIL), an important regulator of cell survival.14 15
STC1, a secreted, homodimeric glycoprotein that is expressed in a wide variety of tissues, maintains endothelial permeability in TNFα-treated endothelial cells through preservation of tight junction protein expression, suppression of superoxide anion production, and inhibition of the activation of nuclear factor kappa B (NF-κB) and cJun N-terminal kinase (JNK), suggesting an important role for this protein in regulating endothelial functions.16
PTGS2, also known as cyclooxygenase 2b, is the key inducible enzyme in biosynthesis of prostaglandins, prostacyclin and thromboxanes. Together with NO synthase, this enzyme is over-expressed in chronic inflammation and its over-expression occurs early in ulcerative colitis-associated neoplasia.17
The importance of IL13Ralpha2 in colitis has recently become apparent. Originally, it was believed that IL13Ralpha2 acts as a decoy receptor.18 A study from Fichtner-Feigl, however, showed that IL13 signalling through IL13Ralpha2 is involved in the induction of transforming growth factor β1 (TGFβ1) production and fibrosis.19
IL11 has been used to treat inflammatory bowel disease because this cytokine decreases NF-κB activity, but the studies were not successful. Recent studies have shown that IL11 induces Th2 polarisation of human CD4+ T cells.20 Moreover, IL11Ralpha, the main receptor for IL11, plays a key role in the pathogenesis of IL13-induced inflammation and remodelling by activation of TGFβ1 21 and acts in concert with IL13Ralpha2 in this respect.
We think that the markers identified in this study are specific for anti-TNF therapy and not for resistance therapy overall as all patients had already failed other therapies before being treated with infliximab. Moreover, the five genes identified encode for proteins involved in signalling in the adaptive immune response, inflammation and TNF pathways. Further study of the genes and pathways identified in the present study should allow a better understanding of the molecular mechanisms of infliximab action and mechanisms of resistance to anti-TNF therapy. We plan to develop a predictive diagnostic chip with these five genes and to further prospectively validate this gene signature in ulcerative colitis patient candidates for anti-TNF treatment. In this manner optimal use of resources could be achieved and safety improved.
In conclusion we described gene expression profiles in mucosal biopsies from two cohorts of infliximab-naive patients prior to infliximab therapy. Our studies demonstrate that a limited number of genes involved in the inflammatory cascade account for resistance of ulcerative colitis to respond to anti-TNFα therapy.
Acknowledgments
The authors thank the German National Genome Research Network for the course in practical microarray data analysis.
REFERENCES
Supplementary materials
web only appendices
Files in this Data Supplement:
Footnotes
Funding This work was supported by a grant from the Fund for Scientific Research – Flanders (FWO) Belgium (FWO project nr.G.0440.06) and by Centocor.
Competing interests PR, SV, GvA and KG have received grant support, lecture fees and consulting fees from Centocor and Schering–Plough. GT, K Li, CM, KM and FB are employees of Centocor Research and Development, Inc. X-YRS is a former employee of Centocor Research and Development, Inc. and is currently an employee of Ethicon, Inc. The other authors have no competing interests.
Provenance and peer review Not commissioned; externally peer reviewed.
Ethics approval The ethics committee of the University Hospital Gasthuisberg, Leuven, approved the study on 3 March 2005.
▸ Supplementary material (an appendix and four tables) is published online only at http://gut.bmj.com/content/vol58/issue12