Article Text

Abstract
Objective Non-alcoholic fatty liver disease (NAFLD) is prevalent among obese people and is considered the hepatic manifestation of metabolic syndrome. However, not all obese individuals develop NAFLD. Our objective was to demonstrate the role of the gut microbiota in NAFLD development using transplantation experiments in mice.
Design Two donor C57BL/6J mice were selected on the basis of their responses to a high-fat diet (HFD). Although both mice displayed similar body weight gain, one mouse, called the ‘responder’, developed hyperglycaemia and had a high plasma concentration of pro-inflammatory cytokines. The other, called a ‘non-responder’, was normoglycaemic and had a lower level of systemic inflammation. Germ-free mice were colonised with intestinal microbiota from either the responder or the non-responder and then fed the same HFD.
Results Mice that received microbiota from different donors developed comparable obesity on the HFD. The responder-receiver (RR) group developed fasting hyperglycaemia and insulinaemia, whereas the non-responder-receiver (NRR) group remained normoglycaemic. In contrast to NRR mice, RR mice developed hepatic macrovesicular steatosis, which was confirmed by a higher liver concentration of triglycerides and increased expression of genes involved in de-novo lipogenesis. Pyrosequencing of the 16S ribosomal RNA genes revealed that RR and NRR mice had distinct gut microbiota including differences at the phylum, genera and species levels.
Conclusions Differences in microbiota composition can determine response to a HFD in mice. These results further demonstrate that the gut microbiota contributes to the development of NAFLD independently of obesity.
- Colonic Microflora
- Cytokines
- Fatty Liver
- Real Time PCR
- Lipid Metabolism
Statistics from Altmetric.com
Significance of this study
What is already known on this subject?
-
We and others have shown that GF mice are resistant to diet-induced obesity, insulin resistance and steatosis.
-
The administration of a HFD to conventional mice leads to heterogeneous responses including variable levels of weight gain, glycaemia or steatosis development.
-
Each mouse and human harbours a different gut microbiota.
What are the new findings?
-
▸ Gut microbiota markedly impacts the lipid metabolism in the liver, independently of obesity.
-
▸ The propensity to develop NAFLD features including hyperglycaemia or steatosis is transmissible by means of gut microbiota transplantation.
-
▸ Bacterial species associated with the NAFLD-resistant and NAFLD-prone phenotypes have been identified.
How might it impact on clinical practice in the foreseeable future?
-
▸ These findings suggest that manipulation of the gut microbiota may be a new strategy to prevent or treat NAFLD and associated metabolic disorders including type 2 diabetes or metabolic syndrome. In addition, gut microbiota profiling could help predict the susceptibility to develop metabolic disorders.
Introduction
Non-alcoholic fatty liver disease (NAFLD) is considered the hepatic manifestation of metabolic syndrome and is commonly associated with insulin resistance.1 NAFLD affects 20–30% of western countries’ population and more than 80% of obese people. It refers to a spectrum of liver damage ranging from simple steatosis to non-alcoholic steatohepatitis, advanced fibrosis, cirrhosis or even hepatocellular carcinoma. An increasing body of literature has recently been generated identifying gut microbiota as a new environmental factor contributing to obesity and NAFLD.2 ,3 First, Bäckhed and colleagues4 ,5 showed that germ-free (GF) C57BL/6J mice gained less weight than conventional mice when given a sugar and lipids-rich diet despite greater food consumption. Moreover, Rabot et al6 observed that GF mice receiving a high-fat diet (HFD) showed enhanced insulin sensitivity with improved glucose tolerance and reduced insulinaemia. Concurrently, colonisation of GF mice by a gut microbiota from conventional mice produced an increase in body fat content.4 More recently, an association between the human gut microbiota and the development of fatty liver due to choline deficiency has been identified.7 Moreover, it was revealed that changes in the gut microbiota associated with inflammasome defects regulates the progression of NAFLD.8
HFD feeding is widely used in rodents to study the onset and progression of obesity and associated metabolic disorders. However, the high-fat-induced phenotype varies distinctly, even within a group of animals with the same genetic background,9 ,10 and it has recently been demonstrated that disctinct gut microbiota profiles are associated with different metabolic phenotypes.11 Gut microbiota of humans and mice are more than 95% made up of three phyla: Firmicutes, Bacteroidetes and Actinobacteria. In contrast to the poor diversity at the phylum level, the species level displays a high diversity, with an average human microbiota estimated at 200 prevalent bacterial species and up to 1000 less common species.12 Importantly, in humans but also in mice, the bacterial species profiles are unique for each individual.13 We therefore hypothesised that the gut microbiota modulates the effect of a HFD challenge and that the variability of the composition of this microbiota could explain the diversity of responses to HFD.
In the present work, we developed a strategy based on gut microbiota transfer to establish whether we can transmit the different propensity to develop NAFLD in response to HFD by means of gut microbiota transplant.
Methods
Animal experimentation
Stage 1
Eight-week-old conventional male C57BL/6J mice (Janvier, Le Genest St Isle, France) were fed for 16 weeks a freely available sterilised HFD containing 40% butter and 2.5% soy oil (60% energy from fat, 22.7% from carbohydrates and 17.2% from proteins; SAFE, Augy, France). Body weight was monitored weekly.
Stage 2
GF male C57BL/6J mice were reared from GF breeding pairs at ANAXEM, the GF animal facilities of Micalis (Jouy-en-Josas, France). Two groups of 8-week-old GF mice were colonised with the gut microbiota of two conventional mice from stage 1 according to the following procedure. The caecal content of donor mice was collected immediately after euthanasia and diluted in liquid casein yeast medium (1 : 100 w/vol) in an anaerobic chamber. Colonisation was achieved by oral-gastric gavage with 250 µl of the diluted caecal content. GF mice were switched from chow to HFD 1 week before the colonisation and were then freely fed the HFD for an additional 16 weeks after colonisation.
All mice were anaesthetised with isoflurane. Procedures were carried out in accordance with the European guidelines for the care and use of laboratory animals and with permission 78–60 of the French veterinary services.
Measurement of plasma parameters and short chain fatty acid concentrations
After 16 weeks of diet, blood taken from the retro-orbital sinus was collected into chilled heparin-coated tubes after 6 h of fasting. Blood glucose was measured using an Accu-Check glucometer (Roche Diagnostics). The remaining blood was then centrifuged at 10 000 g for 10 min. Plasma was aliquoted and frozen at −80°C until analysis.
Alanine and aspartate aminotransferases and lipids were determined using an Olympus AU400 robot. Plasma insulin, leptin, resistin, monocyte chemotactic protein 1, tumour necrosis factor α (TNFα) and interleukin (IL)-6 concentrations were assayed using a Luminex 100 IS system (Luminex Corporation) with a Milliplex MAP mouse serum adipokine panel kit (Millipore). Insulin resistance was estimated by homeostasis model assessment (HOMA index): fasting serum glucose (mg/dl)×insulin (mU/l)/405. Short-chain fatty acids (SCFA) and branched-chain fatty acids (BCFA) were assayed in caecal samples from receiver mice as previously described.14
Measurement of liver triglycerides
Portions of frozen liver from receiver mice were homogenised in chloroform–methanol (2 : 1) in order to extract total lipids according to the methodology of Folch et al.15 The organic extract was dried and reconstituted in isopropanol. The triglyceride content was measured with a triglycerides determination kit (Sigma-Aldrich, Saint-Louis, Missouri, USA) according to the manufacturer's instructions and expressed in mmol of triglycerides per milligram of liver.
Liver histology
Thin slices of formaldehyde-fixed, paraffin-embedded liver tissue were stained with haematoxylin and scored for severity of the steatosis and inflammation by an experienced pathologist (FW) blinded to the experiments. The steatosis score was assessed according to the percentage of concerned hepatocytes multiplied by the following grade relying on the size of the fat droplets: grade 1: microvesicular pattern; 2: mixed microvesicular superior to macrovesicular pattern; 3: mixed macrovesicular superior to microvesicular pattern; and 4: macrovesicular ones only.
Gene expression analysis by quantitative PCR
Livers of the receiver mice were disrupted in RNA-PLUS solution (QBiogene). Total RNA was extracted using a modified Chomczynski's procedure.16 RNA concentration and purity were determined using the Nanodrop ND-1000 spectrophotometer (Thermo Fisher Scientific) at a wavelength of 260/280 nm. RNA integrity was determined with the Agilent bioanalyzer 2100 system with the RNA 6000 Nano LabChip kit. Samples with an RNA integrity number inferior to 8 on a scale ranging from 0 to 10 were eliminated.
Total RNA (2 µg per reaction) was reverse transcribed into complimentary DNA using a high-capacity cDNA reverse transcription kit (Applied Biosystems) according to the manufacturer's instructions. Thereafter, half of the product of each reverse transcription reaction was added to an equal volume of TaqMan universal PCR master mix and then loaded on a TaqMan low density array card (Applied Biosystems). The TaqMan low density array card was centrifuged twice for 1 min at 330g before being sealed. PCR amplification was performed using an Applied Biosystems Prism 7900HT sequence detection system. Data were analysed using SDS V.2.2 software. Statistical analysis was performed using DataAssist v2.0 (Applied Biosystems). The relative gene expressions were normalised to three reference genes: 18S, gapdh and ubc2, chosen on the basis of results obtained from TaqMan mouse endogenous control arrays (Applied biosystems). The non-responder-receiver (NRR) group was used as a reference for the relative expression of genes.
16S rRNA sequencing
Microbiota compositon was thoroughly analysed using 454 pyrosequencing targeting the 16S ribosomal DNA V3–V4 region (V3fwd: 5′ TACGGRAGGCAGCAG 3′, V4rev: 5′ GGACTACCAGGGTATCTAAT 3′). Forty DNA samples, corresponding to the two caecal samples from donor mice used for inoculation, and faecal samples from receiver mice at two sampling time, were pyrosequenced at Genoscreen (Lille, France) using GS-FLX-Titanium technology. Sequences were trimmed for adaptors and PCR primer removal and binned for a minimal sequence length of 300 bases, a maximum homopolymers length of 6, a minimal base quality threshold set at 27 and a maximum of 15% tolerated low quality bases and N on the overall sequence length. The resulting sequences were assigned to different taxonomic levels (from phylum to genus) using the RDP database (release 10, update 26).17 Using QIIME,18 sequences were further clustered in at 97% of identity in operational taxonomic unit (OTU) using cdhit.19 OTU were assigned to the closest taxonomic neighbours and relative bacterial species using SEQMATCH and up-to-date 16S rRNA gene RDP database. Estimates of phylotype richness were calculated according to the bias-corrected Chao1 estimator. All statistical analyses were performed using the R program and ade4 package (http://pbil.univ-lyon1.fr/ADE-4/). Principal component analyses (PCA) with the two receiver mice groups at different time points as instrumental variables (interclass PCA) were computed and statistically assessed by a Monte Carlo rank test to observe their net effect on the scattering of the microbiota of different mice. Interclass PCA allows highlighting combinations of variables that maximise variations observed between qualitative variables (eg, specific responder-receiver (RR)/NRR groups). The Wilcoxon test was applied to assess statistical significance in bacterial composition between the different samples.
Statistical analyses
Results are represented as mean±SEM, or median (IQR) for non-parametric data. Statistical analysis was performed by Student's t or Mann–Whitney–Wilcoxon tests, respectively (StatView, SAS Institute Inc, Cary, USA); p<0.05 was considered statistically significant.
Results
Selection of the responder and non-responder donor mice
Conventional mice of the strain C57BL/6J were freely fed a HFD for 16 weeks. HFD treatment led to varying body weights ranging from 33.6 to 47.0 g, with an average final body weight of 39.0±3.9 g (table 1). Despite a majority of the mice developing metabolic disorders, several mice developed high levels of glycaemia, systemic inflammation and steatosis together and were considered as ‘responders’. Conversely, several mice did not develop any metabolic disorders and were considered ‘non-responders’. Therefore, we selected from this cohort one responder and one non-responder mouse to verify if we could transmit to GF mice the responder or non-responder phenotypes using gut microbiota transplants. To ensure reliable recovery of the initial gut microbiota in GF mice, transfer of microbiota from donor to receiver mice had to be performed using fresh caecal samples. As a consequence, selection of the donor mice were performed on the basis of parameters available the day of conventional mice euthanasia, including body weight, fat pad and liver weights, food intake, HOMA index and plasma concentrations of pro-inflammatory cytokines (table 1). We intentionally selected two donor mice with similar body weights, fat pad masses and food intake to make sure that the differences in metabolic parameters were not the consequence of a different degree of obesity.
Metabolic status of conventional and donor mice after 16 weeks of HFD
The two groups of receiver mice developed comparable obesity but different metabolic statuses
Two groups of GF male C57BL/6J mice were colonised with the inocula prepared from the two selected donor mice (conventionalisation). The two conventionalised groups were then named NRR and RR, and were subsequently maintained in isolators. After 16-week HFD feeding, both groups showed similar body weight gains (13.2±3.2 g and 14.6±2.6 g for NRR and RR, respectively, p=0.21) and final body weights (figure 1A). Daily food consumption was 2.52±0.92 g and 2.62±0.91 g for NRR and RR mice, respectively, indicating no differences in food intake. Accordingly, epididymal fat pad weights were not found to be different between these two groups (see supplementary table S1, available online only). Conversely, they displayed significantly different fasting glycaemia levels (104.4±26.6 mg/dl for NRR vs 134±34.1 mg/dl for RR) (figure 1B). Concurrently, fasting insulinaemia was lower in NRR mice than in RR mice (665.2±358.9 g/ml vs 1072.4±469.4 pg/ml) (figure 1C). The HOMA index (figure 1D) was consistently 2.4-fold greater in the RR group than in the NRR group, suggesting that the two groups developed different levels of insulin resistance. Leptinaemia (figure 1E) was 75% higher in RR than in NRR mice, whereas the level of resistin was not significantly different in the two groups (data not shown).

Metabolic responses to high-fat diet of non-responder-receiver (NRR) and responder-receiver (RR) mice. (A) Body weight curves; (B) fasting glycaemia; (C) fasting insulinemia; (D) homeostasis model assessment—insulin resistance Index; (E) fasting leptinaemia. All mice were fasted for 6 h before blood sampling. Data are mean±SEM, n=18 for NRR and n=22 for RR mice. **p<0.01; ***p<0.001 (Student's t test).
The aspartate aminotransferase plasma concentration was three times higher in RR mice than in NRR mice (433.0±201.2 vs 135.9±73.7 UI/l, p=0.0058), whereas the difference did not achieve statistical significance (68.5±56.8 vs 38.1±34.4 UI/l, p=0.0786) for alanine aminotransferase concentrations. Fasting plasma concentrations of triglycerides, cholesterol and high-density lipoproteins were similar in the two groups (see supplementary table S2, available online only).
Concentrations and proportions of SCFA (acetate, butyrate, propionate, valerate, caproate) were found to be similar in the caecums of NRR and RR groups (see supplementary table S3, available online only). Consistently, the total SCFA concentration was not different in the two groups. Conversely, concentrations and proportions of isobutyrate and isovalerate were significantly higher in the caecum of RR mice (see supplementary table S4, available online only). These BCFA are compounds known to result from the bacterial fermentation of valine and leucine.
RR mice accumulated more triglycerides in the liver than NRR mice
Liver histological analysis showed that the NRR group developed slight to mild steatosis (figure 2A), whereas the RR group developed marked mixed or macrovesicular steatosis (figure 2B). The steatosis score was found to be higher in RR than in NRR mice (3.00±0.87 vs 1.50±0.61) (figure 2C). Consistent with the morphological changes in the lipid deposition, the liver triacylglycerol concentration was 30% higher in RR mice (figure 2D). No inflammatory infiltrate was observed and no differences in liver weights were found between the two groups (see supplementary table S1, available online only).

Representative H&E stains of paraformaldehyde-fixed liver sections prepared from non-responder-receiver (NRR) (A) and responder-receiver (RR) mice (B). The steatosis score corresponds to the percentage of hepatocytes presenting with steatosis multiplied by the intensity of the steatosis of the concerned hepatocytes (C). (D) Hepatic triglyceride concentrations (mmol of triglycerides per milligram of liver). Data are shown as mean±SEM, n=18 for NRR and n=22 for RR mice. *p<0.05; **p<0.01 (Student's t test).
RR mice displayed a steatosis-prone hepatic metabolism in contrast to NRR mice
We analysed the hepatic expression of genes involved in lipid uptake, lipogenesis, fatty acid catabolism and very low-density lipoprotein export. The relative expressions of the transcription factors sterol regulatory binding protein (SREBP) 1c, liver X receptor and carbohydrate response element binding protein (ChREBP) are shown figure 3A. These nuclear factors are known to promote de-novo lipogenesis.20 The expression of SREBP1c and ChREBP was 1.97 and 2.02 greater in the RR group than in the NRR group, whereas no difference was found in the expression of liver X receptor between the two groups. The relative expressions of three lipogenic enzymes (acetyl-CoA carboxylase 1, stearoyl-CoA desaturase 1 and fatty acid synthase) are shown figure 3B. Stearoyl-CoA desaturase 1 and fatty acid synthase were not differently expressed in the two groups of mice. Conversely, acetyl-CoA carboxylase 1 appeared to be upregulated in RR mice (fold change 1.97). CD36, which imports a large variety of lipids and lipoproteins, was more highly expressed in RR than in NRR mice (fold change 2.32). On the contrary, fatty acid transport protein 5, which essentially transports long-chain fatty acids, was slightly but significantly downregulated (fold change 0.80). No differences were found between the two groups of mice in the messenger RNA levels of carnitine palmytotransferase 1a, a transport protein that regulates mitochondrial β-oxidation, and membrane transport protein, a protein exerting a central regulatory role in lipoprotein assembly and secretion (figure 3C).

Relative hepatic gene expression analyses of transcription factors (A), lipogenic enzymes (B) and lipids transporters (C). Results were normalised on the non-responder-receiver (NRR) group. Data are shown as mean±SEM, n=14 for NRR and n=16 for responder-receiver (RR) mice. *p<0.05; ***p<0.001. ACC, acetyl-CoA carboxylase; ChREBP, carbohydrate response element binding protein; CPT1a, carnitine palmytotransferase 1a; FAS, fatty acid synthase; FATP5, fatty acid transport protein 5; LXR, liver X receptor; MTP, membrane transport protein; SCD1, stearoyl-CoA desaturase 1; SREBP, sterol regulatory binding protein.
No major differences in systemic and hepatic inflammation were detected between the two groups of receiver mice
Systemic inflammation was evaluated by assaying the plasma concentration of pro-inflammatory cytokines. No significant differences in the plasma concentrations of these cytokines were found between the two groups of receiver mice (see supplementary table S2, available online only). We then focused specifically on liver inflammation by assaying the hepatic expression of cytokines, markers of liver macrophages and Toll-like receptors (TLR). The relative expression of TNFα, IL-1β, IL-6, IL-10 and transforming growth factor β were found to be similar in the two groups of mice (see supplementary table S5, available online only). Likewise, expressions of CD68 (a marker of macrophages), and TLR (TLR-2, TLR-4, TLR-5 and TLR-9), which play a central role in the innate immune system by recognising bacterial components leading to activation of immune response, appeared to be equivalent in NRR and RR mice (figure 4A,B). Altogether these results indicate that systemic and hepatic inflammation was similar in RR and NRR mice.
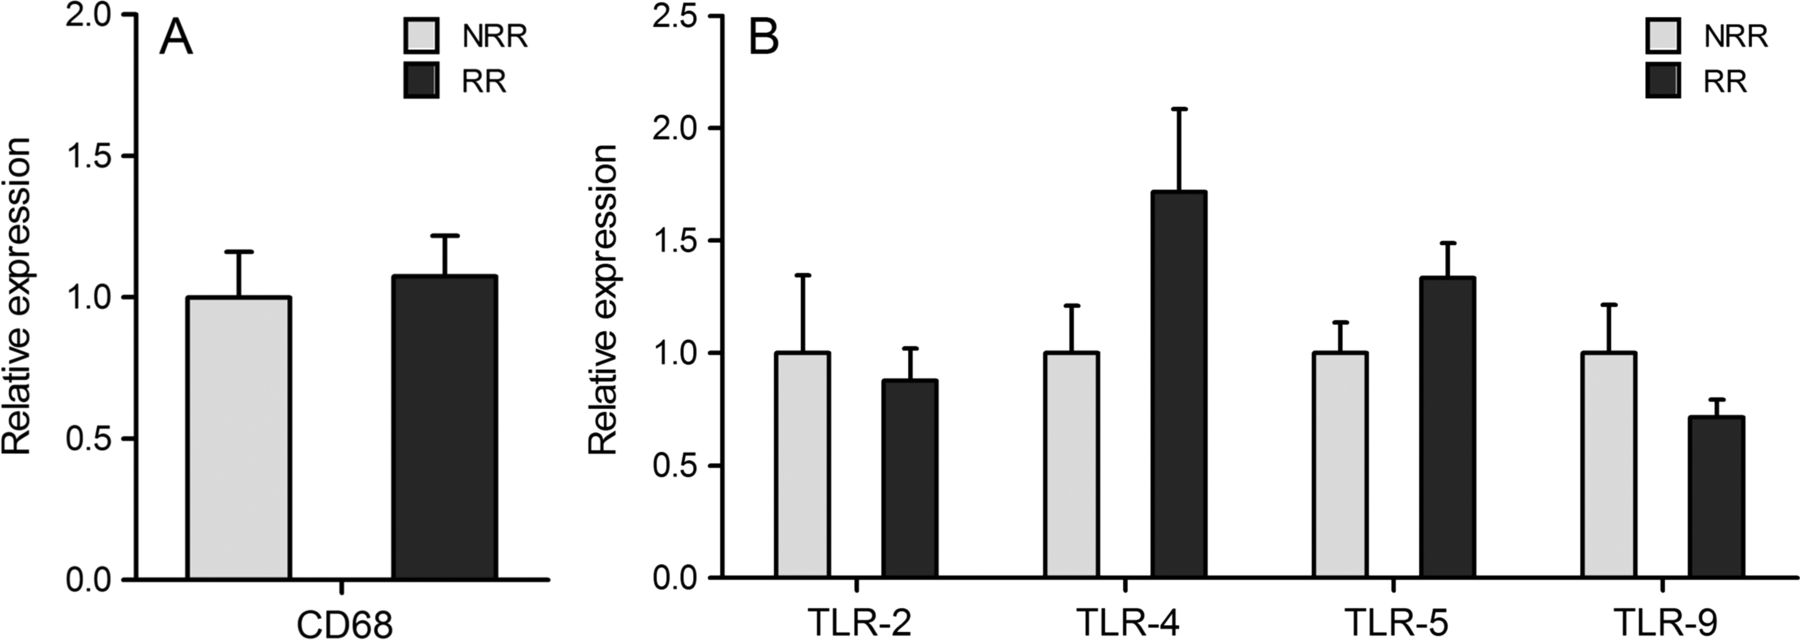
Relative hepatic gene expression analyses of CD68 (A), and Toll-like receptors (TLR) 2, 4, 5 and 9 (B). Results were normalised on the non-responder-receiver (NRR) group. Data are shown as mean±SEM, n=14 for NRR and n=16 for responder-receiver (RR) mice.
Gut microbiota differs between RR and NRR mice
Caecal samples used for inoculation as well as faecal samples from receiver mice after 3 (T3) and 16 (T16) weeks of HFD were analysed by pyrosequencing. A total of 188 058 sequences was obtained and after trimming, 120 241 sequences were further analysed (approximately 3000 sequences/sample). To evaluate similarity among the samples, interclass PCA was performed based on their microbial composition. The main genera between caecal samples from donor mice and faecal samples from corresponding receiver mice were conserved but showed different proportions (see supplementary figure S1, available online only). These differences may relate to sampling location or specific selection within receivers. At a genus level, the microbiota from NRR and RR mice significantly clustered separately at T3 (Monte Carlo test; p=0.001) but adopted a closer configuration at T16 (figure 5A). Barnesiella and Roseburia genera were represented more in RR mice at T3 and T16, whereas Allobaculum was higher in NRR mice (figure 5B). Moreover, HFD treatment increased Barnesiella and Allobaculum and decreased Lactobacilli in the two groups (figure 5B). The microbial phylotype richness assessed by the Chao1 estimator was very similar between the two groups whatever the sampling time (figure 5C). At the phylum level, RR mice harboured significantly increased numbers of sequences belonging to Firmicutes at T3 (p=0.0041; figure 5D). Finally, two main bacterial species (Lachnospiraceae bacterium 609 and a relative of Barnesiella intestinihominis), corresponding to more than 10% of sequences, were found to be significantly overrepresented in RR mice at T3 (p=2.16e-5 and p=0.00025, respectively) and to a lesser extent at T16. Conversely, a significantly increased number of sequences related to Bacteroides vulgatus was found in NRR mice (p=0.00041; figure 5E).

Microbiota composition and diversity in non-responder-receiver (NRR) and responder-receiver (RR) mice (A) Interclass principal component analyses with phenotype as environmental factor was performed based on the genera abundance. Mice (light green circles, NRR_T3; green circles, NRR_T16, light red, RR_T3 and red, RR_T16) were clustered (ellipses) and the centre of gravity computed for each class. The p value of the link between phenotype and genera abundance was assessed using a Monte Carlo test (999 replicates) p=0.001. (B) Main genus composition as a percentage of total assigned sequences (sequences unassigned to any genus represent 46% of total sequences in average, SD 13.94%). (C) Estimates of bacterial richness as assessed by the Chao1 estimate (median number of OTU NRR_T3: 1052; NRR_T16: 1230; RR_T3: 1080; RR_T16: 1146). (D) Bacterial phyla distribution as a percentage of total sequences. (E) Differentially represented bacterial species (or relatives of bacterial isolates). All presented results are statistically significant (p<0.05) as assessed by the Wilcoxon test after applying Bonferroni correction.
Discussion
HFD feeding is extensively used in rodents for developing obesity, steatosis and insulin resistance. In fact, these models are considered more relevant to human metabolic diseases than models of gene inactivation.21 Nevertheless, wide variations in the susceptibility to develop HFD-associated features have been observed,9 ,10 and the factors that make some rodents susceptible and others resistant to metabolic disorders induced by HFD are still indefinite. Using GF animal models, we and others have previously demonstrated that mice devoid of gut microbiota are resistant to diet-induced obesity, steatosis and insulin resistance.5 ,6 Like humans, each conventional mouse harbours a unique gut microbiota, and it was recently shown that diabetes-sensitive and diabetes-resistant mice are associated with a specific gut microbiota.11 In the present study, we first submitted mice of a common biological lineage to the same HFD and laboratory environment, and obtained, as expected, heterogeneous responses including variable weight gain, steatosis, HOMA index and systemic inflammation levels. Then, we inoculated two groups of GF mice with the caecal microbiota of two mice whose responses to HFD were discrepant. The outcomes of HFD feeding were found to be different in these two groups of mice associated with distinct microbiota. Gut microbiota dysbiosis has recently been associated with liver diseases.7 ,8 Here, we further demonstrated for the first time the causal role of the gut microbiota in the susceptibility to develop NAFLD features in response to a HFD challenge. Using pyrosequencing, we identified phyla and genera differently represented in the gut microbiota of the two receiver groups. Moreover, two bacterial species were found to be dominant in RR mice only. Interestingly, Barnesiella intestinihominis belongs to the family Porphyromonadaceae, which was increased in inflammasome-deficient mice associated with exacerbated hepatic steatosis and inflammation.8 On the other hand, Bacteroides vulgatus, previously found to be decreased in the faecal microbiota of patients with diabetes,22 was found to be overrepresented in NRR mice, suggesting that this bacterial species may exert protective effects against the development of metabolic disorders.
The concept that insulin resistance is a common process to all stages of NAFLD is now accepted. We have previously demonstrated that GF mice are resistant to diet-induced insulin resistance.6 In the present study, we further revealed that the insulin resistance index is a transmissible feature by means of gut microbiota transplantation. Both glucose and insulin were found to be higher in RR mice, indicating that hyperplycaemia is likely to result from insulin resistance rather than insulin secretion deficit. We also observed that NRR and RR mice displayed similar body and epididymal fat pad weights. Despite not measuring mesenteric and subcutaneous fats, our results suggest that insulin resistance develops from separate mechanisms to those responsible for obesity. This supports a recent study revealing that the gut microbiota impacts adipose macrophage accumulation and systemic glucose metabolism by independent mechanisms.23 This further confirms a previous study demonstrating that the modulation of gut microbiota using antibiotics in a diet-induced obesity mouse model showed a significant improvement of fasting glycaemia and insulin resistance independently of food intake or adiposity.24 In addition, improved insulin sensitivity was found to correlate with reduced hepatic lipogenesis and steatosis in these antibiotic-treated mice,24 implying that the influence of the gut microbiota on host glucose metabolism and on liver functions may result from dependent or identical mechanisms.
It has been proposed that the ability of GF mice to resist diet-induced insulin resistance could be due partly to their low plasma TNFα concentrations.6 Our results, showing different levels of HOMA index but similar TNFα plasma concentrations and hepatic expression levels, indicate rather that the impact of our two different transplanted microbiota is independent of TNFα. It corroborates recent results showing similar TNFα and IL-6 expression in the livers of diabetic sensitive and resistant mice, despite different microbiota profiles.11 Overall, all parameters related to inflammation were similar in our two receiver groups and were then unaffected by the transplantation of different gut microbiota. This indicates that in our conditions the gut microbiota affects host metabolism by mechanisms that might be independent of the immune system. This finding opens new perspectives in the field indicating that gut communities are able to drive host metabolism by cross-talk mechanisms still unknown that seem to be independent of a systemic pro-inflammatory state.
Dysregulation of hepatic metabolism has been implicated in the development of NAFLD. Nevertheless, HFD, which causes increased influx of fatty acids without primary impairment of very low-density lipoprotein export, induced merely steatosis, but not liver inflammation.25 Previous studies have demonstrated that GF mice display increased fatty acid oxidation and decreased lipogenesis.4–6 Our results from gene expression in the liver indicate that the increased steatosis observed in the livers of RR mice results mainly from increased lipid uptake and de-novo lipogenesis, suggesting increased energy availability. Indeed, a higher energy harvest from the diet resulting in elevated SCFA production by the gut microbiota has been demonstrated in ob/ob mice.26 Nevertheless, the role of SCFA is controversial as they are known to stimulate de-novo synthesis of triglycerides in the liver but were also proposed in the prevention of type 2 diabetes.27 In our study, only the concentrations of BCFA were higher in the caecums of RR mice indicating more pronounced protein fermentation, which is commonly associated with a negative health effect.28 Moreover, our results corroborate a recent study indicating a higher faecal concentration of isobutyrate and isovalerate but not SCFA in obese compared to normal weight individuals.29 Finally, the increased de-novo lipogenesis observed in RR mice may be due to the increased levels of blood glucose and insulin. Indeed, these levels are known to activate the transcription factors ChREBP and SREBP, which control the transcription of lipogenic enzyme genes. Therefore, we may postulate that the influence of the gut microbiota on glucose homeostasis may constitute a possible new mechanism explaining the impact of this microbiota on steatosis and NAFLD.
This study, showing the feasibility of transferring a host metabolic phenotype by means of the gut microbiota, further underlines the power of gnotobiotic models to decipher the involvement of the gut microbiota in health and disease. It has recently been demonstrated that human gut microbiota can be transferred to GF mice with remarkable preservation of structure and diversity,30 and previous studies established that specific enzymatic activities of the human gut microbiota can be transmitted to GF rodents on colonisation with a faecal sample.31 ,32 This opens possibilities to transfer gut microbiota from humans with pathologies to GF mice to create humanised gnotobiotic mice and conduct preclinical studies.
In conclusion, our results demonstrate that gut microbiota influences whole body glucose homeostasis and liver lipid metabolism, indicating that the gut microbiota constitutes an environmental factor driving the progression of NAFLD. They support the idea that targeting the gut microbiota could be a new prevention or therapeutic approach for improving type 2 diabetes and NAFLD. Finally, faecal transplants in humans could be envisaged in the future to treat these pathologies, as already applied for Clostridium difficile infections.33
Acknowledgments
The authors would like to thank Martine Bensaada, Anne Foussier, Bénédicte Langelier, Camille Mayeur and Laura Boschat for technical assistance, Alain Joffre for breeding and husbandry of GF mice, Donald White for the English correction.
References
Supplementary materials
Supplementary Data
This web only file has been produced by the BMJ Publishing Group from an electronic file supplied by the author(s) and has not been edited for content.
Files in this Data Supplement:
- Data supplement 1 - Online supplement
- Data supplement 2 - Online figure
Footnotes
-
▸ Additional supplementary files are published online only. To view these files please visit the journal online (http://dx.doi.org/10.1136/gutjnl-2012-303816).
-
Contributors TLR: acquisition of data, analysis and interpretation of data; ML: acquisition of data; ABr: technical support; SR, CB, PM: material support; PL, FW, ABa, GP, AMCD: analysis and interpretation of data; PG: study concept and design, analysis and interpretation of data. TLR and PG: drafted manuscript, which all authors have commented on.
-
Funding This work was supported by the Science Committee Syndifrais/CNIEL and a grant was obtained from CNIEL (Centre National Interprofessionnel de l'Economie Laitière), grant number S2234.
-
Competing interests None.
-
Provenance and peer review Not commissioned; externally peer reviewed.