Article Text

Abstract
Background: The accumulation of reactive oxygen species and subsequent oxidative DNA damage underlie the development of Barrett’s oesophagus (BO) and its progression to Barrett’s dysplasia (BD) and adenocarcinoma (BAC).
Methods: The promoter regions of 23 genes of the glutathione S-transferase (GST) and glutathione peroxidase (GPX) families were systematically analysed. Quantitative bisulfite pyrosequencing, real-time RT-PCR, western blot and immunohistochemical (IHC) analysis methods were utilised in this study.
Results: 14 genes were identified that have CpG islands around their transcription start sites: GSTs (GSTM2–M5, GSTA4, GSTP1, GSTZ1, GSTT2, GSTO1 and GSTO2) and GPXs (GPX1, GPX3, GPX4 and GPX7). Analysis of an initial set of 20 primary samples demonstrated promoter DNA hypermethylation and mRNA downregulation of GPX3, GPX7, GSTM2, GSTM3 and GSTM5 in more than half of the BAC samples. Further analysis of 159 primary human samples (37 normal, 11 BO, 11 BD and 100 BACs) indicated frequent hypermethylation (⩾10% methylation) of GPX3 (62%), GPX7 (67%), GSTM2 (69.1%) and GSTM3 (15%) in BACs. A significant inverse correlation between DNA methylation and mRNA expression level was shown for GPX3 (p<0.001), GPX7 (p = 0.002), GSTM2 (p<0.001) and GSTM5 (p = 0.01). Treatment of oesophageal cancer cell lines with 5-aza-2′-deoxycytidine and trichostatin-A led to reversal of the methylation pattern and re-expression of these genes at the mRNA and protein levels. The IHC analysis of GPX3, GPX7 and GSTM2 on a tissue microarray that contained 75 BACs with normal squamous oesophageal samples demonstrated an absent to weak staining in tumours (52% for GPX3, 57% for GPX7 and 45% for GSTM2) and a moderate to strong immunostaining in normal samples.
Conclusion: Epigenetic inactivation of members of the glutathione pathway can be an important mechanism in Barrett’s tumourigenesis.
Statistics from Altmetric.com
It is generally accepted that oesophageal adenocarcinoma, a cancer with one of the fastest growing incidence rates among all tumours in the Western world, develops from a premalignant lesion of Barrett’s oesophagus (BO).1–3 BO is an acquired condition in which the normal squamous cell epithelium of the oesophagus is replaced by a metaplastic columnar epithelium.4 5 Chronic gastro-oesophageal reflux disease (GORD), with accumulation of reactive oxygen species (ROS) and subsequent oxidative DNA damage, are the main risk factors for the development of BO and its progression to Barrett’s adenocarcinoma (BAC).4 5 Although several molecular changes have been demonstrated in tumour initiation and progression,6–8 the contribution of epigenetic mechanisms in Barrett’s tumourigenesis is not well characterised.
There is increasing evidence demonstrating that oxidative injury due to H2O2 and other endogenous ROS is a major cause of DNA damage that correlates with multiple human diseases including cancer.9–11 Recent studies have shown an increase in the production of mucosal ROS and subsequent oxidative DNA stress in Barrett’s mucosa, suggesting that ROS and subsequent oxidative stress may play an important role in cell damage and the carcinogenesis of BO.12–15 The rat oesophagoduodenal anastomosis model has also provided a strong support for the concept that oxidative DNA damage is an important factor for the development of BO and progression to BAC.16 17
Normal cells can handle the oxidative stress through intact antioxidative systems, among which the glutathione S-transferase superfamily (GST) and glutathione peroxidase (GPX) family members play a crucial role. GSTs constitute a superfamily of ubiquitous, multifunctional enzymes, which play a key role in cellular detoxification, protecting macromolecules from attack of reactive electrophiles.18–20 The GSTs catalyse the conjugation of the tripeptide glutathione to a wide variety of exogenous and endogenous chemicals with electrophilic functional groups (eg products of oxidative stress, environmental pollutants and carcinogens), thereby neutralising their electrophilic sites and rendering the products more water soluble. GPXs catalyse the reduction of H2O2, organic hydroperoxide and lipid peroxides by reduced glutathione, thereby protecting cells against oxidative damage.21–23
DNA methylation plays an important role in the regulation of gene expression. Aberrant DNA methylation, namely overall DNA hypomethylation and regional DNA hypermethylation, has been linked to carcinogenesis of various organs.24–26 Aberrant DNA methylation of CpG islands in the promoter region has been associated with gene silencing of several genes in cancer, such as p16, hMLH1 and CDH1 genes.27–29 Dysfunction of the GSTP1 gene through aberrant DNA methylation has been demonstrated in several human tumours, especially in prostate carcinoma.30 31 These reports suggest that aberrant DNA methylation may be a common and crucial mechanism for the dysfunction of antioxidative members. In this study, we have examined the DNA methylation status of the GST and GPX genes in a systematic fashion using state-of-the-art quantitative bisulfite pyrosequencing technology (Biotage, Uppsala, Sweden) which allows quantification and comparison of the methylation levels of individual CpG sites in a large panel of samples.
MATERIALS AND METHODS
Search for the CpG islands in the promoter DNA regions of the GSTs and GPXs
The DNA sequences around the transcription start sites (from −1000 to +300 bp), that usually contain a promoter region, were obtained from the UCSC (University of California, Santa Cruz) Genome Browser web site (http://genome.ucsc.edu/) and were to be confirmed identical to that from the DBTSS (database of transcriptional start sites, http://dbtss.hgc.jp). The CpG islands were searched using a CpG island searcher online tool (http://www.uscnorris.com/cpgislands2/cpg.aspx). The criteria used for the definition of CpG islands are the regions of DNA >500 bp with a G+C of ⩾55% with an observed CpG/expected CpG of 0.65. Genes with a CpG island in their promoter regions were included in the present study: GSTA4, GSTM1, GSTM2, GSTM3, GSTM4, GSTM5, GSTO1, GSTO2, GSTP1, GSTT1, GSTT2, GSTZ1, GPX1, GPX3, GPX4 and GPX7.
Tissue samples
All tissue samples were obtained from the archives of pathology at Vanderbilt University (Nashville, Tennessee, USA), Otto-von-Guericke University (Magdeburg, Germany) and from the National Cancer Institute Cooperative Human Tissue Network (CHTN). The use of specimens from the tissue repository was approved by the Institutional Review Board protocol numbers 03-1078 and 33-2001. All patients provided a written consent, and samples were collected after surgical resection. All tissue samples that were included in this study were collected from tissues that remained after completion of diagnosis, that are otherwise discarded, and were coded. All personal identifiers were removed prior to receiving samples. For DNA and mRNA analysis, 131 coded frozen tissue samples (91 BACs, 3 BO, 20 normal oesophagus and 17 normal stomach samples) were collected. In addition, 28 paraffin-embedded formalin-fixed tissue samples were obtained from 11 patients: 8 BO without dysplasia, 11 high-grade BD and 9 BACs. The normal oesophagus and stomach samples were taken from tumour-free margins of resected tumours and were histologically normal. Histopathological diagnosis of the BO, BD and BAC was verified on the basis of H&E-stained sections according to the Vienna classification of gastrointestinal epithelial neoplasia.32 All tissue samples were dissected to obtain ⩾70% cell purity. For immunohistochemical (IHC) analysis of protein expression, a tissue microarray containing 93 samples of 75 tumours, 6 BO and 12 normal oesophageal tissues was developed. All adenocarcinomas were classified according to the recent guidelines of the International Union Against Cancer (UICC) TNM classification system. All BACs were originated from the lower oesophagus or gastro-oesophageal junction corresponding to adenocarcinoma of the oesophago-gastric junction type.33 The patients’ ages ranged from 34 to 84 years (median at 65 years). The adenocarcinomas ranged from well differentiated to poorly differentiated, stages I–IV, with a mix of intestinal- and diffuse-type tumours.
Quantitative real-time RT-PCR (qRT-PCR) analyses of GSTs and GPXs
mRNA expression of the GST and GPX family members that contain a CpG island within their promoter (GSTA4, GSTM2, GSTM3, GSTM4, GSTM5, GSTO1, GSTO2, GSTP1, GSTT2, GSTZ1, GPX1, GPX3, GPX4 and GPX7) was first evaluated in an initial set of 20 primary samples (10 tumours and 10 normal samples from the same patients). Following the results, mRNA was examined in 96 frozen primary human samples that included 30 normal mucosae of the oesophagus and the stomach and 66 samples of BAC. These 96 samples were also included in the original 131 frozen samples that were used in the methylation assay below. Total RNA was isolated using the RNeasy mini kit (Qiagen, Valencia, California, USA), and single-stranded cDNA was subsequently synthesised using the Advantage RT-for-PCR Kit (Clontech, Palo Alto, California, USA). The primers were designed using the online software, Primer 3 (http://frodo.wi.mit.edu/cgi-bin/primer3/primer3_www.cgi). The forward and reverse primers were designed to span two different exons. The oligos were obtained from Integrated DNA Technologies (Coralville, Iowa, USA) and the sequences of the oligos are shown in Supplementary table 1. The qRT-PCR was performed using an iCycler (Bio-Rad, Hercules, California, USA), with the threshold cycle number determined by use of iCycler software version 3.0. Reactions were performed in triplicate, and the threshold numbers were averaged. The results of these genes were normalised to HPRT1, which had minimal variation in all normal and tumour samples tested.34 Expression fold was calculated according to the formula 2(Rt–Et)/2(Rn–En),34 where Rt is the threshold cycle number for the reference gene observed in the tumour, Et is the threshold cycle number for the experimental gene observed in the tumour, Rn is the threshold cycle number for the reference gene observed in the normal samples and En is the threshold cycle number for the reference gene observed in the tumour. Rn and En values were calculated as an average of the 30 normal samples. For all the primary BACs, the gene was considered to be downregulated if the mRNA expression fold was ⩽0.5 in comparison with the normal samples.
DNA bisulfite treatment and pyrosequencing analysis
DNA was purified using a DNeasy tissue kit (Qiagen). The bisulfite modification of the DNA from cell lines and frozen tissues was performed using an EZ DNA Methylation-Gold Kit (ZYMO Research, Orange, California, USA), and the DNA from paraffin-embedded formalin-fixed tissues was bisulfite-modified using the CpGenome DNA Modification Kit (Chemicon, Temecula, California, USA), according to the manufacturer’s protocol. A 20 ng aliquot of modified DNA was subjected to PCR amplification of the specific promoter region containing a CpG island, by use of a primer set designed to amplify both methylated and unmethylated sequences of selected genes. The primers were designed using PSQ assay design software (Biotage), where one of the primers was biotin labelled. The primer sequences are provided in Supplementary table 2. The Platinum PCR SuperMix High Fidelity (Invitrogen, Carlsbad, California, USA) was used to prepare the PCR solution. The resultant PCR products were checked by gel electrophoresis to confirm the size of the product and rule out the formation of primer dimers. The specific PCR products were then subjected to quantitative pyrosequencing analysis using a Biotage PyroMark MD system (Biotage) following the protocol provided by the manufacturer. The results were analysed by Pyro Q-CpG 1.0.9 software (Biotage). Based on control normal samples and internal quality controls provided in the software analysis, we used 10% as a cut off for identification of DNA methylation for all of the genes. Statistical analysis was performed to detect significant changes in the frequencies of DNA methylation of CpG sites between tumour and normal samples.
5-Aza-2′-deoxycytidine (5-Aza) and trichostatin-A (TSA) treatment
For validation of the role of DNA methylation in transcriptional regulation in vitro, three oesophageal cancer cell lines (TE7, SKGT4 and OE33) were maintained in Dulbecco’s modified Eagle’s medium (DMEM), supplemented with 10% fetal bovine serum (FBS) and antibiotics (Invitrogen). Cells were seeded at low density for 24 h, and then treated with 2 μM 5-Aza (Sigma-Aldrich, St Louis, Missouri, USA) for 72 h and/or 100 nM TSA (Wako, Osaka, Japan) for 24 h. Total RNA and DNA were isolated and purified by a Qiagen RNeasy kit and DNeasy tissue kit (Qiagen) as described above. DNA methylation levels of specific genes in the samples before and after treatments were determined by pyrosequencing, and mRNA expression levels were determined by qRT-PCR as described above.
Western blotting analysis
Cell lysates from the SKGT4 cancer cell line was obtained following the treatment of cells with dimethylsulfoxide (DMSO) (control), 5-Aza or 5-Aza/TSA as described above. Cell lysates were prepared in phosphate-buffered saline (PBS) containing 1× protease inhibitor cocktail (Pierce, Rockford, Illinois, USA), centrifuged at 3500 rpm for 10 min at 4°C. Protein concentration was measured using a Bio-Rad protein assay (Bio-Rad Laboratories). Protein (15 μg) from each sample was subjected to SDS–PAGE (sodium dodecylsulfate–polyacrylamide gel electrophoresis) and transferred onto a nitrocellulose membrane. Target proteins were detected following standard protocols by using specific antibodies against GPX3 (mouse anti-GPX3 monoclonal antibody, Clone 23B1, Abcam, Cambridge, Massachusetts, USA), GPX7 (mouse anti-GPX7 monoclonal antibody, Clone 2704, GeneTeX, San Antonio, Texas, USA), GSTM2 (goat anti-GSTM2/M1 polyclonal antibody, Imagenex, San Diego, California, USA), and β-actin (rabbit anti-β-actin, clone 13E5, Cell Signaling, Beverly, Massachusetts, USA).
IHC analysis
For IHC analysis of protein expression, a tissue microarray containing 93 samples that included 75 tumours, 6 BO and 12 normal oesophageal tissues was developed. All tissue samples were histologically verified, and representative regions were selected for inclusion in the tissue microarray. All of the adenocarcinoma samples were collected from either the gastro-oesophageal junction or the lower oesophagus, and ranged from well differentiated to poorly differentiated, stages I–IV, with a mix of intestinal- and diffuse-type tumours. Tissue cores with a diameter of 0.5 mm were retrieved from the selected regions of the donor blocks and punched to the recipient block using a manual tissue array instrument (Beecher Instruments, Silver Spring, Maryland, USA). Each tissue sample was represented by four tissue cores on the tissue microarray. Sections (5 μm) were transferred to polylysine-coated slides (SuperFrostPlus, Menzel-Gläser, Braunschweig, Germany) and incubated at 37°C for 2 h. The resulting microarray was used for IHC analysis utilising antibodies against GPX3 (mouse anti-GPX3 monoclonal antibody, Clone 23B1, 1:100, Abcam), GPX7 (mouse anti-GPX7 monoclonal antibody, Clone 2704, 1:500, GeneTeX) and GSTM2 (goat anti-GSTM2/M1 polyclonal antibody,1:200, Imagenex). De-waxing and rehydration by descending concentrations of ethanol was followed by antigen retrieval (20 min in a microwave, 450 W, 10 mM EDTA, pH 8.0). Blocking was performed with 10% goat serum in PBS for 5 min. All sections were incubated overnight with the above primary antibodies, followed by washing in PBS and incubation with anti-goat or anti-mouse secondary antibody for 1 h at room temperature, and then washed in PBS. The Vectastain ABC-AP KIT (vector; Alexis, Gruenberg, Germany) was used as the chromogen substrate, and the specimens were counterstained with haematoxylin. The specificity of immunostaining was checked by omitting a single step in the protocol and replacing the primary antibody with non-immune serum. The protein expression level was estimated semi-quantitatively.35 Cores with torn tissues were excluded from the analyses. Tissues with no evidence of staining, or only rare scattered positive cells, <3%, were recorded as negative. The IHC results were evaluated for intensity and frequency of staining. The intensity of staining was graded as 0 (negative), 1 (weak), 2 (moderate) and 3 (strong). The frequency was graded from 0 to 4 by the percentage of positive cells as follows: grade 0, <3%; grade 1, 3–25%; grade 2, 25–50%; grade 3, 50–75%; grade 4, >75%. The index score was the product of multiplication of the intensity and frequency grades, which was then classified into a 4-point scale: index score 0 = product of 0, index score 1 = products 1 and 2, index score 2 = products 3 and 4, index score 3 = products 6–12.
Statistical analysis
The Wilcoxon rank sum test was used: (1) to compare the DNA methylation level between normal, BO, BD and BACs; (2) to compare the mRNA expression fold between normal and tumour samples and between unmethylated and methylated BACs; and (3) to analyse the association between DNA methylation and the clinicopathological factors. The correlations between DNA methylation level and mRNA expression fold, and between methylation level and age were determined by Spearman correlation. The comparison of IHC scores among normal, BO, BD and BACs and association between IHC score and clinicopathological factors were carried out by χ2 test or Fisher exact test. All p values were based on two-sided tests, and differences were considered statistically significant when the p value was ⩽0.05.
RESULTS
Identification of CpG islands in the promoters of GST and GPX family members
Analysis of the promoter regions of GST and GPX members indicated the presence of CpG islands within –1000 to +300 bp, relative to the transcription start site, in 16 genes; GSTA4, GSTM1, GSTM2, GSTM3, GSTM4, GSTM5, GSTO1, GSTO2, GSTP1, GSTT1, GSTT2, GSTZ1, GPX1, GPX3, GPX4 and GPX7. The essential information about the GSTs and GPXs is summarised in table 1. GSTM1 and GSTT1, which have a null-type polymorphism in nearly 50% of healthy populations,36 were excluded from this study. The remaining 14 genes with CpG islands were analysed by qRT-PCR and quantitative bisulfite pyrosequencing analysis of promoter DNA methylation.
Frequent methylation of promoter DNA of GSTs and GPXs in BACs
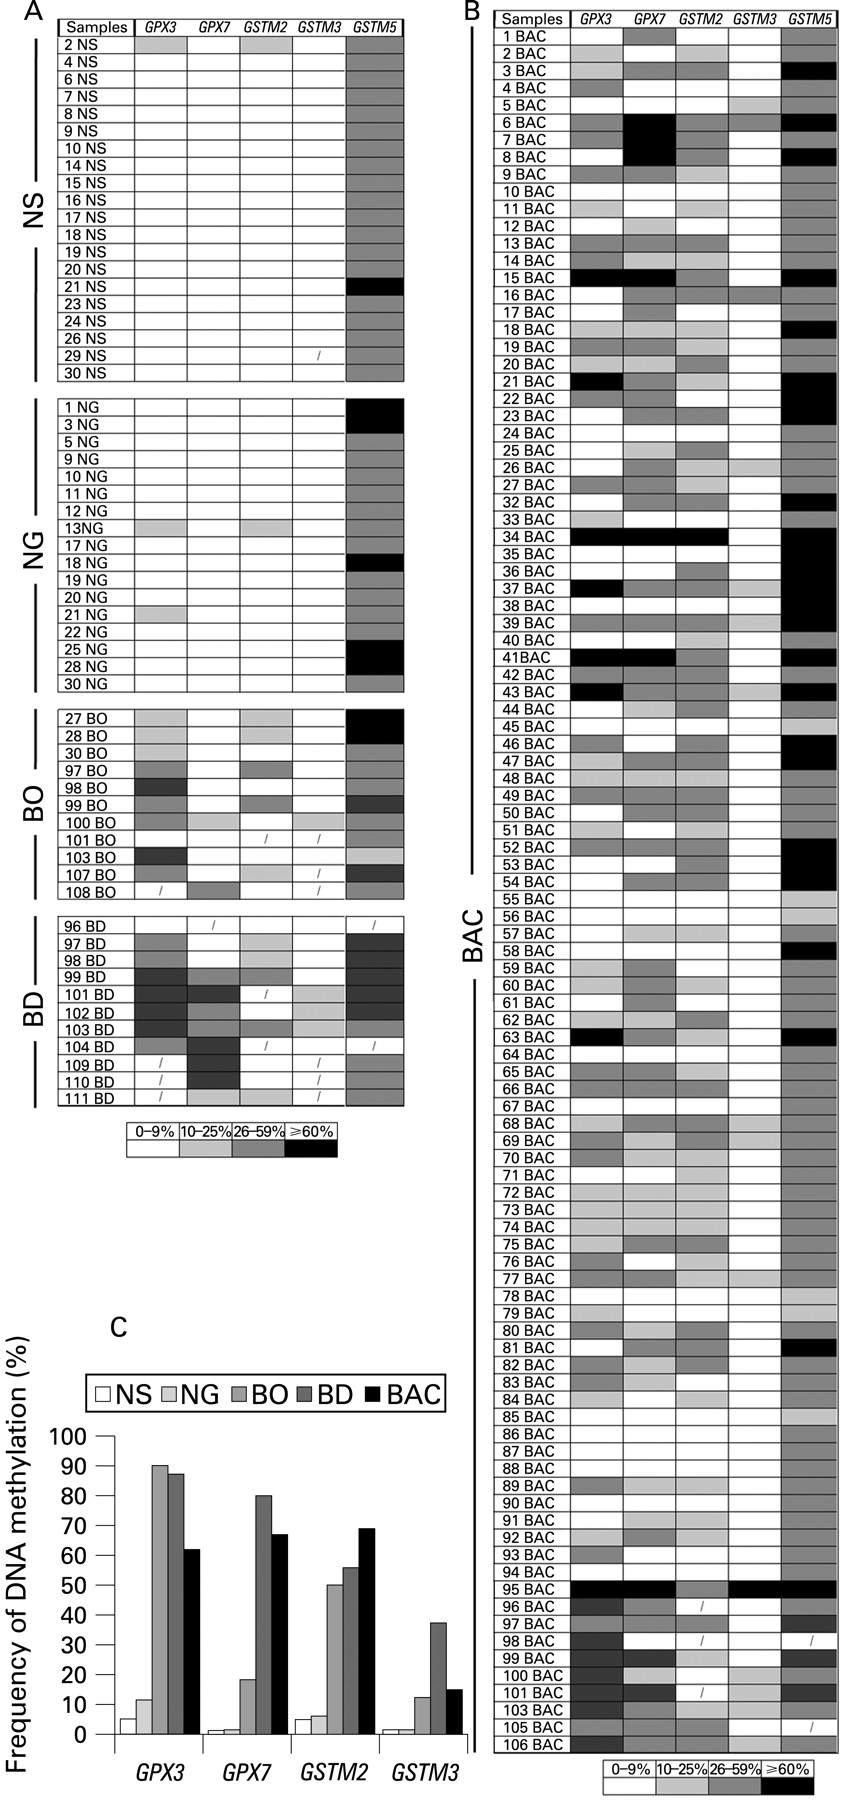
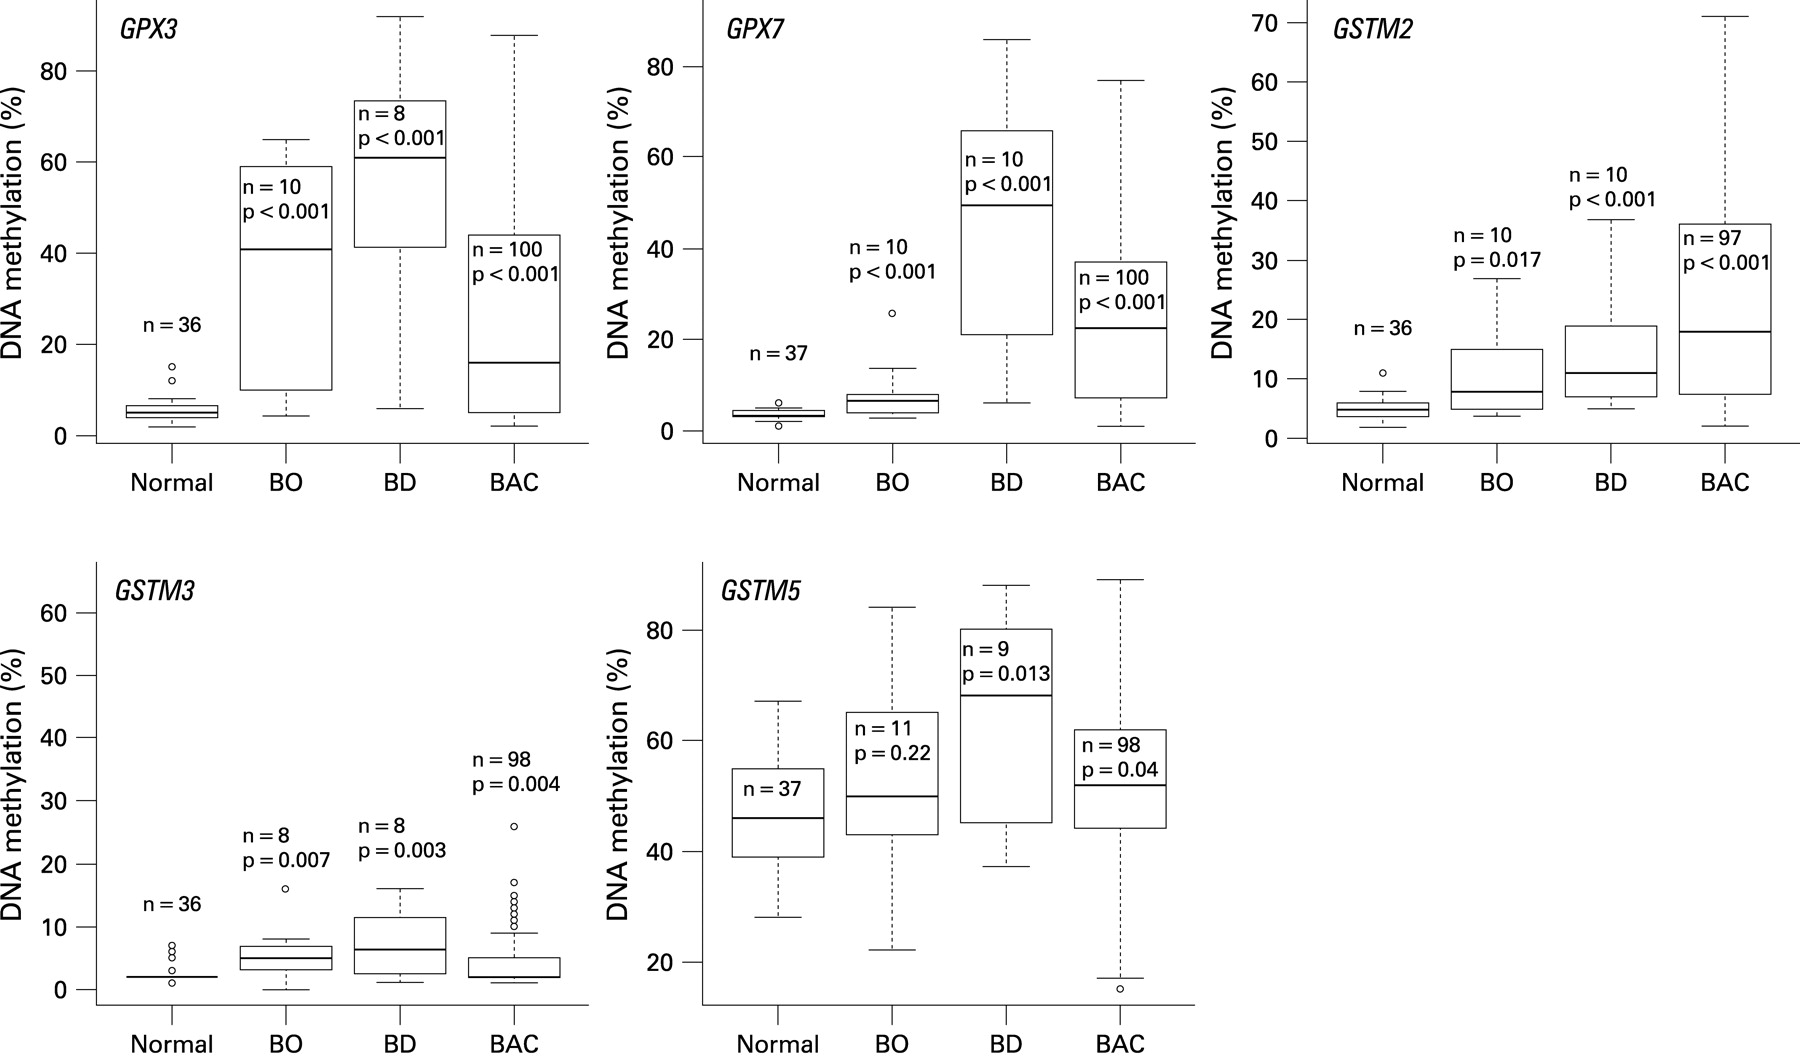
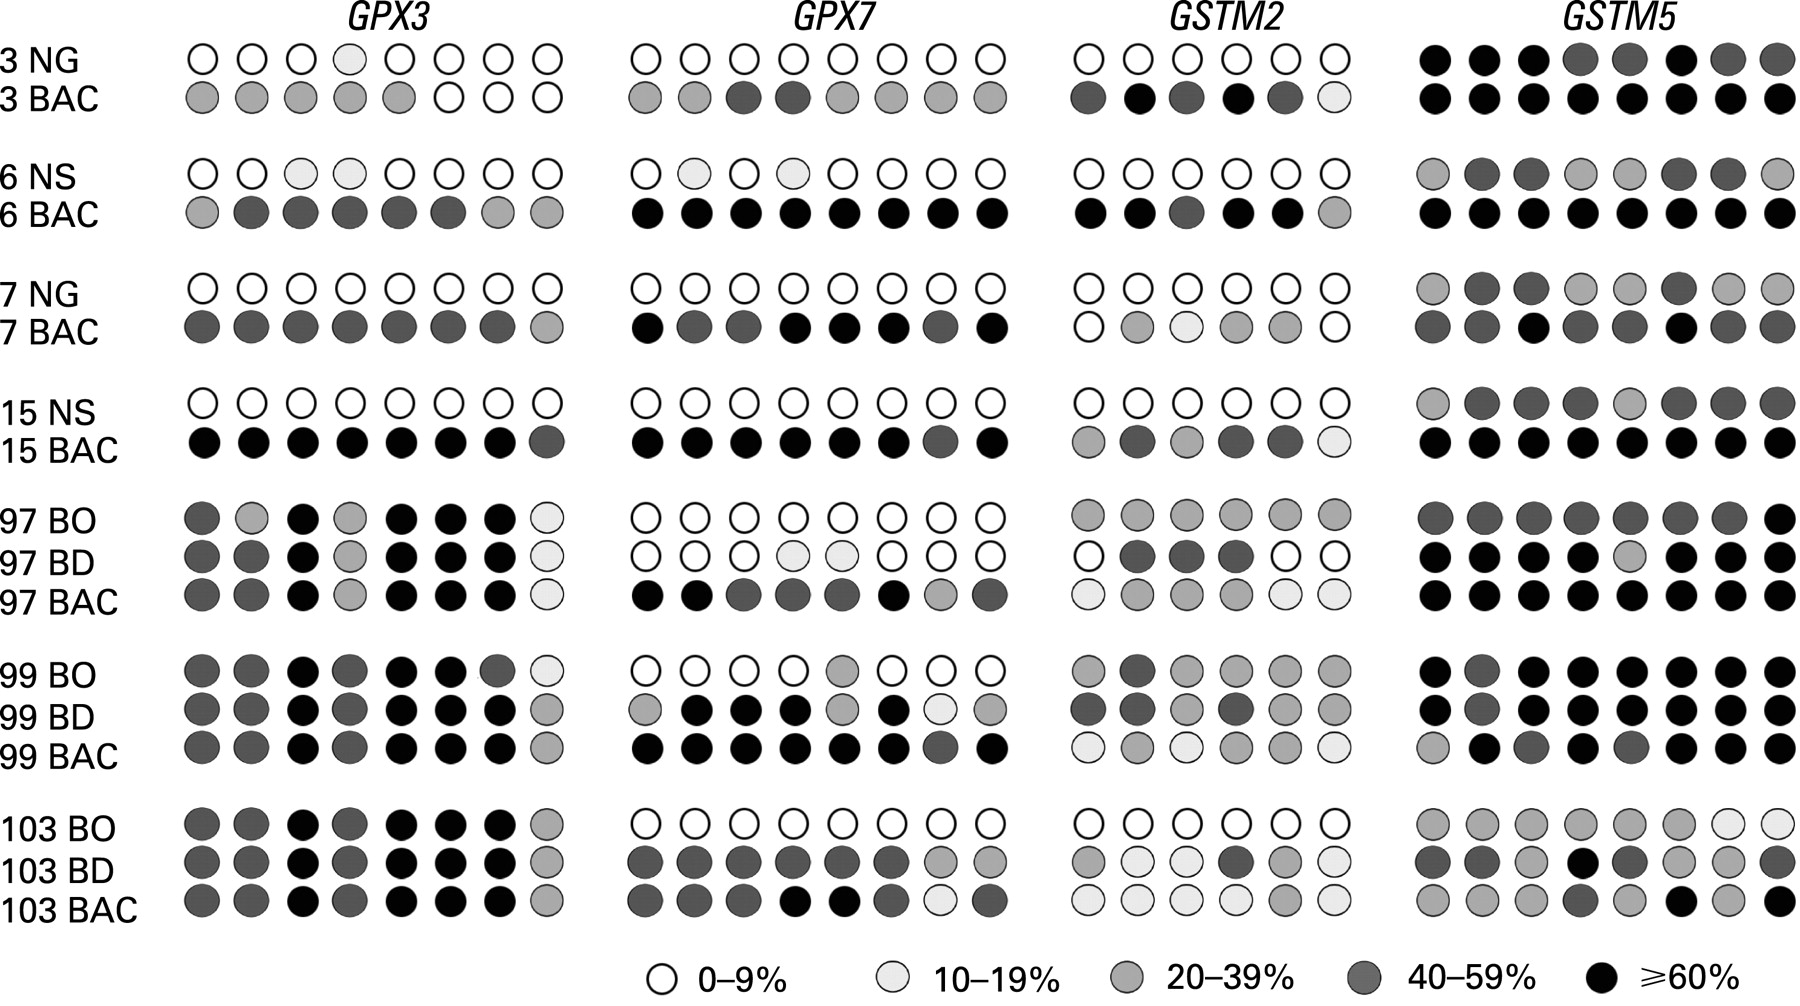
Gene expression and DNA methylation levels were investigated for 14 genes (GSTA4, GSTM2, GSTM3, GSTM4, GSTM5, GSTO1, GSTO2, GSTP1, GSTT2, GSTZ1, GPX1, GPX3, GPX4 and GPX7) using an initial set of 20 primary samples, 10 tumours with matched normal samples from the same patients (table 2). The GSTO2 gene was not expressed in any normal or tumour sample, suggesting that the expression of this gene is possibly tissue specific. In addition, we did not detect a significant downregulation of GSTO1, GPX1 and GPX4 in tumour samples as compared with normal samples. These four genes were therefore excluded from further analysis. We continued our analysis of DNA methylation for the remaining 10 genes using quantitative bisulfite pyrosequencing technology on a subset of 77 primary samples (40 tumours, 37 normals). A schematic diagram showing the CpG sites of the promoter regions of these 10 genes and the pyrosequencing assays is given in Supplementary fig 1. We observed a low frequency of DNA methylation (<10% of tumours) for GSTA4, GSTM4, GSTZ1, GSTT2 and GSTP1 (Supplementary fig 2). These results suggested that DNA methylation of these five genes is not a feature of BACs. Therefore, further analysis of these five genes was discontinued. We proceeded with our analysis for the remaining five genes (GPX3, GPX7, GSTM2, GSTM3 and GSTM5) on 159 primary samples (100 primary BAC samples, 11 BO, 11 BD, 20 normal oesophageal mucosae and 17 normal gastric mucosae samples). A schematic diagram showing the methylation profile of each sample for GPX3, GPX7, GSTM2, GSTM3 and GSTM5 is given in fig 1. We detected absent to low methylation (0–9% methylation level) in normal samples and frequent hypermethylation (⩾10% methylation level) in tumour samples for GPX3 (62%, p<0.001), GPX7 (67%, p<0.001), GSTM2 (69.1%, p<0.001) and GSTM3 (15%, p = 0.004) (figs 1C and 2). Interestingly, the average DNA methylation level for GSTM5 in normal samples was 25–50%; however, the methylation levels were significantly higher in tumour samples where 29 samples (30%) showed ⩾60% methylation levels (p = 0.04) (figs 1 and 2). We detected significantly higher levels of DNA methylation in premalignant BO and BD samples as compared with normal samples for GPX3, GPX7, GSTM2 and GSTM3 (p<0.01) (fig 2). These samples included 21 pairs of normal and tumour samples that included six matched samples of tumour, BO and/or BD samples from the same patients. A representative summary of quantitative DNA methylation analysis of individual CpG sites in matched samples is illustrated in fig 3.
DNA methylation of GSTs and GPXs correlated with reduced gene expression
In order to determine the role of DNA methylation in regulating the expression of GSTs and GPXs, mRNA was available from 96 samples (66 BACs and 30 normal samples) of the 159 samples that were evaluated for DNA methylation. Using ⩽0.5-fold as a cut-off threshold for gene downregulation, we detected frequent and significant downregulation of GPX3 (58/66, 89.2%, p<0.001), GPX7 (40/66, 60.6%, p = 0.042) and GSTM2 (55/66, 83.3%, p<0.001) (fig 4A) in BACs in comparison with normal samples. Because of the high methylation level of GSTM5 in normal samples, we analysed its mRNA expression in only 21 cases where we have matched tumour and normal samples from the same patients. GSTM5 mRNA expression was significantly downregulated in tumour samples, as compared with normal samples (15/21, 71.4%, p = 0.019) (fig 4A).
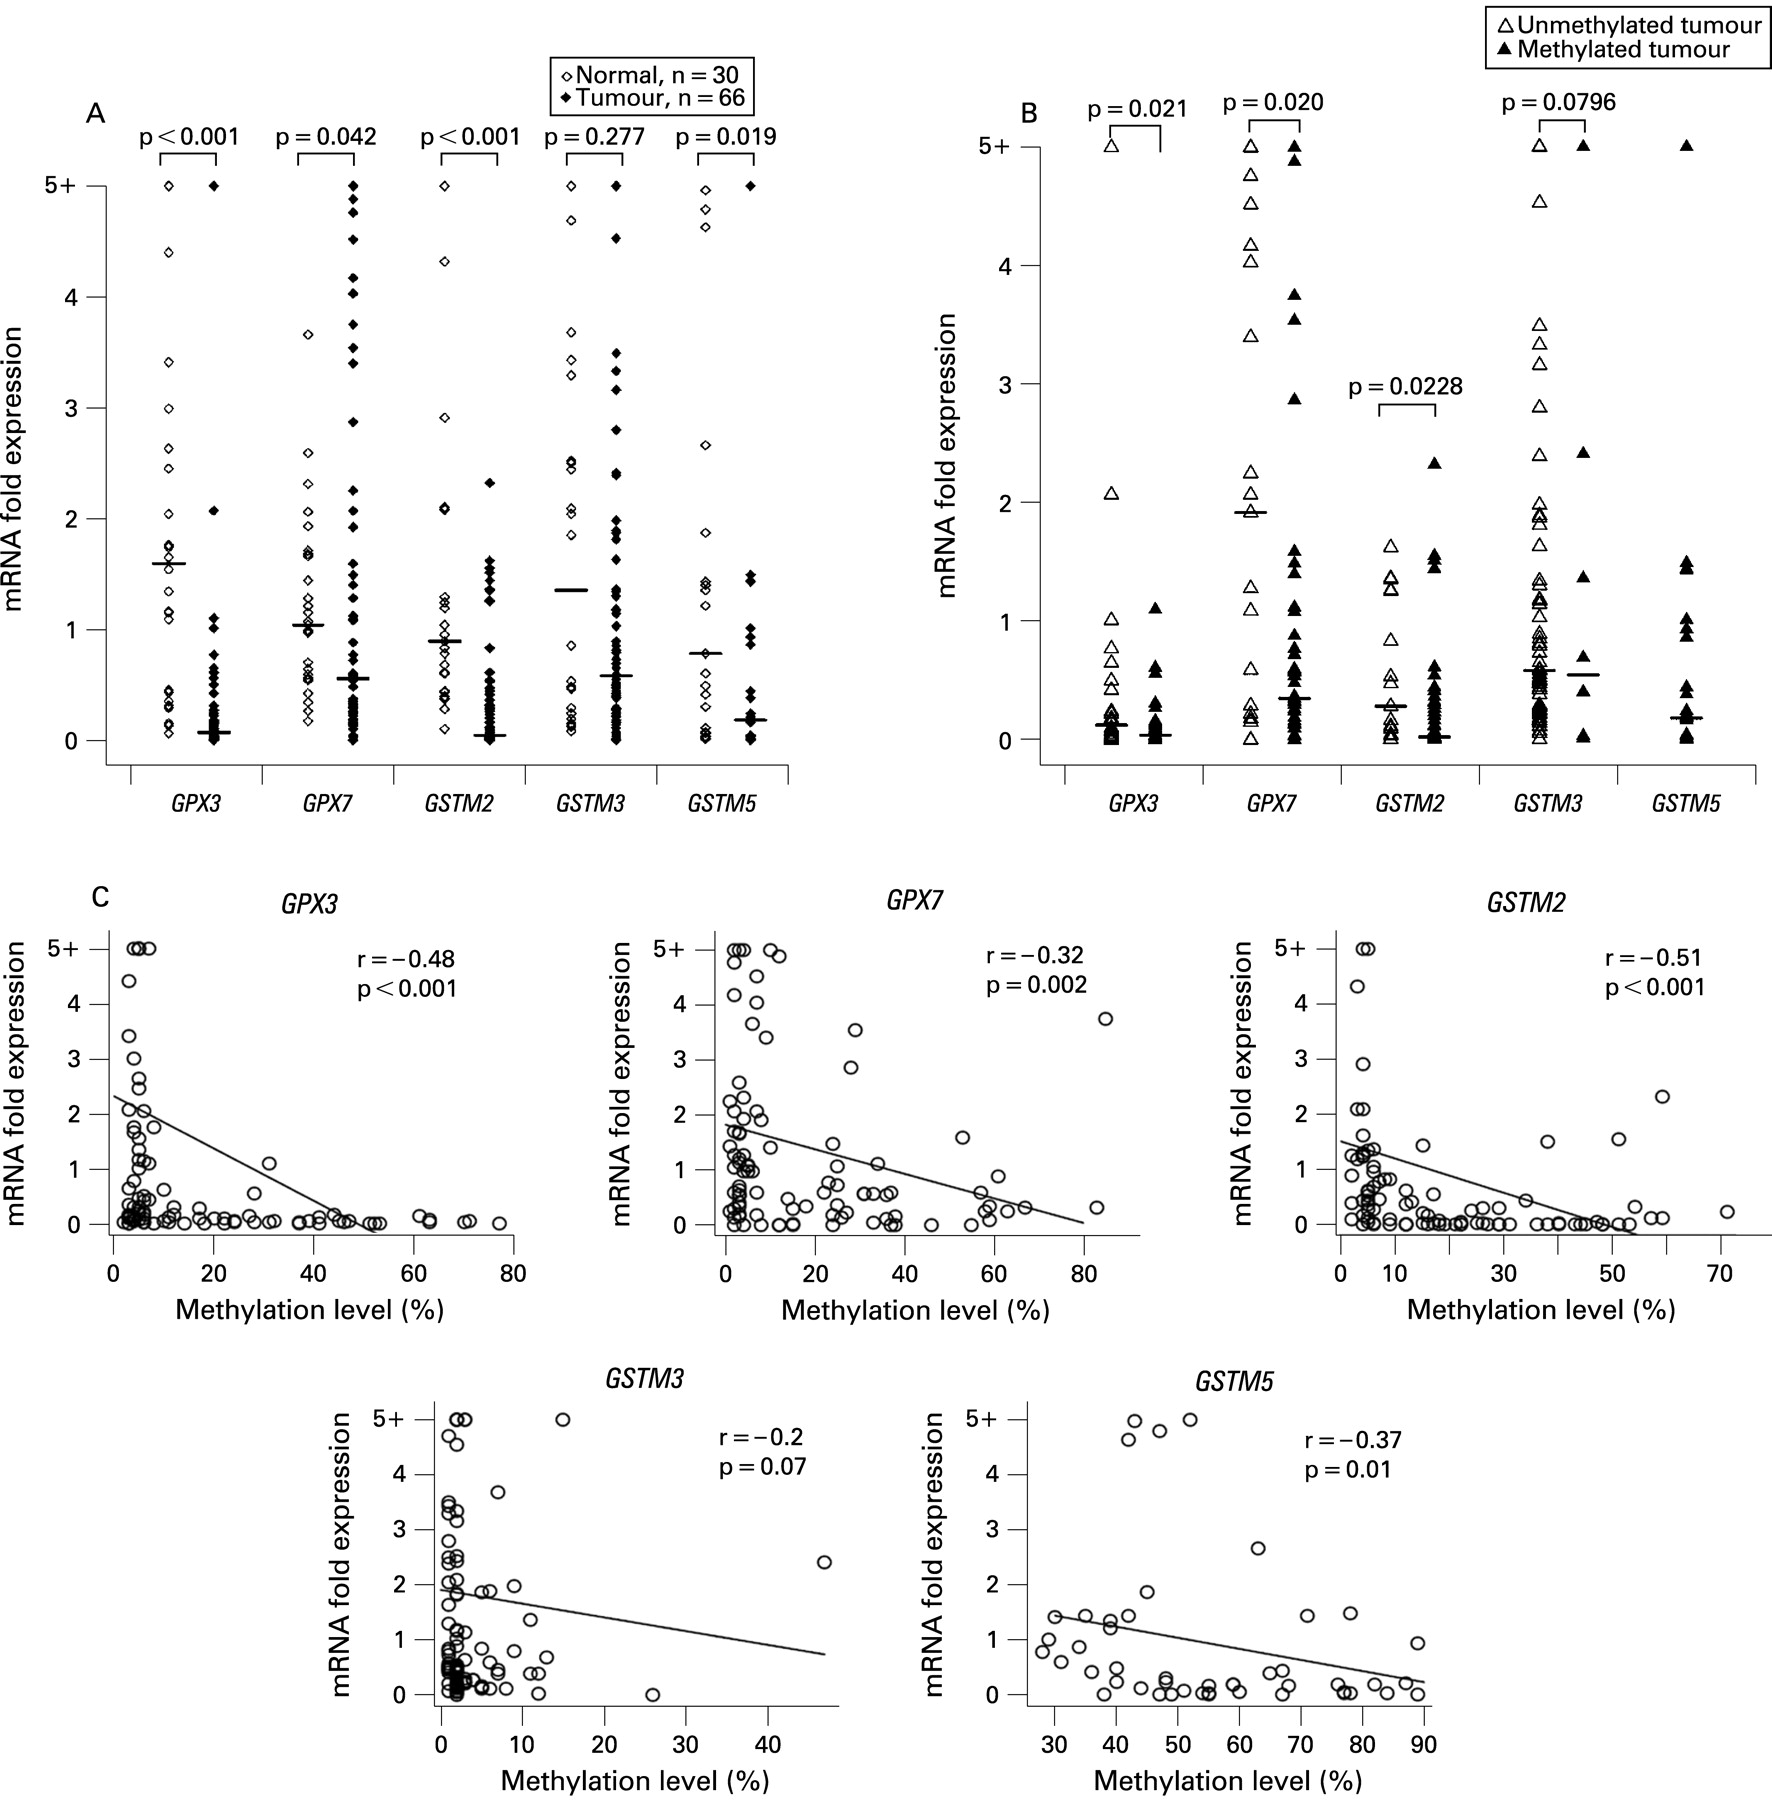
We further analysed the promoter DNA methylation against mRNA expression levels in BACs and found that tumours with hypermethylation (⩾10%) had significant downregulation for GPX3 (p = 0.021), GPX7 (p = 0.02) and GSTM2 (p = 0.0228) as compared with tumours with an absent to low promoter DNA methylation level (0–9%) (fig 4B). The Spearman correlation analysis of all 96 samples that were analysed for promoter DNA methylation and mRNA expression demonstrated a significant inverse correlation between the promoter DNA methylation level and gene expression fold for GPX3 (r = −0.48, p<0.0001), GPX7 (r = −0.32, p = 0.002), GSTM2 (r = −0.51, p<0.0001) and GSTM5 (r = −0.37, p = 0.01) and a correlation trend for GSTM3 (r = −0.2, p = 0.07) (fig 4C). The statistical analysis did not identify any significant correlation between the promoter DNA methylation level or gene expression fold and clinical (age, sex, survival) or histopathological (histological subtype, tumour grade, TNM staging) parameters. This finding may be explained by the early onset of these changes during Barrett’s tumourigenesis, irrespective of these parameters, which is partially supported by the presence of these changes in premalignant lesions as shown in fig 1.
Treatment with 5-Aza restores gene expression in cell lines
As shown in fig 5, the 5-Aza treatment restored gene expression for GSTM2, GSTM3, GSTM5, GPX3 and GPX7 in the methylated cell lines, and this restoration of gene expression was associated with promoter DNA demethylation. In addition, TSA treatment alone was effective in restoring the gene expression of GSTM2 in SKGT4 and OE33 (fig 5), suggesting that histone modifications may also be involved in regulating the expression of GSTM2. TSA treatment alone did not change the methylation levels. However, administration of TSA following 5-Aza had an additive effect in restoring gene expression. Furthermore, TSA treatment following the 5-Aza led to a further decrease in the methylation level of hypermethylated genes with mRNA re-expression. These results are in agreement with recent studies that suggested that TSA can have a demethylation effect in a gene-specific manner.37 38 The western blot analysis using the SKGT4 cancer cell line, as a model, confirmed the upregulation of GPX3, GPX7 and GSTM2 proteins following the 5-Aza and 5-Aza/TSA treatments (fig 6).


Downregulation of protein expression of GPX3, GPX7 and GSTM2 in primary BACs
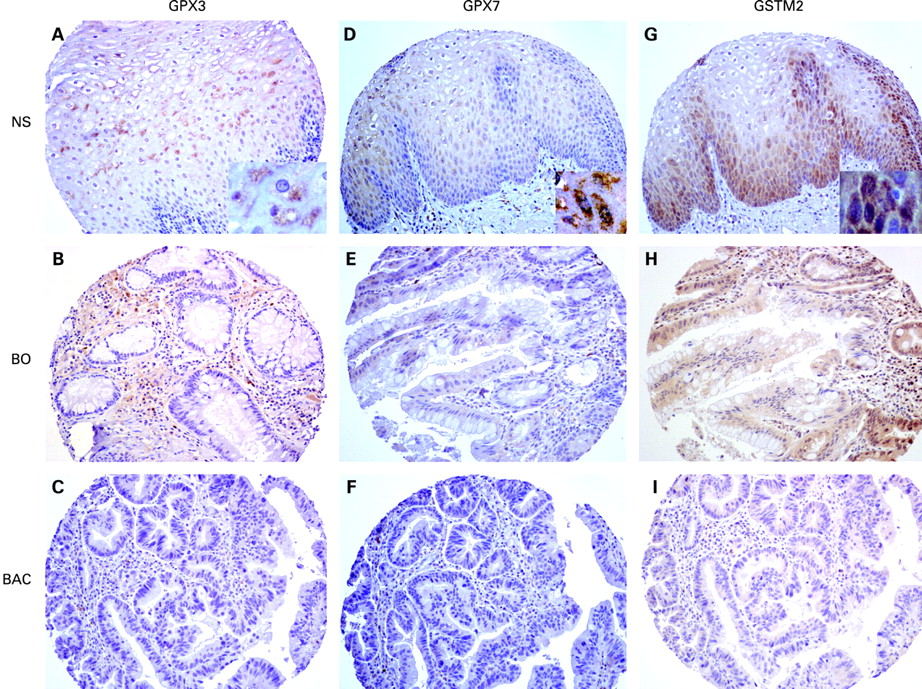
The aforementioned data have strongly indicated the frequent and significant promoter DNA hypermethylation and mRNA downregulation of GPX3, GPX7 and GSTM2 in BACs. Because protein expression is the ultimate mediator of the biological processes, we followed on our findings by using IHC in primary tumour samples. The IHC analysis demonstrated a moderate to strong immunostaining (scores 2 and 3) of these proteins in normal oesophageal samples. On the other hand, we observed absent to weak immunostaining (scores 0 and 1) in BACs (52% for GPX3, 57% for GPX7 and 45% for GSTM2). The details are shown in table 3 and fig 7. We could not find any significant statistical correlation between IHC results and clinical or histopathological parameters.
DISCUSSION
Chronic GORD is the main risk factor for the development of BO and its progression to BAC.4 5 Elevated levels of mucosal ROS have been reported in Barrett’s mucosa, suggesting that ROS and subsequent oxidative stress may play an important role in cell damage and carcinogenesis of BO.12–14 Failure to correct the exogenous and endogenous oxidative stresses such as ROS can occur if the oxidative stress exceeds a defendable level or due to a dysfunction of the cellular antioxidative system. In this case, the accumulation of ROS will produce oxidative DNA damage that plays an important role in DNA mutagenesis and cell death.9–11 Normal cells with an intact antioxidative system with expression of the GST and GPX family members can deal with the oxidative stress and prevent cells from further oxidative damage.
The aberrant DNA hypermethylation of gene promoter regions is an important epigenetic mechanism that regulates gene expression, leading to downregulation and silencing of several tumour suppressor genes such as p16, APC and MGMT.6 39 40 Several recent reports have demonstrated a link between inflammation and the epigenetic inactivation of genes.41 42 Aberrant DNA methylation of several tumour-related genes has been reported in cancer-related inflammatory diseases such as gastritis,43 chronic colitis44 and chronic pancreatitis.45 It is, therefore, plausible to hypothesise that the persistent inflammation associated with chronic GORD may lead to a field defect where DNA methylation and silencing of expression of several genes that regulate the oxidative DNA damage could occur. This process can trigger the carcinogenesis cascade by allowing a cumulative increase in the mutation load in the cell and leading to progression towards cancer.
In this study, we applied a systematic approach and investigated the role of DNA methylation as an epigenetic mechanism regulating the levels of gene expression of members of the GSTs and GPXs. We have implemented a state-of-the-art quantitative bisulfite pyrosequencing technology (Biotage, Sweden) for the analysis of DNA methylation levels of individual CpG sites and combined this approach with qRT-PCR for the evaluation of mRNA gene expression. We identified a subset of genes that contain promoter CpG islands. Interestingly, we detected frequent downregulation and promoter DNA hypermethylation of GPX3, GPX7, GSTM2, GSTM3 and GSTM5 in BACs, as compared with normal samples. A significant increase in DNA methylation of GPX3, GPX7, GSTM2 and GSTM3 was also detected in BO and BD as compared with normal samples, suggesting that DNA hypermethylation of these genes may be an early event in the Barrett’s oesophagus–dysplasia–adenocarcinoma sequence.
GPXs are a major antioxidative damage enzyme family that catalyses the reduction of hydrogen peroxide, organic hydroperoxide and lipid peroxides by reduced glutathione.21–23 We observed frequent and significant promoter DNA hypermethylation of two members of the GPX family in BACs; GPX3 and GPX7. The DNA methylation levels of GPX3 and GPX7 had a significant inverse correlation with mRNA expression. The IHC analysis on tissue microarray confirmed the downregulation of GPX3 and GPX7 in more than half of the tumours, providing additional confirmation of the dysfunction of these genes in BACs. Based on the known functions of GPXs, it is likely that GPX3 and GPX7 could play an important role in neutralising the damaging effect of ROS in chronic GORD. In addition, GPX3 has recently been shown to be a potential tumour suppressor gene in prostate carcinoma.46 Whether GPX3 and GPX7 may have tumour suppressor functions in BACs remain to be elucidated in further studies.
The Mu-class of GST subfamily is encoded by a 100 kb gene cluster at 1p13.3 arranged as 5′-GSTM4-GSTM2-GSTM1-GSTM5-GSTM3-3′.36 These genes share >60–80% amino acid sequence identity. However, based on this study, the promoter methylation revealed unique patterns among these genes. While no DNA methylation was observed in the GSTM4 promoter, we detected variable levels of DNA methylation in GSTM2, GSTM3 and GSTM5 in BACs. Analysis of GSTM2 demonstrated a frequent hypermethylation of its promoter DNA with a significant inverse correlation with mRNA expression level. The IHC analysis demonstrated moderate to strong immunostaining in normal oesophageal samples, with absent to low intensity in approximately half of the BACs. GSTM2 has been shown to protect cells from oxidative stress in various animal models and human cells.47–49 Although downregulation of GSTM3 mRNA expression was detected in about 50% of BACs, the overall expression level in tumours did not reach statistical significance in comparison with that in normal samples (p = 0.277, fig 4A). DNA hypermethylation was observed in a few tumours (fig 4B), suggesting the involvement of other genetic and/or epigenetic mechanisms in its transcription regulation in Barrett’s carcinogenesis. The mutated GSTM3 gene has been linked to an increased susceptibility for the development of bladder cancer.50 The mutations and allelic loss of GSTM3 can lead to lack of detoxification by glutathione conjugation and predispose to bladder cancer.50 Interestingly, we observed DNA methylation of GSTM5 in normal samples. However, the methylation levels were significantly higher in BACs than that in normal samples (p = 0.04). In matched tumour and normal samples, we found that GSTM5 expression had a significant inverse correlation with DNA methylation levels (p = 0.01). Therefore, the high levels of DNA methylation in normal samples could reflect a tissue-specific cellular mechanism for regulating its levels in normal oesophageal mucosa. Nevertheless, our findings indicate that DNA hypermethylation of tumour samples plays a role in regulating GSTM5 mRNA expression and is possibly involved in Barrett’s carcinogenesis. The possible role of GSTM5 in the development of cancer remains to be explored.
We have confirmed our results and have shown that the 5-Aza treatment demethylated the DNA as compared with the DMSO-treated control cells and restored the expression of GPX3, GPX7, GSTM2, GSTM3 and GSTM5. While the TSA treatment alone did not have any demethylation effect, it restored the expression of GSTM2. On the other hand, combined treatment of TSA following 5-Aza showed a possible synergistic effect and restored the expression of the downregulated genes at higher levels. This finding confirms the epigenetic regulation of these genes and supports earlier reports that a combination of 5-Aza and TSA can have synergistic effects in the reactivation of epigenetically silenced tumour suppressor genes.51 Interestingly, we observed that TSA administration following 5-Aza treatment led to further DNA demethylation of hypermethylated genes in these cell lines. These results are in agreement with recent studies that suggested that TSA can have a demethylation effect in a gene-specific manner.37 38 This effect could be mediated by downregulation of DNA methyltransferase 3b (DNMT3b)52 or DNMT1.53 However, the detailed mechanism by which TSA increases the demethylation effect of 5-Aza remains unclear and requires further investigation.
In conclusion, this study demonstrates the importance of promoter DNA hypermethylation in regulating gene expression of several members of the Mu-class GSTs and GPXs. The epigenetic inactivation of members of the glutathione pathway can be an important mechanism in the development of BAC.
Acknowledgments
We thank Dr Christopher C Moskaluk at the Department of Pathology, University of Virginia for his excellent assistance in the preparation of this manuscript. This study was supported by the National Cancer Institute Grant CA106176 (WER). The contents of this work are solely the responsibility of the authors and do not necessarily represent the official views of the National Cancer Institute or University of Vanderbilt.
REFERENCES
Supplementary materials
web only appendices 58/1/5
Files in this Data Supplement:
Footnotes
Competing interests: None.
Ethics approval: The use of specimens from the tissue repository was approved by the Institutional Review Board protocol numbers 03-1078 and 33-2001.
Patient consent: Obtained.