Article Text

Abstract
Background: It is well established that the wheat protein gliadin triggers inflammation in coeliac patients. However, the potential toxicity of avenin, the equivalent protein in oats, is debated.
Aim: To investigate the immunogenicity of avenin using the cytokines interferon γ (IFN-γ) and interleukin (IL)-2 as markers of immunological activity.
Methods: Duodenal biopsies from coeliac patients were cultured with 5 mg/ml of peptic tryptic (PT) gliadin (n=9) or 5 mg/ml of PT avenin (n=8) for four hours. Biopsies cultured with RPMI 1640 alone served as controls. Non-coeliac biopsies were also cultured with PT gliadin (n=8) and PT avenin (n=8). Total RNA was extracted from the tissue after culture. Cytokine mRNA was quantified by TaqMan polymerase chain reaction. Secreted cytokine protein was measured in the culture supernatant by enzyme linked immunosorbent assay.
Results: After culture with PT gliadin, an increase in IFN-γ mRNA was observed in all nine patients with coeliac disease. Increased IFN-γ protein was also found in four of these patients. Smaller increases in IL-2 mRNA were detected in six subjects with increased IL-2 protein found in two patients. In contrast with PT gliadin, there was no significant IFN-γ or IL-2 response when coeliac biopsies were cultured with PT avenin. Similarly, biopsies from normal controls did not respond to PT gliadin or PT avenin stimulation.
Conclusions: The findings of this study suggest that the immunogenic sequences in gliadin are not present in avenin. Moreover, they are in keeping with in vivo studies which report that oats are safe for consumption by coeliac patients.
- coeliac disease
- avenin
- organ culture
- interferon γ
- interleukin 2
- IFN-γ, interferon γ
- IL, interleukin
- PT, peptic tryptic
- PCR, polymerase chain reaction
- ELISA, enzyme linked immunosorbent assay
- IEL, intraepithelial lymphocyte
- cDNA, complementary DNA
- GAPDH, glyceraldehyde-3-phosphate dehydrogenase
- Tm, melting temperature
- PBMC, peripheral blood mononuclear cell
- EMA, endomysial antibody
- ICAM, intercellular adhesion molecule
- RT, room temperature (≈20°C)
- RP-HPLC, reversed phase-high performance liquid chromatography
Statistics from Altmetric.com
- IFN-γ, interferon γ
- IL, interleukin
- PT, peptic tryptic
- PCR, polymerase chain reaction
- ELISA, enzyme linked immunosorbent assay
- IEL, intraepithelial lymphocyte
- cDNA, complementary DNA
- GAPDH, glyceraldehyde-3-phosphate dehydrogenase
- Tm, melting temperature
- PBMC, peripheral blood mononuclear cell
- EMA, endomysial antibody
- ICAM, intercellular adhesion molecule
- RT, room temperature (≈20°C)
- RP-HPLC, reversed phase-high performance liquid chromatography
Coeliac disease is an inflammatory disorder of the small intestine, precipitated in genetically susceptible individuals by gluten. In addition to the gliadin fraction of wheat gluten, similar alcohol soluble fractions of barley and rye (hordein and secalin, respectively) are thought to activate the disease process. Consequently, coeliac patients are advised to avoid these cereals in their diet.
The need to avoid oats in the gluten free diet is more controversial. Early reports suggested that oats ingestion increased faecal fat excretion1,2 and that oats challenge resulted in reduced d-xylose excretion.3 However, other studies found that moderate amounts of oats did not alter fat excretion4 or damage the coeliac small intestinal mucosa.5 All of these studies were based on small numbers of patients and the duration of oats challenge was brief. Oats samples were not tested for contaminations with wheat, rye, or barley.
In the past seven years the issue of oats toxicity in coeliac disease has been re-evaluated: the new studies were more comprehensive and large numbers of adult6,7 or paediatric8 coeliac patients were challenged with oats. It was reported that oats were well tolerated clinically, and did not cause histological damage6–9 or induce cellular or humoral immune responses.7,8,10 A long term study found that patients could tolerate oats in their diet for five years without any adverse effects.11 Similar findings were made in patients with dermatitis herpetiformis, a further gluten sensitive disorder.12,13
Despite good clinical evidence that oats is well tolerated by coeliac patients, inclusion of oats in the gluten free diet is still debated. A recent in vitro study found that culture with avenin did not induce endomysial antibody (EMA) production in coeliac biopsies.14 However, an earlier study reported that avenin activated a T cell immune response in cultured jejunal biopsies.15 It has been suggested that the apparent safety of oats is explained by the low content of avenin (alcohol soluble fraction) in oats.
The purpose of the present study was to investigate the immunogenicity of oats avenin in comparison with wheat gliadin when added to duodenal biopsies in four hour organ culture experiments. Interferon γ (IFN-γ) and interleukin (IL)-2 cytokine events were measured as objective evidence of T cell activation.16 Cytokine mRNA was quantified by TaqMan polymerase chain reaction (PCR), an accurate method of detecting mRNA even when expressed at low levels. Cytokine protein was measured by enzyme linked immunosorbent assay (ELISA).
METHODS
Production of gliadin and avenin
Kernels of the German wheat cultivar Rektor were milled to flour with an ash content of 0.55% using a laboratory mill (Brabender Quadrumat Junior). Oats flour was provided by Kölln Flockenwerke (Elmshorn, Germany); PCR analysis17 revealed that the flour was free from wheat contamination. Both flours were defatted with light petroleum (boiling range 40–60°C) and air dried. The defatted flours (50 g) were extracted stepwise three times with 200 ml of a salt solution (0.4 mol/l NaCl+0.067 mol/l NaK phosphate, pH 7.6) and three times with 200 ml 60% (v/v) aqueous ethanol using an Ultra Turrax homogeniser for five minutes at room temperature (RT, ≈20°C). The suspensions were centrifuged for 15 minutes at RT and 40 000 g. The supernatants of the three ethanol extracts were combined, concentrated to about 200 ml using a vacuum evaporator at 40°C, dialysed against 0.01 mol/l acetic acid until free from chloride, and freeze dried.
Peptic tryptic digestion
The stepwise enzymatic hydrolysis of gliadin and avenin was performed with pepsin (Sigma P3286) and trypsin (Sigma T1763), both attached to agarose, according to Bolte and colleagues.18 In preliminary experiments different ratios of proteins (gliadin, avenin) to enzymes (pepsin, trypsin) were tested and controlled by reversed phase-high performance liquid chromatography (RP-HPLC) on a C18 silica gel.19 On a preparative scale, 1 g of each gliadin and avenin was dissolved in 50 ml of diluted HCl (pH 2.0) and 100 mg (=4000 U) of pepsin were added. The mixtures were magnetically stirred at 37°C and after two hours centrifuged for 20 minutes at RT and 6000 g. The pH of the supernatants was adjusted to 7.8 with 0.1 mol/l NaOH and 1 ml of the trypsin suspension (=25 U) was added. After two hours of incubation at 37°C and under magnetical stirring, the pH was adjusted to 7.0 with 0.1 mol/l HCl, and the digests were centrifuged for 20 minutes at RT and 6000 g. The supernatants were then freeze dried. Control RP-HPLC on C18 silica gel indicated complex peptide patterns for both gliadin and avenin digests.
Patients
Eight duodenal biopsies were taken from 17 coeliac patients and 16 disease control patients by gastrointestinal endoscopy. The diagnosis of coeliac disease was based on a typical histological lesion and positive serology (IgA endomysial and gliadin antibodies) and positive histological and serological response to a gluten free diet. Ethics approval was granted by the Ethics Committee Board of St James's Hospital, Dublin, Ireland. Biopsies from both groups of patients were randomly assigned to culture with gliadin or avenin. The coeliac patients are listed according to the prolamin with which their biopsies were cultured in table 1; biopsies from nine coeliac patients (patient Nos 1–9) were cultured with peptic tryptic (PT) gliadin; biopsies from eight coeliacs (patient Nos 10–17) were cultured with PT avenin. Duration of gluten free diet, and demographic, serological and histological details are also given in table 1. Histology was graded as follows: 0=normal biopsy; 1=raised intraepithelial lymphocyte (IEL) count; 2=partial villous atrophy with raised IELs; and 3=subtotal villous atrophy with raised IELs.
Details of coeliac patients used in the study
Biopsies from eight normal controls were also cultured with PT gliadin (patient Nos 18–25) and biopsies from a further eight normal controls were cultured with PT avenin (patient Nos 26–33). The controls included nine males and seven females, with a mean age of 43 years (range 23–74). The histology of the duodenal mucosa was normal in 12 of these 16 subjects but was not available for the remaining four patients.
Organ culture
Four biopsies were cultured in the presence of 5 mg/ml PT gliadin or 5 mg/ml PT avenin for four hours using the organ culture method originally described by Browning and Trier.20 Specimens were orientated villous side up on a nylon membrane in an organ culture dish containing RPMI-1640 (Gibco BRL, UK) supplemented with 15% fetal calf serum (Sigma, USA) and 1% antibiotic/antimycotic solution (Gibco BRL), and cultured at 37°C in the presence of 95% O2 and 5% CO2. The prolamin stimulated biopsies were compared with biopsies cultured in medium alone.
RNA extraction and complementary DNA (cDNA) synthesis
Whole biopsies were homogenised and total RNA isolated by the guanidium thiocyanate method.21 RNA samples were heated at 85°C for two minutes. Total RNA (7.5 μl) was then reverse transcribed into cDNA in a 30 μl reaction mixture containing 5 mM MgCl2, avian myeloblastosis virus reaction buffer (50 mM Tris HCl, pH 8.3, 50 mM KCl, 10 mM MgCl2, 10 mM DTT, 0.5 mM spermidine), 1 U/μl RNasin ribonuclease inhibitor, 1 U/μl avian myeloblastosis virus reverse transcriptase, 5 ng/μl random primers, and 1 mM deoxynucleotide triphosphates (Promega, USA). The reaction was performed at 42°C for one hour. cDNA samples were stored at −70°C.
Primers and probes
Primers and probes for IFN-γ and IL-2 were designed using the computer program Primer Express and were based on the published sequence of human IFN-γ Genbank Accession No J00219 and IL-2 Genbank Accession No K02056 (table 2). Primers or probes were designed to cross an exon-exon boundary to ensure that genomic DNA was not being amplified. BLAST searches confirmed the primers were specific for the respective cytokines. TaqMan glyceraldehyde-3-phosphate dehydrogenase (GAPDH) primers and probe were available from Perkin Elmer. Melting temperatures (Tm) of the primers were between 50°C and 60°C. The probe Tm was 10°C higher than that of the primers. IFN-γ and IL-2 probes were labelled at the 5` end with the fluorogenic reporter dye 6-carboxyfluorescein and the GAPDH probe with VIC. All three were labelled at the 3` end with the quencher dye 6-carboxy-tetramethyl-rhodamine.
Cytokine primer and probe sequences
TaqMan PCR
Real time PCR was performed in the ABI TaqMan 7700 (Perkin Elmer). The 25 μl reaction mixture consisted of 2 μl cDNA, forward (0.3 pmol/μl) and reverse (0.3 pmol/μl) primers, probe (0.1 pmol/μl), and Universal PCR Master Mix (Perkin Elmer) which contained PCR buffer, deoxynucleotide triphosphates, AmpliTaq Gold, and uracil-N-glycosylase. Samples were run in triplicate. Accumulation of PCR product was detected by monitoring the increase in fluorescence of reporter dye using the ABI Prism 7700 Sequence Detection System. In order to account for inefficiencies in cDNA synthesis and RNA input, cytokine mRNA levels were quantified relative to GAPDH levels. Cytokine mRNA results were then normalised to resting peripheral blood mononuclear cell (PBMC) levels.
ELISA
ELISA development kits were used for IFN-γ (Mabtech, Sweden) and IL-2 (DuoSet from R and D Systems, Europe) detection and were used according to the manufacturers' recommendations.
Statistical analysis
Statistical differences were evaluated using the Wilcoxon signed rank test. A p value of less than 0.05 was regarded as statistically significant.
RESULTS
Gliadin induced cytokine production in coeliac tissue
A significant increase in IFN-γ mRNA production (p=0.0077) was observed in coeliac tissue following four hours of culture with PT gliadin (fig 1A). Marked increases in the cytokine were observed in four of nine patients (patient Nos 1, 2, 7, and 8) and a less marked response was observed in the remaining five patients. Although a four hour culture is suboptimal for cytokine protein production, increased levels of IFN-γ protein were detected in the culture supernatant in four of the patients (fig 1B). There was good agreement between protein and mRNA levels, with the four highest producers of IFN-γ mRNA also secreting protein into the culture medium.
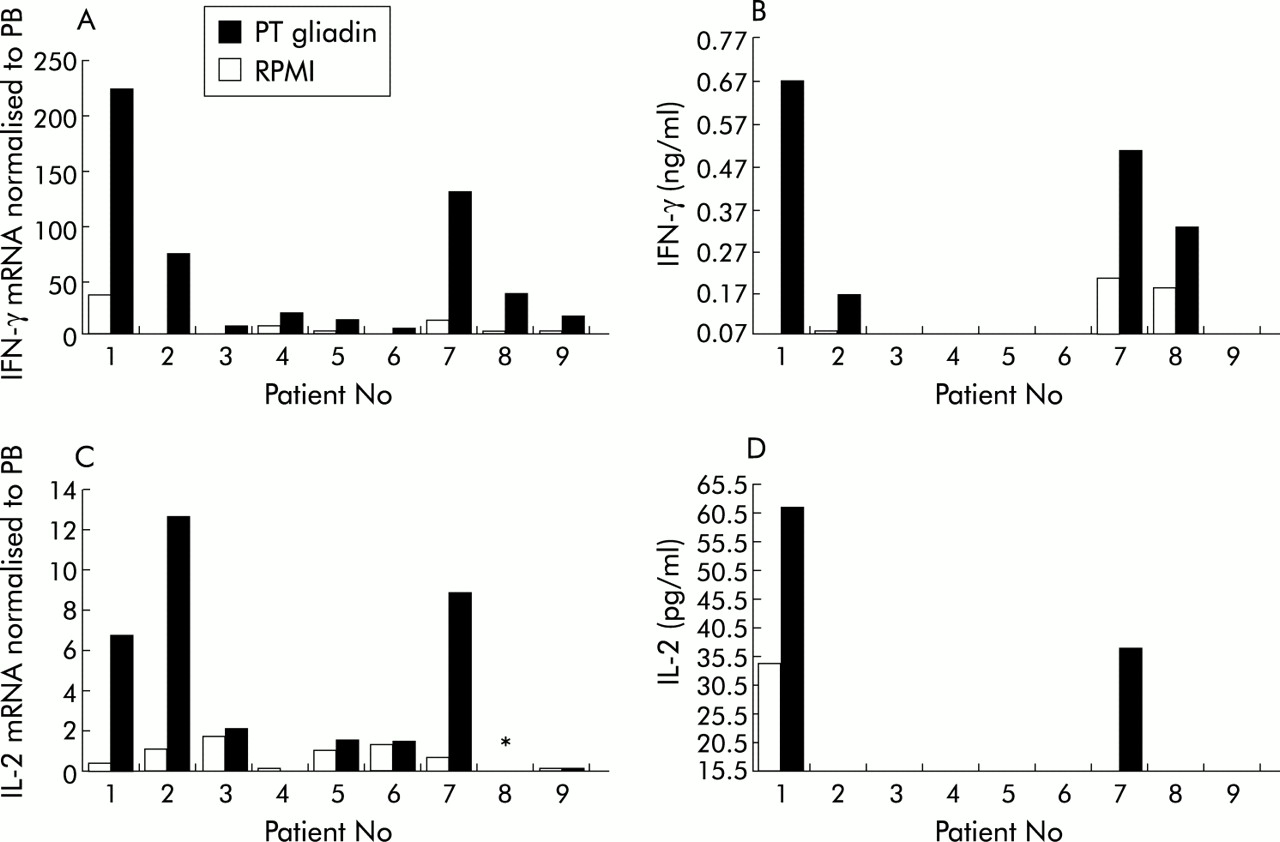
Cytokine production by duodenal biopsies from coeliac patient Nos 1–9 (table 1) cultured with peptic tryptic (PT) gliadin or with RPMI alone. (A) Interferon γ (IFN-γ) mRNA normalised to peripheral blood (PB); (B) IFN-γ protein; (C) interleukin 2 (IL-2) mRNA normalised to PB; and (D) IL-2 protein. *IL-2 mRNA was not determined in this patient.
A significant increase in IL-2 mRNA (p=0.0357) was also observed in coeliac specimens after gliadin stimulation (fig 1C). IL-2 mRNA levels post stimulation were, on average, 14 times lower than those observed for IFN-γ mRNA. The highest producers of IL-2 mRNA (patient Nos 1, 2, and 7) also produced high levels of IFN-γ. IL-2 was found in the supernatant of only two patients (patient Nos 1 and 7) after gliadin stimulation (fig 1D). Moreover, it can be seen from fig 1D that patient No 1 spontaneously secreted high levels of IL-2 into the supernatant.
Absence of cytokine response to avenin in coeliac tissue
Unlike PT gliadin, PT avenin did not trigger an IFN-γ mRNA (p=0.7353) response in coeliac tissue (fig 2A). Non-responders to avenin included a patient with marked mucosal inflammation who was EMA positive (patient No 16). IFN-γ protein was undetectable after biopsy culture with avenin (fig 2B). Furthermore, avenin did not induce significant IL-2 mRNA production (p=0.2076) (fig 2C). IL-2 mRNA levels were slightly raised in three of eight patients but a similar response was also seen in the normal control group (fig 4C). No IL-2 protein was detected in the medium of avenin stimulated cultures (fig 2D).
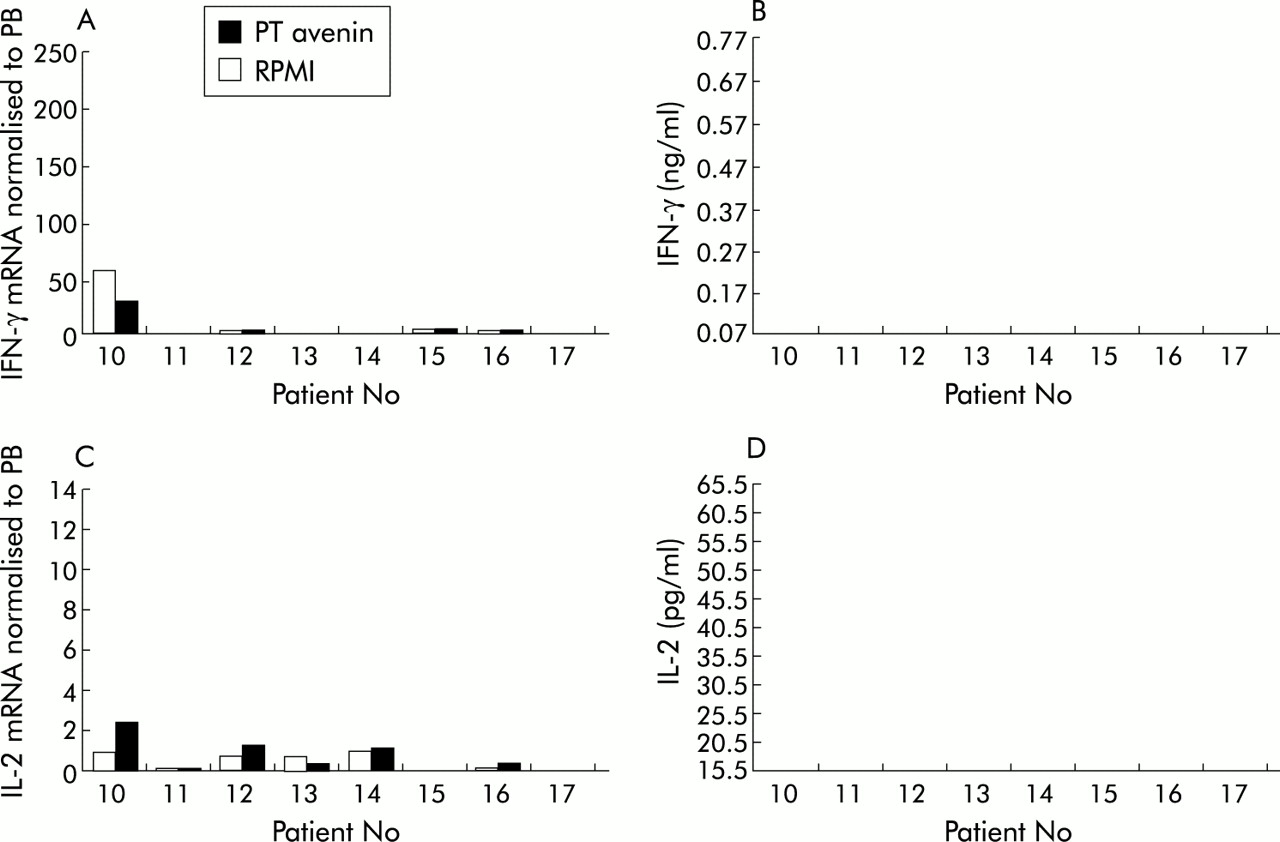
Cytokine production by duodenal biopsies from coeliac patient Nos 10–17 (table 1) cultured with peptic tryptic (PT) avenin or with RPMI alone. (A) Interferon γ (IFN-γ) mRNA normalised to peripheral blood (PB); (B) IFN-γ protein; (C) interleukin 2 (IL-2) mRNA normalised to PB; and (D) IL-2 protein.
Absence of cytokine response to gliadin and avenin in normal control tissue
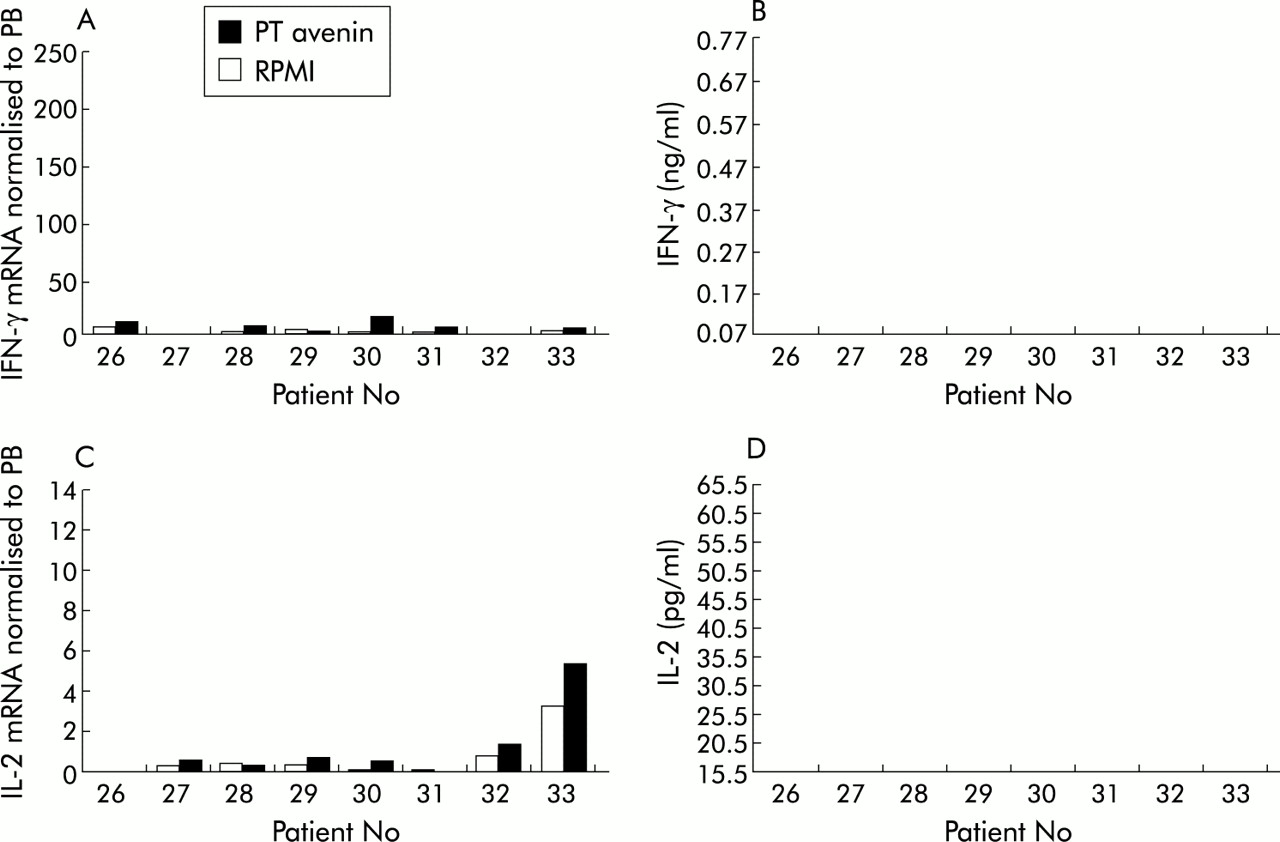
In contrast with coeliac patients, the IFN-γ mRNA response to gliadin in normal controls was not statistically significant (p=0.8658). There was a slight increase in just two of eight patients following stimulation (fig 3A). IFN-γ protein was not detected in the supernatants (fig 3B). Similarly, there was no significant IL-2 mRNA produced (p=0.2367) in response to PT gliadin (fig 3C). IL-2 protein levels in the supernatants were all below quantification levels (fig 3D). In a similar manner, avenin failed to induce a significant IFN-γ or IL-2 mRNA or protein response when cultured with normal tissue (fig 4).

Cytokine production by duodenal biopsies from normal control patient Nos 18–25 cultured with peptic tryptic (PT) gliadin or with RPMI alone. (A) Interferon γ (IFN-γ) mRNA normalised to peripheral blood (PB); (B) IFN-γ protein; (C) interleukin 2 (IL-2) mRNA normalised to PB; and (D) IL-2 protein.

Cytokine production by duodenal biopsies from normal control patient Nos 26–33 cultured with peptic tryptic (PT) avenin or with RPMI alone. (A) Interferon γ (IFN-γ) mRNA normalised to peripheral blood (PB); (B) IFN-γ protein; (C) interleukin 2 (IL-2) mRNA normalised to PB; and (D) IL-2 protein.
DISCUSSION
The purpose of this study was to determine whether avenin could cause immune activation of cultured duodenal biopsies taken from patients with coeliac disease. The parameters investigated included quantification of IFN-γ and IL-2 mRNA and also measurement of secreted cytokines in culture supernatants. Avenin failed to induce a statistically significant cytokine response in the eight coeliac patients studied: no significant increase in the level of mRNA or protein for IFN-γ or IL-2 was observed. In contrast, gliadin addition to duodenal biopsy cultures from a further nine treated coeliac patients caused immune activation in these subjects.
In gliadin stimulated coeliac biopsy cultures, production of IFN-γ was more prominent than that of IL-2. An increase in IFN-γ mRNA was observed in all nine patients with very high levels present in four subjects. Moreover, an increase in IFN-γ protein was found in these four patients. In contrast, although IL-2 mRNA was increased in six subjects after gliadin stimulation, the mean IL-2 message level was 14-fold lower than quantities of mRNA for IFN-γ. Furthermore, only low levels of IL-2 protein were present and an increase in this cytokine was found in two subjects following gliadin activation. These findings were specific for biopsies from coeliac subjects and no cytokine products were observed in the gliadin stimulated biopsy cultures from control subjects.
The four hour culture period was chosen based on published cytokine mRNA kinetic experiments.16 Nilsen et al found that optimal mRNA production for IFN-γ and other cytokines (including IL-2, IL-4, IL-6, and tumour necrosis factor α) following gluten stimulation of duodenal organ cultures was between two and six hours. However, such short term cultures are not optimal for cytokine protein production and in their study Nilsen and colleagues16 were unable to detect cytokines in the culture supernatant after two or six hours of gluten stimulation. Failure to detect soluble cytokines might be explained by delayed synthesis of these proteins or because secreted cytokine bound rapidly to specific receptors. None the less, IFN-γ was detected by immunohistochemical staining of fresh biopsy tissue in patients with untreated coeliac disease.16 In the current study, after four hours of organ culture with gliadin, IFN-γ protein production was detected in four subjects and interestingly these patients had the highest levels of mRNA for IFN-γ. Moreover, two of these patients also secreted IL-2 protein. The finding of secreted cytokines is in keeping with reports of increased tissue expression of several key immune response molecules (HLA-DR and intercellular adhesion molecule 1 (ICAM-1)) within two hours of gluten stimulated biopsy culture.22 IFN-γ is known to cause upregulation of both molecules on epithelial cells.23–26
Some coeliac patients showed evidence of mucosal damage and two patients were EMA positive. However, spontaneous or gliadin induced IFN-γ production did not correlate with the severity of the patient's mucosal lesion or EMA status. For example, patient Nos 1, 2, 7, and 8 produced the highest levels of IFN-γ mRNA following gliadin stimulation and yet all had normal or mildly damaged mucosae and were EMA negative. In contrast, patient Nos 4 and 6 whose biopsies showed severe villous blunting, produced little IFN-γ mRNA, even after gliadin stimulation. These results are of interest as in earlier studies levels of cytokine mRNA and protein were higher in patients with untreated coeliac disease.16,27–31 The different findings may relate to the time point chosen for cytokine detection and the relatively small number of study subjects. Although there was a trend for more severe histological damage in biopsies cultured with gliadin, as each prolamin result was compared with spontaneous cytokine synthesis, this did not affect the validity of the results.
The finding of a marked IFN-γ mRNA and protein response in coeliac tissue is in keeping with several previous reports. These studies were based on investigation of fresh biopsy tissue,29 intestinal tissue after organ culture,16 and T cells cloned from duodenal biopsies.32–34 In addition, IFN-γ was produced by peripheral blood mononuclear cells from coeliac subjects in response to unfractionated gliadin35 or gliadin peptide stimulation.36 Thus like many other chronic inflammatory disorders such as Crohn's disease, rheumatoid arthritis, and insulin dependent diabetes mellitus,37 the so-called Th1 response seems to be dominant in coeliac disease. This is keeping with the concept that a delayed-type hypersensitivity response to gluten is central to the pathogenesis of coeliac disease. However, precisely how this leads to the coeliac mucosal lesion is not understood.
Organ culture of treated coeliac intestinal biopsies, in the presence of gluten or gluten fractions, is a traditional in vitro experimental approach used in the study of coeliac disease. Until recently, these studies relied on detailed morphometric evaluation of the tissue, examining features such as reduced enterocyte height38,39 and increased infiltration of the epithelial layer by lymphocytes.15 However, in these experiments sizable properly orientated biopsies are crucial to the success of the study. With the increasing use of endoscopic forceps rather than the Crosby capsule to obtain biopsies, few studies now rely on morphometry to reflect tissue changes. In more recent studies, immunohistochemical staining of biopsy tissue has been employed and changes in the level of expression of molecules such as HLA-DR, ICAM-I, CD25,22 and various cytokines27,28 have been investigated. However, a level of subjectivity is inevitable in this experimental procedure. It was for this reason that in our study objective quantitative methods were used, employing realtime PCR for determination of mRNA and ELISA for measurement of secreted cytokines. A disadvantage of this approach is the restriction on the number of experiments which can be performed: a total of four biopsies were required to obtain sufficient mRNA for analysis of one culture condition—for example, studying the effect of avenin. Thus it was not possible to compare the response to two different cereal fractions in the same individual.
In earlier organ culture studies of prolamin toxicity, a concentration of 1 mg/ml of protein was commonly employed and found to be sufficient to induce a mucosal response.22,28,38,40,41 In the present study, even when 5 mg/ml of avenin were added to the biopsy cultures, there was no evidence of cytokine production. An equivalent amount of gliadin did activate the coeliac mucosa.
Because avenin accounts for only 5–15% of the total protein in oats (whereas wheat, barley, and rye prolamins constitute 40–50%), it has been suggested that larger quantities of oats may still be toxic to coeliac patients. However, the findings of this study argue against this and demonstrate that purified avenin is not immunogenic to the coeliac mucosa. These results concur with several studies which reported that oats caused no adverse clinical effects and did not result in immune activation.7,8,10 Moreover, they are in agreement with a short clinical challenge study of two patients with dermatitis herpetiformis given 2.5 g of purified avenin for five days without adverse effect.42
In conclusion, the findings of this study provide evidence that the immunogenic sequences in gliadin are not present in avenin and support the belief that oats are safe for consumption by coeliac patients.
Acknowledgments
The authors thank U Schützler and Jennifer Russell for excellent technical assistance. The work of Catriona O'Dwyer and Fiona Paolozzi is also gratefully acknowledged.