Article Text

Abstract
BACKGROUND The aim of the study was to test the hypothesis that in the fasting state, proximal intestinal HCO3 − absorption, which depends on villus Na+/H+ exchanger activity, is tonically inhibited by a cholinergic atropine sensitive mechanism.
SUBJECTS The experiments were performed in 34 healthy volunteers and in eight patients with intestinal villus atrophy.
METHODS HCO3 −absorption was measured with a modified triple lumen perfusion technique in the distal duodenum, the most proximal portion of the small intestine. The study was designed to compensate for the inhibitory effects of atropine on intestinal motor activity.
RESULTS Atropine had three effects on HCO3 − transport: it reduced HCO3 − concentration at the proximal aspiration site, it displaced the relation between HCO3 − concentration and HCO3 − absorption to the left, and it induced a significant acidification of the perfusate at the distal aspiration site. The magnitude of the stimulatory effect on HCO3 − absorption was similar to the difference between patients with intestinal villus atrophy and healthy controls.
CONCLUSION The data suggest that, in the fasting state, duodenal HCO3 − absorption, which depends on villus Na+/H+ exchanger activity, may be tonically inhibited by an atropine sensitive cholinergic mechanism.
- small intestine
- absorption
- cholinergic
- muscarinic receptor
- villus atrophy
- coeliac disease
Abbreviations
- MMC
- migrating motor complex
- NHE
- Na+/H+ exchanger
- PEG
- polyethylene glycol
Statistics from Altmetric.com
Several enteric neurotransmitters and gut hormones—for example, acetylcholine, 5-hydroxytryptamine, substance P, and neurotensin—inhibit electrically silent Na+ absorption via a Ca2+ dependent mechanism, but the physiological role of this system is not known.1 ,2 One possible function may be down regulation of epithelial transport activity in the fasting state. When the “feeding programme” is activated, ileal Na+ absorption increases significantly,3 and this response is blocked by high dose amiloride, suggesting disinhibition of villus Na+/H+ exchanger (NHE) activity. The absorbing enterocytes may consequently alternate between a “resting” and an active state, depending on the degree of inhibitory neural activity.
While studying the linkage between interdigestive motility and secretion in the upper small intestine in humans,4 we made the observation that atropine tended to enhance duodenal HCO3 − absorption. In the proximal small intestine, bicarbonate is absorbed by Na+/H+exchange5 ,6—that is, with an excess of HCO3 − in the lumen, NHE activity will be rate limiting for active HCO3 − absorption (fig 1). If cholinergic neurones tonically inhibit NHE activity in the fasting state, one will consequently expect blockade of this inhibitory influence to enhance active HCO3 − absorption. This effect also actually occurs when atropine is given intravenously to anaesthetised rats.8
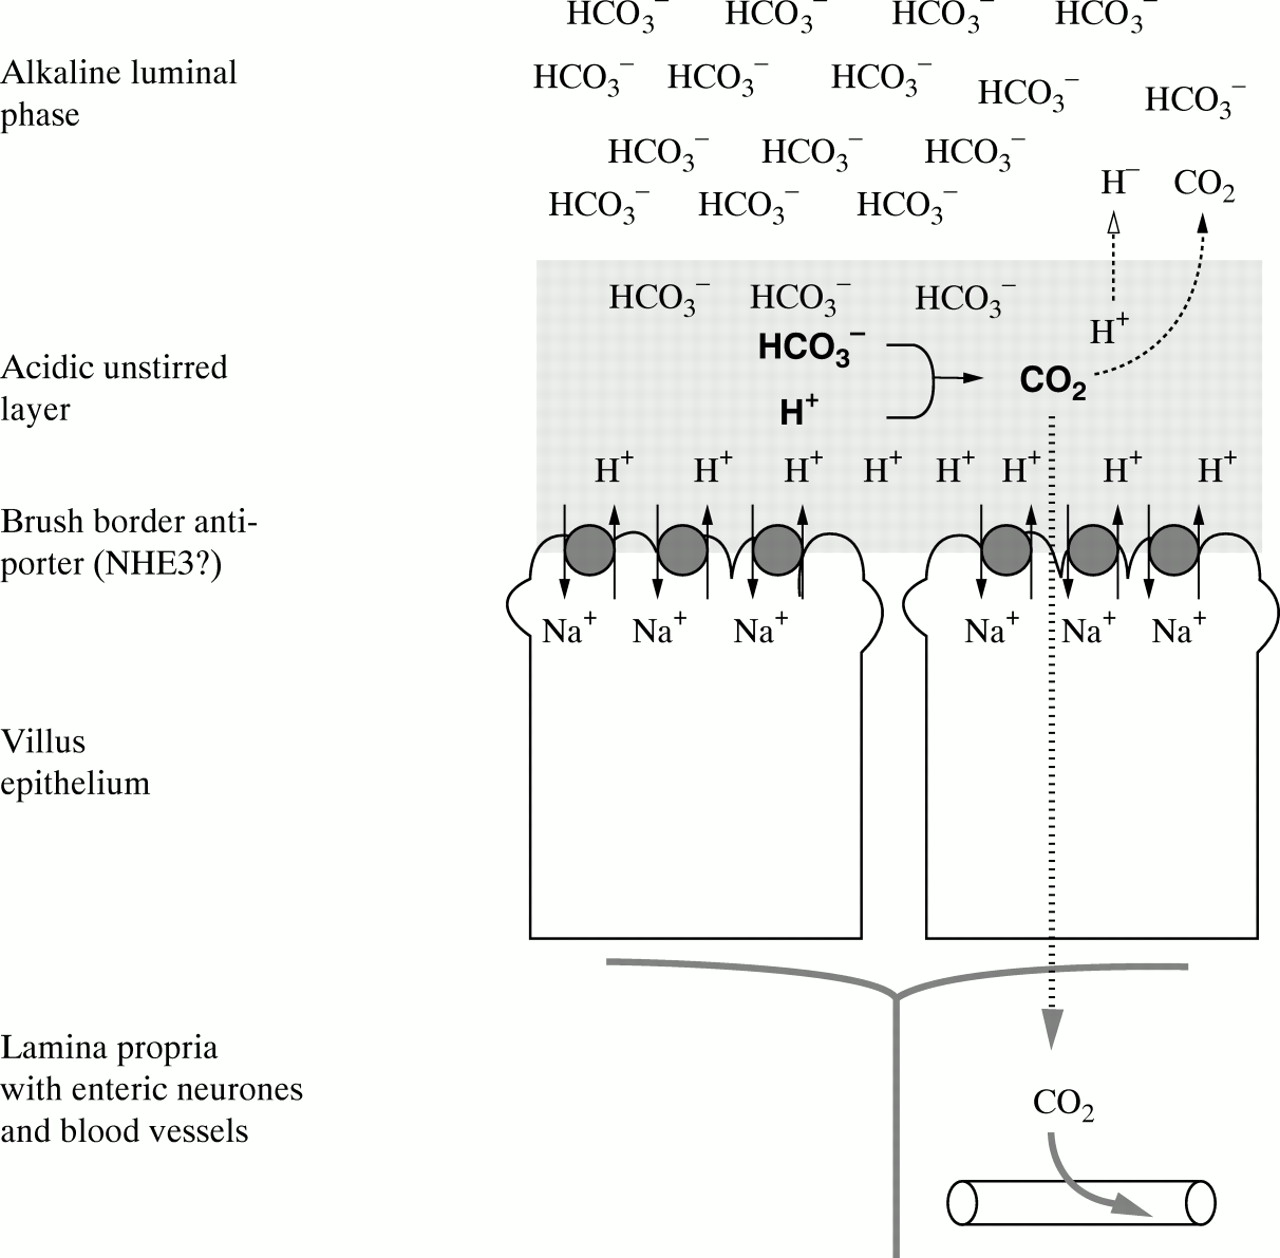
A model illustrating the mechanism for active HCO3 − absorption in proximal small intestine. The unstirred layer of the villi is constantly acidified7by Na+/H+ exchanger (NHE) activity in the apical membrane of the enterocytes. HCO3 −ions from the alkaline luminal compartment react with protons in the unstirred layer, and the CO2 formed in this reaction is rapidly absorbed by the mucosa. This system for HCO3 − absorption has a very high capacity and is hard to saturate.6 The rate of proton formation will influence the apparent affinity for HCO3 −—that is, an increased NHE activity will enhance HCO3 − absorption at a given luminal HCO3 − concentration.
In the experiments described below, we used HCO3 − absorption as an indirect marker for vectorial NHE activity, and tried to test the hypothesis that, in the fasting state, this activity is tonically inhibited by a cholinergic atropine sensitive mechanism. Using a modified triple lumen perfusion technique, we measured distal duodenal HCO3 −absorption in healthy human volunteers under control conditions and after atropine administration. To obtain some additional information about the mechanisms behind the atropine response, we also included a small group of patients with villus atrophy in the study. Motor activity markedly influences HCO3 − absorption in the mixing segment,9 and to minimise the impact of this factor, the atropine data were compared with periods of similar but “spontaneous” motor quiescence, for which purpose we used the first 30 minutes of the interdigestive motility cycle.
Materials and methods
Thirty four healthy volunteers and eight patients with villus atrophy participated in the study. The healthy volunteers had no history of gastrointestinal disease and were free from medication. The protocol was approved by the ethical committee at Sahlgrenska University Hospital, Göteborg, and all participants had given informed consent. The patients were informed about the scientific nature of the study, and they all participated voluntarily. The study was part of a diagnostic “work up” for patients with suspected coeliac disease, and the patients had agreed to refrain from changes in diet until all diagnostic procedures were completed. The diagnosis of villus atrophy was based on duodenal biopsies in triplicate showing signs of subtotal or total villus atrophy, crypt hyperplasia, and increased numbers of inflammatory cells in the lamina propria. The mean age of the volunteers was 25 (range 20–39) years and the mean age of the villus atrophy patients was 39 (range 20–53) years. The experiments started with the intubation procedure at 7 30 am, and continued for about four hours.
TRIPLE LUMEN PERFUSION TECHNIQUE
This technique has been described in detail in several previous publications to which the reader is referred for technical details.4 ,10 ,11 The subjects were intubated with a specially constructed four- or five-lumen nasogastric tube (modified Salem no 12 French, Argyle, Belgium). The tube, which contained one infusion channel, two aspiration channels, and one or two pressure channels, was placed with its tip at the duodenojejunal flexure, with the aid of intermittent fluoroscopy. An isotonic Krebs/mannitol solution with a bicarbonate concentration of 25 mmol/l (for composition, see below) was infused just distal to the papilla Vateri at a rate of about 6 ml/min, the exact pump rate being calibrated in each experiment. During the early part of the migrating motor complex (MMC) cycle, this solution generates a slightly lumen positive transmural potential difference4 ,11 and a luminal HCO3 − concentration of about 20 mmol/l (or lower) at the entry to the test segment—that is, HCO3 − absorption occurs against an electrochemical gradient (active absorption). In some experiments, the duodenum was instead perfused with saline, to measure secretory HCO3 − fluxes. Both solutions contained polyethylene glycol (PEG, molecular mass 4000 Da) at a concentration of 2 g/l, as a non-absorbable volume marker.12
The luminal contents were aspirated at two distal sites, 5 cm (proximal aspiration site) and 15 cm (distal aspiration site) distal to the infusion site—that is, in the mid duodenum and at the level of the duodenojejunal flexure respectively. The 5 cm segment between the infusion point and the proximal aspiration point acted as mixing segment, and the subsequent 10 cm segment was our test segment. After a run for a period of 40 minutes, fluid was aspirated manually at a rate of 0.7 ml/min from the proximal and distal aspiration sites. The distal aspiration started five minutes after the proximal aspiration, to compensate for estimated mean transit time through the test segment.13 In most experiments, aspirates were collected at 15 minute intervals, and mean values from two 15 minute aspiration periods were used as 30 minute data. In some experiments (mainly the villus atrophy group), fluid was instead collected in 30 minute aliquots.
ANALYSIS OF CONCENTRATIONS OF PEG AND HCO3− IN THE PROXIMAL AND DISTAL ASPIRATE
The concentration of PEG was determined by the turbidimetric method of Hydén.14 For the analysis of HCO3 − concentration, 2 ml samples of mixed aspirates were collected in closed plastic vials. pH and Pco 2 of the aspirate were measured in an automatic acid-base analyser (ABL 50; Radiometer, Copenhagen, Denmark), and HCO3 − concentration [HCO3 −] was calculated from Henderson-Hasselbalch’s equation: [HCO3 −] = S × Pco 2 × 10pH−pKa, where S, the solubility constant for CO2, has a value of 0.23 mmol/kPa per litre at 37°C15 and the value for pKa, the first dissociation constant of carbonic acid in a plasma-like solution, is 6.10.16
CALCULATIONS OF HCO3− ABSORPTION
HCO3 − absorption in the test segment was calculated from the following formula: HCO3 −absorption = ((Qpr − 0.7) × [HCO3 −] pr) − ((Qpr − 0.7 − NFT) × [HCO3 −] di), where Qpr = volume flow at the proximal aspiration site (= Q × [PEG]inf/[PEG]pr), Q = pump rate (≈6 ml/min), [PEG] = PEG concentration, 0.7 = proximal aspiration rate (ml/min), NFT = net fluid transport within the test segment (= (Qpr − 0.7) × (1 − [PEG]pr/[PEG]di)). Subscripts inf, pr, and di denote infusion and proximal and distal aspiration sites respectively.
RECORDING OF DUODENAL MOTOR ACTIVITY
A modified Arndorfer system was used to record duodenal motility.17 Motor activity was always recorded 2 cm distal to the infusion site—that is, in the descending duodenum distal to the papilla Vateri, and in most experiments also at the duodenojejunal flexure, to confirm propagation of the activity front (phase III) of the MMC. The thin polyethylene catheters used for pressure recording were perfused with isotonic saline via narrow capillaries at a rate of 0.3 ml/min, and inflow pressure was recorded by pressure transducers connected to bridge amplifiers on a Grass polygraph (model 7D; Grass Instruments, Quincy, Massachusetts, USA). A contraction was defined as a phasic increase in intraluminal pressure exceeding 8 mm Hg. The frequency of contractions was calculated manually from the paper recordings every minute.
CONTROL PERIODS AND CORRECTIONS FOR EFFECTS OF ATROPINE ON MOTOR ACTIVITY
As atropine reduces motor activity,4 we compared periods of “spontaneous” motor quiescence in the other groups (controls, NaCl, villus atrophy) with the atropine data. This was achieved by measuring during the first 30 minutes after phase III of the MMC. Phase III of the MMC cycle was defined as a period of motor activity at slow wave frequency (10–12 contractions/min) with a duration of at least two minutes.18 If pressure was recorded at two sites, propagation of the front was also included in the definition of phase III activity.
EXPERIMENTAL GROUPS
The control group (n = 11) consisted of healthy volunteers, perfused with Krebs/mannitol and receiving no experimental intervention. The saline group (n = 10) were also healthy volunteers perfused with saline and receiving no experimental intervention. The atropine group (n = 13) were healthy volunteers perfused with Krebs/mannitol and receiving atropine. Atropine (Kabi Vitrum AB, Stockholm, Sweden; 0.5 mg/ml) was given intravenously at a dose of 0.01 mg/kg 30–45 minutes after a phase III period, and this dose was followed by two additional injections at 30 minute intervals (0.1 mg each).4 The “atropine” data were mean values obtained during the 90 minutes after atropine injection. The villus atrophy group (n = 8) consisted of patients with villus atrophy due to untreated coeliac disease; they were perfused with Krebs/mannitol and received no experimental intervention.
INTESTINAL PERFUSATES
In most experiments the intestine was perfused with a Krebs/mannitol solution with the following composition (in mmol/l): 122 NaCl, 4.7 KCl, 1.2 KH2PO4, 25 NaHCO3, 1.2 MgCl2 and 30 mannitol (all from Sigma Chemicals, St Louis, Missouri, USA). The solution also contained PEG at a concentration of 2 g/l. The pH of the solution was approximately 8.0 (7.4 after equilibration with 5% CO2 ) and the osmolality approximately 310 mosmol/kg. In the saline group, we perfused the intestine with physiological saline (NaCl 154 mmol/l), to which was added PEG 2 g/l. Krebs/mannitol was used as perfusate in the villus atrophy group.
CALCULATIONS AND STATISTICAL EVALUATION
In an unsaturated system, HCO3 −absorption will be concentration dependent. Luminal HCO3 − concentration at the proximal aspiration site was significantly lower in the atropine group and therefore the concentration factor had to be corrected for when comparisons of absolute HCO3 − absorption rates in the different groups were made. In the atropine group, most of the data followed a concentration-absorption line that was roughly parallel to the control line. To test if the distribution of these data differed from the control distribution, concentration values were fed into the equation for the control line, and calculated (“expected”) HCO3 − absorption values were compared with actual (measured) values, under the null hypothesis that the two sets of data belong to the same population. The same calculation was performed for the control group, and the significance of the difference between the two populations was then tested with the non-parametric Mann-Whitney U test.
In the villus atrophy group, there was no consistent relationship at all between HCO3 − concentration and absorption, and therefore this “mathematical” approach was considered inappropriate. However, in this group, spontaneous luminal HCO3 − concentration was not significantly different from that obtained in the control group, and therefore this luminal concentration value (≈ 20 mmol/l) was chosen as the normalisation point for all three groups. At this concentration point, we were thus able to use actual measured data from controls and villus atrophy patients, and only had to normalise the atropine data to a concentration of 20 mmol/l, as calculated from the slope of the regression line. In this way, we were able to make a meaningful quantitative comparison of absolute HCO3 −absorption rate in the three groups, at a similar luminal HCO3 − concentration value.
The comparison between the three groups was performed with the non-parametric Kruskal-Wallis test and the Mann-Whitney U test. In the analysis of pH and Pco 2 data, we calculated Pco 2 and H+ concentration at the proximal and distal aspiration sites. The difference between the two aspiration sites, within each group, was tested by the non-parametric Wilcoxon test, and the difference between absolute values at each aspiration site between the three groups was first tested with the Kruskal-Wallis test followed, if justified, by the non-parametric Mann-Whitney U test for independent samples. p<0.05 was regarded as statistically significant.
Results
There was no significant difference in motor activity between the groups (table 1). Luminal HCO3 − concentration at the entry to the test segment was not significantly different in the control and villus atrophy groups (≈ 20 mmol/l), but was about 20% lower in the atropine group (15.2 (0.9) mmol/l; p<0.01 versus control and villus atrophy groups; results are mean (SE)).
Duodenal motor activity and luminal HCO3 - concentration at entry to test segment, in the different groups
Figure 2 illustrates the relation between luminal concentration and absorption of HCO3 − in the control group. During perfusion with the HCO3 −-containing solution (filled triangles), there was a significant linear correlation between HCO3 − absorption and HCO3 − concentration measured at the proximal aspiration site (r = 0.80, p<0.01). During perfusion with HCO3 −-free solution (NaCl, open triangles), HCO3 − transport was not significantly different from zero.
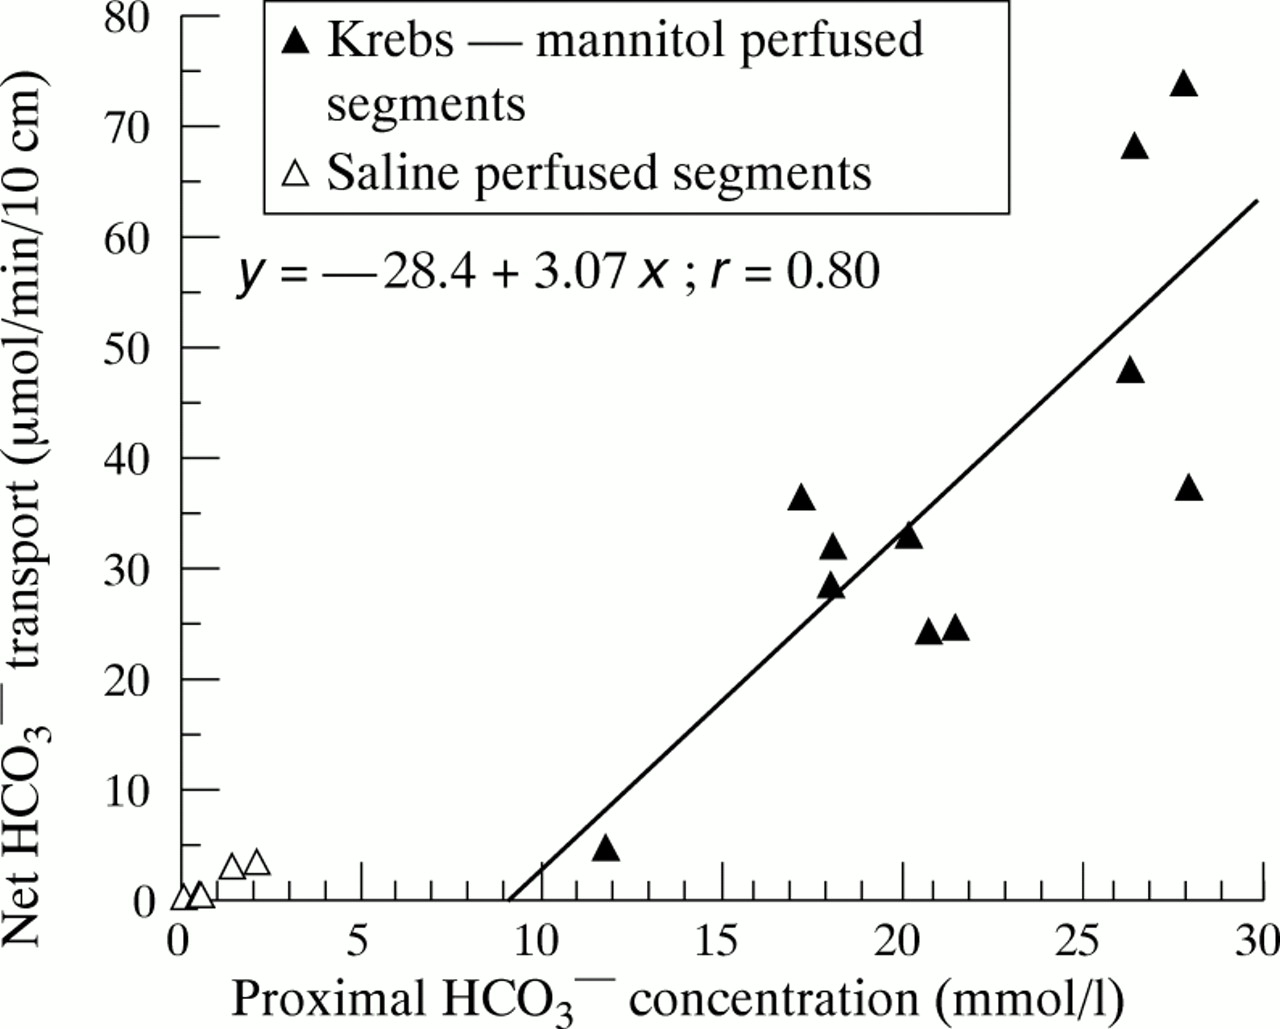
Duodenal HCO3 − absorption as a function of luminal HCO3 − concentration at the entry to the test segment, in healthy controls. All data emanate from the first 30 minutes of the migrating motor complex cycle (low motor activity). Filled triangles indicate Krebs/mannitol perfused segments and open triangles saline perfused segments. HCO3 − transport is expressed as μmol/min per 10 cm; positive values denote net absorption. The equation of the regression line for the Krebs/mannitol perfused segment is also given in the figure.
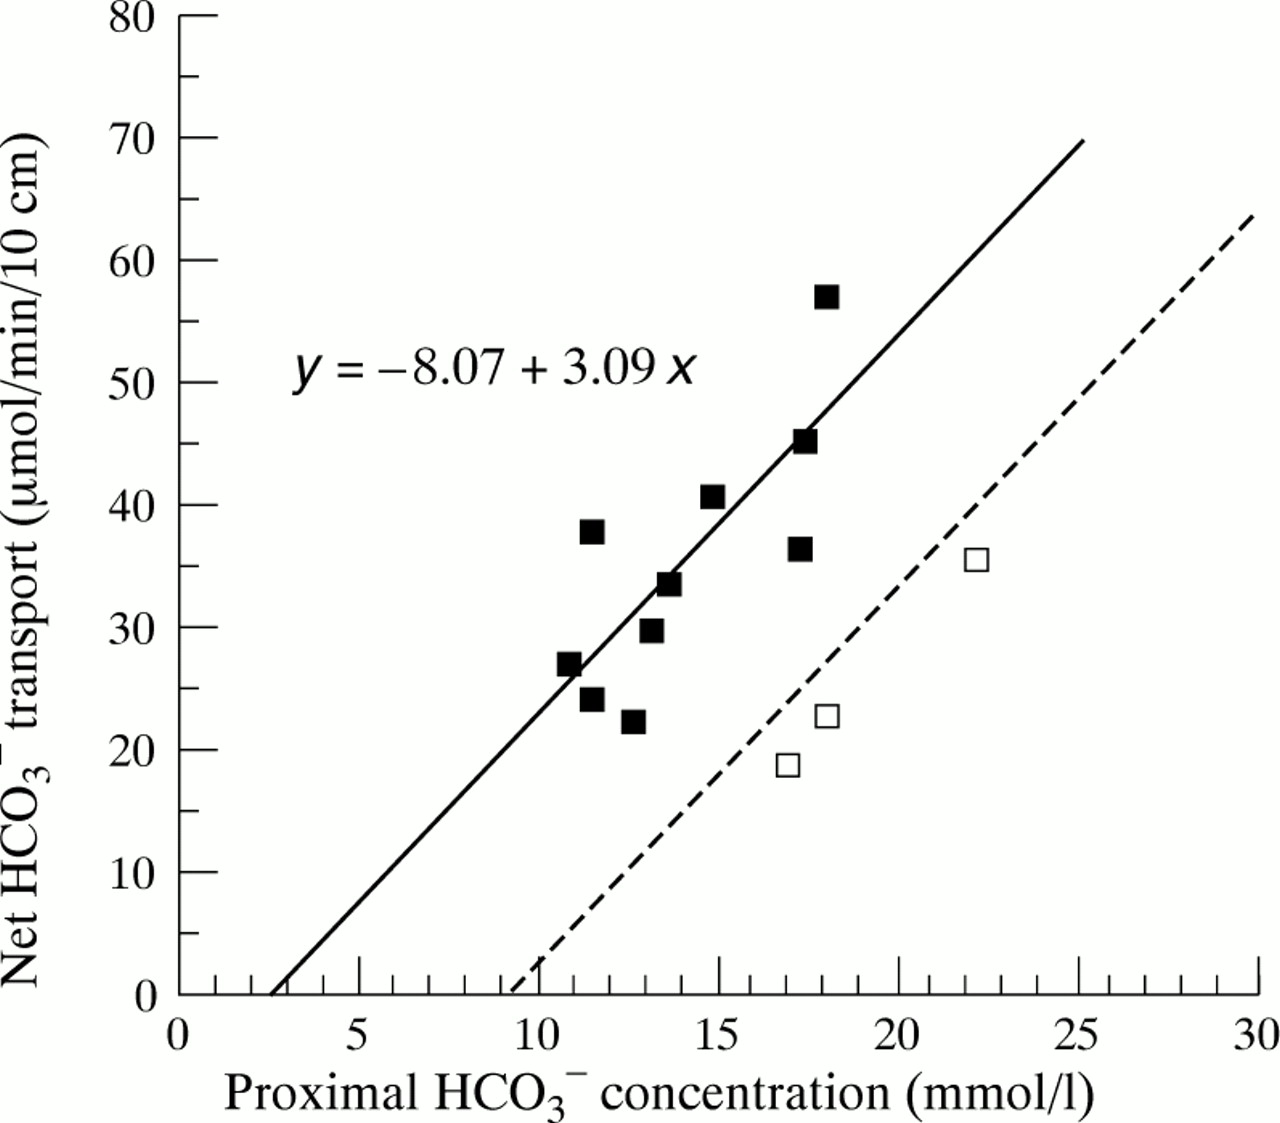
Figure 3 shows individual values for HCO3 −concentration and HCO3 − absorption in the atropine group. In this group, there was no longer any significant correlation between HCO3 − concentration and HCO3 − absorption (r = 0.32, p = 0.28). However, 10 of 13 subjects (solid squares) followed a regression line that was approximately parallel to the one obtained in the controls (which is indicated by the dashed line in fig 3). The three remaining subjects (open squares) closely followed the control regression line. To test if the displacement of the atropine data from the control regression line was statistically significant, we fitted the concentration data in the atropine group into the control regression equation, and then compared measured and expected HCO3 − absorption rate under the null hypothesis that the atropine data were randomly distributed around the control line. This calculation showed that the atropine data were significantly displaced to the left of the control population (control distribution: 0.0 (3.6); atropine distribution: +13.8 (3.7) μmol/min per 10 cm; p<0.05).

Relation between luminal HCO3 − concentration and net HCO3 − absorption in atropine treated subjects. A total of 10 of 13 subjects (solid squares) followed a regression line (solid line) that was almost exactly parallel to the control regression line (dashed line). The three remaining subjects (open squares) were on the control line. The equation of the regression line for the 10 subjects is given in the figure.
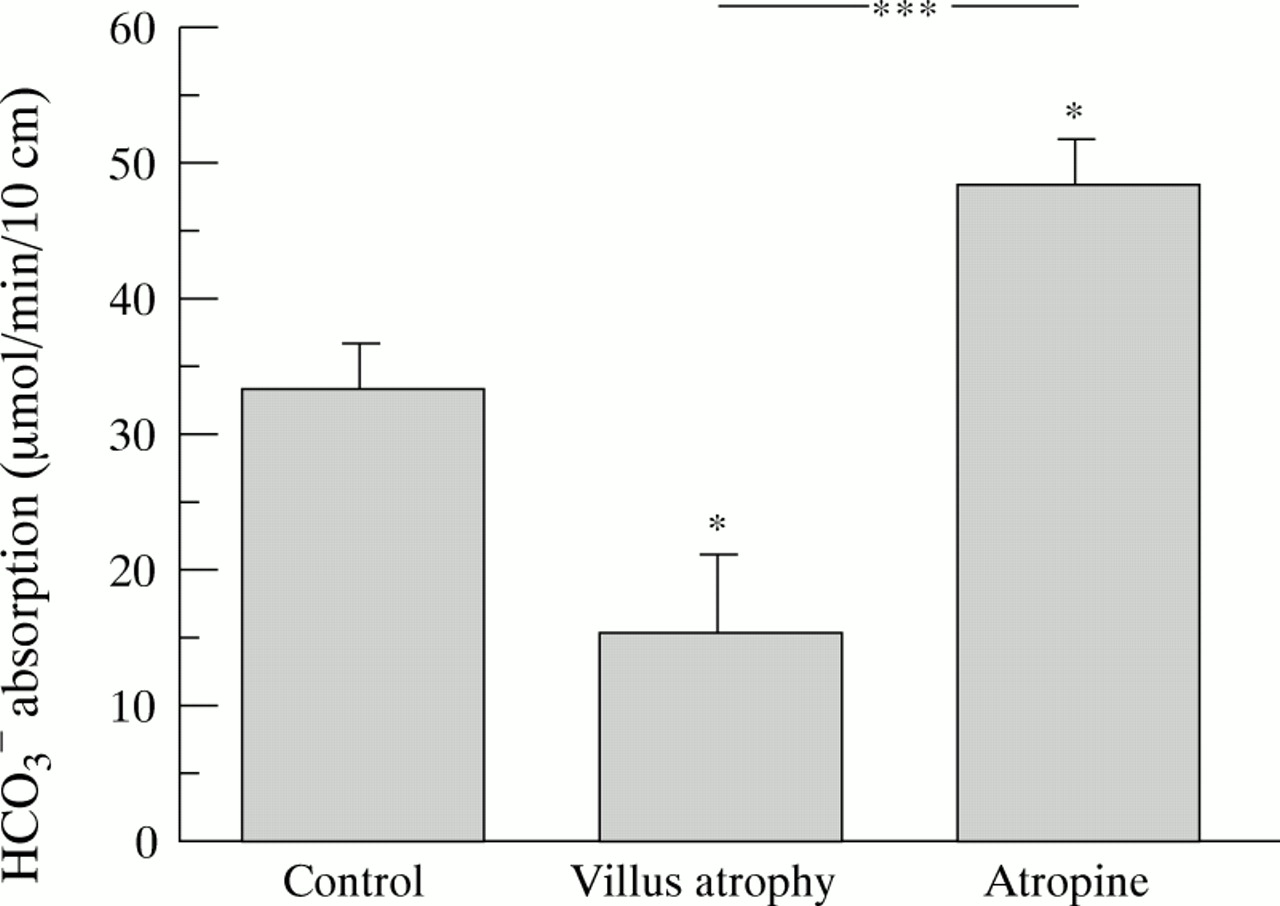
In the villus atrophy patients, there was no consistent relation at all between luminal HCO3 − concentration and absorption (r = 0.075, p = 0.85; data not shown), and therefore this mode of recalculation was not considered appropriate for this group. However, luminal HCO3 − concentration at the proximal aspiration site in the villus atrophy patients was not significantly different from that in the control group (19.8 (1.1)v 21.4 (1.4) mmol/l). To be able to directly compare absolute HCO3 − absorption values in all three groups at a similar luminal HCO3 −concentration, we therefore used actual measured data from the control and villus atrophy groups and mathematically normalised the atropine data to the same luminal concentration (20 mmol/l), from the slope of the (control and atropine) regression lines. Figure 4 shows the results of this calculation. In the control group, the normalised HCO3 − absorption rate was 35.4 (3.8) μmol/min per 10 cm, which increased to 48.0 (3.4) μmol/min per 10 cm after atropine administration (p<0.05 vcontrol data). In the villus atrophy group, the normalised HCO3 − absorption rate was 15.2 (5.7) μmol/min per 10 cm (p = 0.01 v controls, p<0.001 v atropine). (Actual luminal HCO3 − concentration in the control group was 21.4 (1.4) mmol/l, and the use of measured instead of calculated (20 mmol/l) data only marginally changed the results and did not influence the significance values.)

Calculated net HCO3 −absorption at a luminal HCO3 − concentration of ≈ 20 mmol/l in the three groups. Control data and atropine data were recalculated from the slope of the regression lines in figs 2 and3. Villus atrophy data were measured data (mean luminal HCO3 − concentration 19.8 (1.1) mmol/l) . Values are mean (SE). Asterisks above bars indicate a significant difference from control values. A significant difference between villus atrophy and atropine data is indicated separately. Significance levels were: *p<0.05; **p<0.01; ***p<0.001. For further explanations, please see the text.
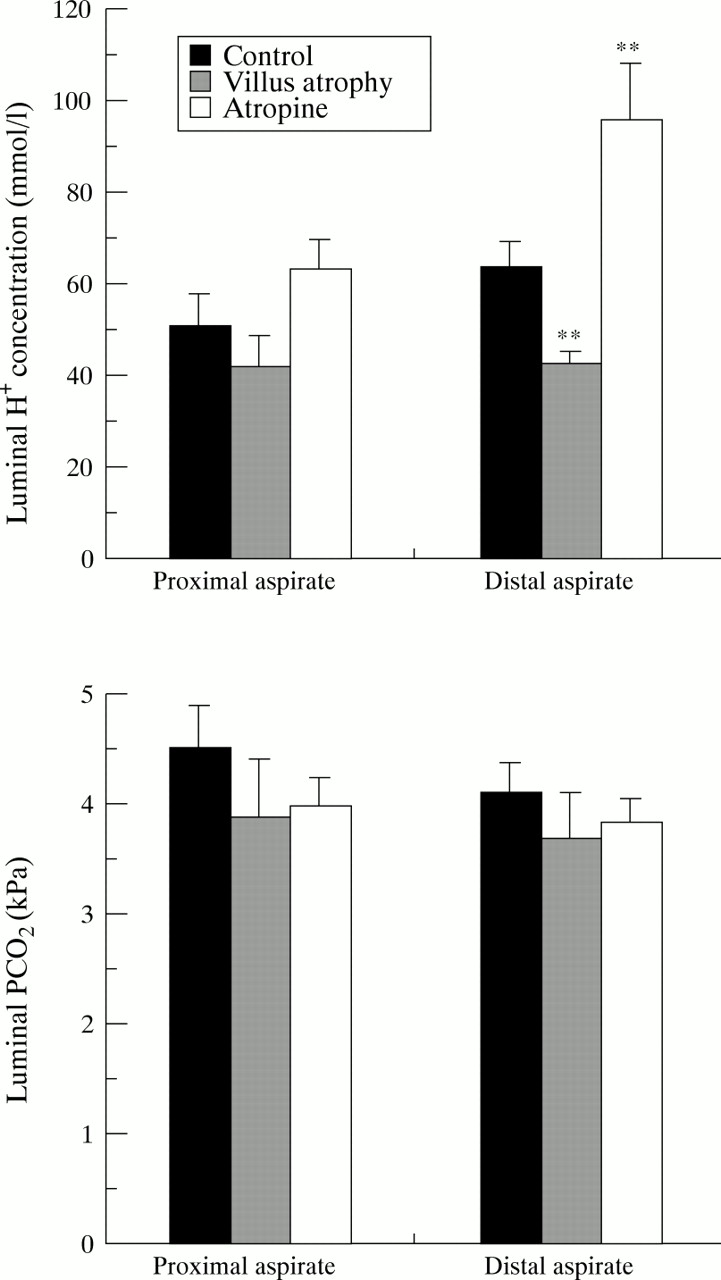
To analyse further the mechanism behind the apparent stimulatory effect of atropine on HCO3 − absorption, we also calculated luminal H+ ion concentration and luminal Pco 2 values at the proximal and distal aspiration sites. Figure 5 summarises the results. At the proximal aspiration site, there was no significant difference in luminal H+ ion concentration between the three groups (Kruskal-Wallis test, p = 0.09) (fig 5A). Between proximal and distal aspiration sites, H+ concentration increased significantly in the atropine group (p<0.01) but no significant change occurred in the control group (p = 0.09) or in the villus atrophy group (p = 0.48). Consequently, at the distal aspiration site, luminal H+concentration in the atropine group was significantly higher and in the villus atrophy group significantly lower than in the control group (p<0.01).

Luminal H+ concentration (top panel) and luminal Pco 2 (bottom panel) at the proximal and distal aspiration sites, in the three groups. Luminal H+concentration is expressed in nmol/l and Pco 2in kPa. Values are mean (SE). Asterisks indicate a significant difference from control values at the same aspiration site. Significance levels are the same as in fig 4.
Figure 5B summarises in a similar fashion luminal Pco 2 values at the proximal and distal aspiration sites. Luminal Pco 2 did not differ between the groups, either at the proximal or distal aspiration sites, and no significant change in Pco 2 between proximal and distal aspiration sites occurred in any of the three groups.
Discussion
Atropine had three major effects on duodenal HCO3 − transport: it reduced luminal HCO3 − concentration at the proximal aspiration site, it displaced the relation between HCO3 − concentration and absorption to the left, and it induced significant acidification of the luminal contents at the distal aspiration site. Net absorption of a compound is the difference between the absorptive and secretory flux, and stimulation of net absorption may therefore be due to stimulation of the absorptive flux, inhibition of the secretory flux, or a combination of the two.
Atropine inhibits the secretory HCO3 − flux in both the human proximal duodenum19 and rat jejunum,20 and this mechanism may therefore account for our findings. Theoretically, inhibition of a (normally reabsorbed) secretory HCO3 − flux with a magnitude of about 20 μmol/min per 10 cm may account for the apparent leftward displacement of the atropine curve (fig 3). Inhibition of a secretory flux with a relatively high HCO3 −concentration may also account for the reduction in HCO3 − concentration at the proximal aspiration site in the atropine group. The same mechanism would also reduce HCO3 − concentration at the distal end of the test segment which, at a constant Pco 2, would lead to an increase in luminal acidity. Inhibition of a secretory HCO3 − flux is therefore an altogether possible explanation for our findings.
There are, however, some observations that are difficult to reconcile with this interpretation. First, the secretory HCO3 − flux may be very small at the level of our test segment—that is, even total inhibition of this flux may not suffice to account for the displacement of the saturation curve in the atropine experiments. Isenberg et al 21 have directly compared the secretory HCO3 − flux in proximal and mid duodenum in humans and saw a 90% reduction from the bulb to the level of our mixing segment, which had a HCO3 − secretion rate of only 3–4 μmol/min per 10 cm. It is always difficult to interpret segmental differences between species, but data from rat jejunum suggest that the basal secretory HCO3 − flux is even lower more distally.20 In the present study, we also tried to measure the secretory HCO3 − flux by saline perfusion. HCO3 − inflow into the mixing segment was 11.2 (6.0) μmol/min, which generated a luminal HCO3 − concentration of 1.6 (0.8) mmol/l. However, despite this very low HCO3 −concentration, net HCO3 − transport in the test segment was not significantly different from zero (fig 2). If a secretory flux of any quantitative magnitude had occurred at this level, it must consequently have been totally reabsorbed.
In a saturated system, a reduced intrinsic substrate load will increase uptake of an extrinsic marker—that is, inhibition of a substantial HCO3 − secretion by the mucosa itself will be expected to enhance HCO3 − uptake from the lumen. However, the system was not saturated, as seen from the strong concentration dependence of HCO3 − absorption. It is therefore very difficult to envisage how inhibition of a minor secretory flux can account for the leftward displacement of the HCO3 − absorption curve.
A characteristic feature of HCO3 − absorption is that it is very hard to saturate. In the jejunum, Turnberget al 6 obtained only partial saturation with luminal concentrations as high as 200 mmol/l. The linear part of their saturation curve was virtually identical with our own, strongly suggesting that they were studying the same transport mechanism. An important question is whether this saturation curve fully accounts for the HCO3 − concentration decrease between the infusion site and the proximal site, or if a secretory HCO3 − flux has to be included to account for the observed concentration changes. To test this, we used the intercept of the regression line with the HCO3 −concentration of our perfusate (25 mmol/l) to estimate HCO3 − absorption in the mixing segment. The expected mean absorption rate (fig 2) will be 47/2 = 23.5 μmol/min. Mean flow rate through the mixing segment (including the pressure infusion) was 6.26 (0.19) ml/min and there was no significant net water flux (0.00 (0.15) ml/min). One consequently expects a mean luminal HCO3 − concentration at the proximal aspiration site of 25 − (23.5/6.26) = 21.2 mmol/l, which agrees almost exactly with the measured mean value (21.4 (1.4) mmol/l, table1). The most likely explanation for the relatively pronounced scatter around this mean value is interindividual differences in the degree of stirring motor activity in the mixing segment, which probably increases HCO3 − uptake by improving the contact with the absorbing epithelium.9 At least as judged from these rough calculations, HCO3 − absorption thus seems to account fully for the HCO3 −concentration changes at the proximal aspiration site.
A similar mode of calculation can also be used to estimate HCO3 − inflow into the mixing segment. At the proximal aspiration site, the mean HCO3 −“flow rate” (volume flow × [HCO3 −]) was 134 μmol/min. If the mixing segment had a similar absorption rate to the test segment—that is, 20–25 μmol/min per 5 cm, one would expect an initial mean HCO3 − inflow rate of 155–160 μmol/min. HCO3 − was infused at a rate of about 150 μmol/min—that is, only 5–10 μmol/min remain as a possible mean value for the secretory inflow into the mixing segment. Even this value, which agrees reasonably well with both Isenberg′s data21 and our own NaCl experiments (our mean value was 11.2 (6.0) μmol/min), is probably an overestimation, as this mode of calculation assumes optimal stirring conditions in the mixing segment.
In the atropine group, 10 of 13 subjects followed a regression line that was displaced about 20 μmol/min per 10 cm to the left—that is, at a given concentration, HCO3 − absorption was 20 μmol/min per 10 cm higher. The equation for this regression line gave an expected HCO3 − absorption in the mixing segment of around 35 μmol/min which, with the mode of calculation used above, should lead to a further decrease in mean proximal HCO3 − concentration value by about 3.5 mmol/l. The actually measured mean difference between controls and atropine data was 5 mmol/l (table 1). Furthermore, the three experiments in the atropine group which seemed to follow the control regression line (solid squares in fig 3) also had a proximal HCO3 − concentration which was virtually identical with the mean value in the control group. Attempts to estimate the amount of HCO3 − entering the mixing segment in the atropine group gave negative values (−12.9 (6.6) μmol/min)—that is, in the atropine group, HCO3 − absorption capacity in the mixing segment was probably even higher than in the test segment.
To conclude these numeric excursions, our data are theoretically compatible with both inhibition of HCO3 −secretion and stimulation of HCO3 −absorption, but increased affinity of the absorptive mechanism accounts for both transport and concentration data in a strikingly consistent manner.
To obtain additional information on the transport mechanisms responsible for HCO3 − absorption, we also included a small group of patients with villus atrophy in the study. The idea was that, if HCO3 − absorption depends on NHE activity in the apical membrane of villus enterocytes, one would expect villus atrophy to have the opposite effect to atropine—that is, to reduce HCO3 − absorption and to decrease H+ and CO2 formation. As a group, the patients did exhibit significantly reduced HCO3 − absorption in their test segment, but the interindividual variation was fairly large, with “normal” absorption values occurring in some subjects. The linear correlation between HCO3 − absorption and luminal HCO3 − concentration was also lost in the patients, which precluded “backward” calculation of the amount of HCO3 − entering the mixing segment. Another puzzling finding was that, despite their inability to absorb HCO3 − in the test segment, the patients had a HCO3 − concentration at the proximal aspiration site that was virtually identical with that in the controls (table 1). However, in the patients, the decrease in HCO3 − concentration was almost exactly paralleled by dilution of the volume marker—that is, the mechanism was probably increased inflow of secreted fluid with a low HCO3 − concentration into the mixing segment.22
The reason for the much larger variability in the HCO3 − transport data in the patients is not altogether clear. Prostaglandins, which are released during inflammation, stimulate HCO3 − secretion also in the distal duodenum,21 and it cannot therefore be excluded that a numerically relevant secretory HCO3 − flux may have occurred in some of the villus atrophy patients. Other possibilities are interindividual differences in the degree of villus atrophy, or simply shortcomings of our fairly crude methodology. However, it should be stressed that, despite the relatively large scatter, HCO3 −transport rate in the patient group was significantly different from that in the healthy subjects.
In all three groups, the same solution was infused at the same rate and one therefore also expects differences in HCO3 − absorption between the groups to be reflected by changes in luminal acidity and Pco 2, particularly at the distal aspiration site. Since our hypothesis was that HCO3 − is absorbed by Na+/H+ exchange, which is in turn stimulated by atropine and reduced by villus atrophy, the pattern expected from the model is increased acidity and Pco 2 at the duodenojejunal junction in the atropine group, and essentially the opposite pattern in the villus atrophy group. The actual findings were slightly different: luminal acidity did show the expected profile, but luminal Pco 2 was virtually identical in all three groups.
When interpreting changes in luminal Pco 2, one has to remember that CO2 is a very lipid-soluble gas that readily diffuses across the duodenal mucosa.23 The development of Pco 2 gradients therefore depends not only on production rate but also on factors affecting diffusion—that is, thickness and hydrophobicity of unstirred layers.24 Thus, despite a longer transport segment and a higher luminal bicarbonate concentration, Turnberget al 6 had to use coupled buffer systems and reduced perfusion rates to show a HCO3 −-induced increase in luminal Pco 2 during triple lumen perfusion of human jejunum. In a better controlled system (perfused rat jejunum in vivo), Hubel25 did see an increase in luminal Pco 2 with time if HCO3 − was present in the lumen. However, the magnitude of this increase was not significantly affected by atropine.8
The most likely explanation for the poor correlation between luminal Pco 2 and HCO3 −absorption seems to be that CO2, being a highly lipid-soluble gas, rapidly diffuses into the mucosa. The segment consequently behaves like a “Pco 2-stat” system, and changes in luminal HCO3 concentration are primarily reflected by pH changes. Provided that one accepts the “Pco 2-stat” model, the data thus suggest that atropine enhances HCO3 − absorption by a process that involves increased proton formation from the duodenal villi.
The mechanism of action of atropine remains unknown. It seems quite clear that cholinergic neurones do participate in the control of intestinal chloride secretion2 ,26-30 but in our model, we have also postulated a cholinergic inhibitory effect on the absorbing epithelium. There is actually some evidence against this hypothesis. Both intestinal villi and crypts are innervated by cholinergic neurones31 ,32 and are supplied with muscarinic receptors,33-35 but activation of enteric neurones by electrical field stimulation does not inhibit the absorptive sodium or chloride fluxes.2 Another contradictory finding is that the absorptive response to a meal was not affected by luminal administration of bupivacaine, a local anaesthetic agent.36 One clearly has to keep an open mind about the exact mechanism behind the atropine response.
In summary, our results show that, in the interdigestive state, duodenal net HCO3 − absorption is increased by atropine when given in a dose that blocks muscarinic receptors. A detailed analysis of the transport data suggests stimulation of active HCO3 − absorption as the most probable mechanism. The results are compatible with interdigestive cholinergic inhibition of villus NHE activity, but the data are far too indirect to allow this conclusion. Mechanisms for neural inhibitory control of the vectorial NHE do, however, exist1 and our results certainly encourage further search for the physiological role of this system. The isoform responsible for this vectorial Na+transport is probably NHE3, which is inhibited by high dose amiloride given from the luminal side.37 A good experiment would be to try to block the atropine response with high dose amiloride, preferably in a less complicated animal model.
Acknowledgments
This study was supported by the Medical Research Council (nos 8288, 10328). The excellent technical assistance of Irmelin Hagman and Arne Larsson is gratefully acknowledged.
Abbreviations
- MMC
- migrating motor complex
- NHE
- Na+/H+ exchanger
- PEG
- polyethylene glycol