Article Text

Abstract
BACKGROUND Activated hepatic stellate cells (HSC) are central to the pathogenesis of liver fibrosis, both as a source of fibrillar collagens that characterise fibrosis and matrix degrading metalloproteinases and their tissue inhibitors, the TIMPs.
AIMS To test the hypothesis that HSC apoptosis is critical to recovery from biliary fibrosis and that soluble growth factors may regulate HSC survival and apoptosis.
METHODS Rats (n=15) were subjected to bile duct ligation for 21 days, after which biliodigestive anastomosis was undertaken (n=13). Livers were harvested at fixed time points of recovery for periods of up to 42 days. Numbers of activated HSCs were quantified after α smooth muscle actin staining and HSC apoptosis was detected by terminal UDP-nick end labelling (TUNEL) staining and quantified at each time point. HSC apoptosis was quantified in vitro in the presence or absence of insulin-like growth factor (IGF)-1, IGF-2, platelet derived growth factor (PDGF), and transforming growth factor β1(TGF-β1).
RESULTS Following biliodigestive anastomosis after 21 days of bile duct ligation, rat liver demonstrated a progressive resolution of biliary fibrosis over 42 days, associated with a fivefold decrease in activated HSC determined by α smooth muscle actin staining. TUNEL staining indicated that loss of activated HSC resulted from an increase in the rate of apoptosis during the first two days post biliodigestive anastomosis. Serum deprivation and culture in the presence of 50 μM cycloheximide was associated with an increase in HSC apoptosis which was significantly inhibited by addition of 10 ng/ml and 100 ng/ml IGF-1, respectively (0.05>p, n=5). In contrast, 1 and 10 ng/ml of TGF-β1 caused a significant increase in HSC apoptosis compared with serum free controls (p<0.05, n=4). PDGF and IGF-2 were neutral with respect to their effect on HSC apoptosis.
CONCLUSION HSC apoptosis plays a critical role in the spontaneous recovery from biliary fibrosis. Both survival and apoptosis of HSC are regulated by growth factors expressed during fibrotic liver injury.
- hepatic stellate cells
- apoptosis
- hepatic fibrosis
- insulin-like growth factor
- transforming growth factor β1
Abbreviations used in this paper
- HSC
- hepatic stellate cell
- IGF-1 (-2)
- insulin-like growth factor 1 (2)
- TGF-β1
- transforming growth factor β1
- PDGF
- platelet derived growth factor
- BDL
- bile duct ligation
- TUNEL
- terminal UDP-nick end labelling
- FCS
- fetal calf serum
- α-SMA
- α smooth muscle actin
- DMEM
- Dulbecco's modified Eagle's medium
- TE
- tris EDTA
- [3H]-TdR
- [methyl-3H]-thymidine
- FasL
- Fas ligand
Statistics from Altmetric.com
- hepatic stellate cells
- apoptosis
- hepatic fibrosis
- insulin-like growth factor
- transforming growth factor β1
Liver fibrosis represents the common end point of the majority of chronic liver injuries.1 ,2 Ultimately, it results in distortion of the liver architecture (cirrhosis) which is associated with disturbance of liver function and significant morbidity and mortality. At the cellular level there is now a wealth of evidence indicating that the hepatic stellate cell (HSC) represents the pivot of the fibrotic process.1-3 During liver injury, HSCs undergo transformation from a retinoid rich pericyte-like cell to a myofibroblast-like cell, a process termed activation.1 ,2Highly activated HSCs are morphologically indistinguishable from myofibroblasts. The activated HSCs express collagen I and other extracellular matrix genes and are quantitatively the major source of the matrix which accumulates during fibrosis.3 ,4 During activation, HSC enter the cell cycle with the result that the hepatic matrix accumulation is the result of an overall increase in the number of HSCs in addition to changes in HSC gene expression.1-4
We have previously demonstrated that recovery from relatively advanced CCl4 induced liver fibrosis can occur in a reproducible manner.5 Recovery is associated with remodelling of the excess liver matrix resulting in restitution of near normal liver architecture. An essential element of this recovery process is apoptosis of activated HSCs.5 ,6 An understanding of the control of HSC apoptosis is important precisely because regulating this process may provide a novel therapeutic approach to the treatment of advanced hepatic fibrosis.5-7 As part of our previous study we showed that HSCs cultured from rat liver respond to absolute serum deprivation by undergoing apoptosis, indicating that activated HSCs undergo apoptosis as a default pathway, once the cell is deprived of specific survival signals. In the current study we have described the role of HSC apoptosis in a mechanistically distinct model of reversal of fibrosis (bile duct ligation followed by reanastomosis8 ,9) and have also characterised the response of activated HSCs to growth factor deprivation in detail to determine the potential roles of insulin-like growth factor (IGF)-1, IGF-2, transforming growth factor β1(TGF-β1), and platelet derived growth factor (PDGF) in acting as survival factors for HSCs. Our data support the hypotheses that HSC apoptosis is a general response in the recovery from fibrosis and that specific growth factors and cytokines may regulate survival of HSCs.
Methods
BILE DUCT LIGATION AND ANASTOMOSIS
Bile duct ligation (BDL) was undertaken in 15 male Sprague-Dawley rats exactly as previously described.9 After 21 days of BDL, 13 animals underwent a further laparotomy at which a Roux-en-Y choledochal-jejunostomy was performed to effect biliary drainage, as previously described.9 At time points before and following reanastomosis, groups of animals were killed and the liver harvested, fixed in buffered formalin, and blocked in paraffin. Livers were harvested at 21 days post BDL (peak fibrosis, n=2) and at one day (n=3), two days (n=4), seven days (n=4), and 42 days (n=2) of recovery post biliary-jejunal anastomosis. In addition, control livers subjected to a sham operation (n=4) were harvested at 21 days and included in the analysis described below.
HISTOLOGICAL ANALYSIS AND QUANTITATION OF ACTIVATED HSC DURING RECOVERY FROM BDL
Blocks containing four lobes from each fixed liver were sectioned and stained with haematoxylin and eosin, Sirius red, and reticulin. Further sections were deparaffinised and subjected to microwave antigen retrieval before being stained for α smooth muscle actin (α-SMA), as described previously.5 Afterwards, the number of α-SMA positive cells were counted in 50 random high power fields of each of the four lobes—that is, the mean number of activated HSCs per high power field was determined from 200 individual observations.
DETERMINATION OF NUMBERS OF NON-PARENCHYMAL CELLS UNDERGOING APOPTOSIS FOLLOWING BILIARY-JEJUNAL ANASTOMOSIS
Sections of each model liver were stained for DNA fragmentation characteristic of apoptosis by the terminal UDP-nick end labelling (TUNEL) reaction, as previously described,5 with the modifications recently described to reduce false positivity.10 Each slide was then analysed by a blinded observer who counted the number of non-parenchymal TUNEL positive apoptotic figures per 50 high power field (×40) per liver lobe section—that is, the mean number of apoptotic non-parenchymal cells per high power field was determined from 200 observations. Apoptotic bodies in a distribution consistent with hepatocytes were not counted. Dual staining for α-SMA and TUNEL was undertaken in representative liver sections as previously described to localise apoptosis to HSCs.5
HSC EXTRACTION AND CULTURE
HSCs were extracted from normal rat liver by sequential in situ perfusion with pronase and collagenase, as previously described.11 Cells were seeded onto uncoated tissue culture plastic in Dulbecco's modified Eagle's medium (DMEM) with 16% fetal calf serum (FCS) and grown for 10–14 days until a monolayer of myofibroblast-like activated HSCs was obtained. Cells were then trypsinised and replated onto 24 well uncoated plastic and maintained in DMEM containing 16% FCS. Experimental manipulations were performed after passaging when cells had reached 80% confluence.
QUANTIFICATION OF APOPTOSIS IN HSC CULTURE
Passaged HSCs were washed twice in serum free media before being preincubated in serum free media for one hour. Thereafter the media from the preincubation was discarded and cells were cultured for defined periods of time in serum free DMEM containing 0.1% bovine serum albumin. In each experiment parallel cells were returned to culture in media supplemented with 16% FCS. The effect of the specific growth factors on HSC survival was determined by adding predetermined concentrations of each growth factor to pairs of wells for periods of up to 24 hours. The growth factors studied were PDGF-AB (Sigma, Poole, UK), IGF-1 and IGF-2 (Peprotech, London, UK), and TGF-β1(Sigma, Poole, UK). Cells were also cultured in the presence of cycloheximide (6.25–50 μM final concentration) in the presence and absence of 16% FCS.
At the appropriate time apoptosis was quantified by inverted fluorescence microscopy after addition of acridine orange to previously undisturbed wells. The total number of normal and apoptotic cells was determined in each of three random high power fields (×100) from the centre of each well and duplicate wells were examined for each culture condition at each time point. Thus the mean rate of apoptosis for each individual experiment is based on six observations and the results presented are the mean of 3–5 independent experiments. Apoptotic cells were identified by their shrunken, absent, or budding cytoplasm, condensed budding and fragmenting nuclei, and fluorescence enhancement by condensed chromatin, as described previously.5 ,12Cells were counted first on the adherent monolayer and then in the supernatant above each field to include any detached apoptotic cells. To confirm that the cells rounding up on the surface of the monolayer were apoptotic, the loosely adherent cells from representative wells were harvested by gentle washing and a cytospin preparation was made and stained as previously described.5In addition, further preparations of the loosely adherent condensed cells were washed and harvested by centrifugation. The cellular DNA was extracted from the resulting pellet and subjected to analysis by electrophoresis, as described by Baker and colleagues,12to provide confirmatory evidence of apoptosis. To further validate the acridine orange staining method of quantifying apoptosis and to confirm the antiapoptotic affect of IGF-1, further parallel studies were undertaken. In these experiments, apoptosis was quantified using FACS analysis after staining with an anti-single stranded DNA antibody (Chemicon, Temecula, California, USA), propidium iodide staining, and annexin V binding (Calbiochem, Nottingham, UK) according to the manufacturer's instructions. In addition, caspase 3 activity was determined in cytosolic extracts from HSCs from parallel experiments using the CaspACE assay system according to the manufacturers' instructions (Promega, Chilworth, UK).
EFFECT OF SOLUBLE GROWTH FACTORS ON 3H-THYMIDINE INCORPORATION BY HSC
To examine the effects of absolute serum deprivation and exogenous growth factors on DNA synthesis under conditions identical to those used to quantify apoptosis, [methyl-3H]- thymidine ([3H]-TdR) incorporation was determined. Passaged cells grown in 24 well plates were washed three times in serum free media as described. Cultures were then incubated in serum free DMEM with 0.1% bovine serum albumin alone, or supplemented with PDGF-AB (10 ng/ml), IGF-1 (10 ng/ml), or TGF-β1 (10 ng/ml) for 19 hours. At this time 0.5 μCi [3H]-TdR (925 GBq/mmol) was added to each well as 0.5 μl [3H]-TdR in 10 μl of serum free DMEM. Cultures were then incubated for a further five hours. After incubation, [3H]-TdR incorporation was determined by scintillation counting of the cell layer as previously described.13
EFFECT OF GROWTH FACTORS ON CELL NUMBERS
To determine the net effect of growth factor manipulation on overall HSC numbers, which is a function of both cell proliferation and cell death, genomic DNA content of cell monolayers was quantified by Picogreen staining (Molecular Probes, Ireland). Passaged HSCs were cultured in 12 well plates and exposed to serum deprivation or growth factors in duplicate in an identical manner to that described above. After 24 hours of incubation, the media was removed and adherent cells were harvested by scraping into 150 μl of Tris EDTA (TE) (pH 7.5). The resulting suspension was sonicated for 15 minutes. Sonicated product (100 μl) was then diluted 1:1 with TE and mixed with 100 μl of Picogreen, prediluted 1:200 in TE. The reaction mixture was placed in wells of a 96 well plate and incubated in darkness for five minutes at room temperature. Controls of Herring sperm DNA diluted from 0 to 3 μg/ml were simultaneously prepared and analysed in parallel. The fluorescence of the samples was measured with a Cytofluor II Microwell fluorescence reader (PerSpectives Biosytems, Framingham, Massachusetts, USA) and DNA concentration of each sample determined by reference to a standard curve generated from analysis of the control DNA.
DETECTION OF Fas/FasL EXPRESSION BY HSC
HSCs have been demonstrated recently to express both Fas and Fas ligand (FasL) and the autocrine production of FasL has been suggested as an apoptotic mechanism for activated HSCs. We undertook ribonuclease protection analysis for Fas and FasL on HSC RNA. Total RNA was extracted from HSCs using the RNeasy method (Qiagen, Crawley, UK) after serum deprivation, with or without IGF-1 or PDGF treatment. The ribonuclease protection assay for Fas/FasL was undertaken as previously described.14 Riboprobes were transcribed using the rAPO-1 multiprobe template (Ambion, Oxon, UK) according to the manufacturer's instructions. The probe template contained a GAPDH control to confirm equal sample loading.
DATA ANALYSIS
Results are expressed as mean (SEM). Statistical analysis was performed using the Students' t test (two tailed). Significance was assumed when p<0.05.
Results
HISTOLOGY OF SPONTANEOUS RECOVERY FROM BILE DUCT LIGATION
The histology of the results of BDL and recovery from BDL induced fibrosis has been described in detail in a previous report.9 The result of Sirius red and reticulin staining confirmed that the collagen fibrils, which extended out from the expanded portal triads after 21 days of BDL, became progressively remodelled during the 42 days of recovery following biliary-jejunal anastomosis. At peak fibrosis (21 days following BDL) there was a highly distinct pattern of collagen apparent in the portal triads. This surrounded the proliferating bile ductules and extended into the parenchyma in places forming distinct septae linking portal triads (fig1A, B). During the 42 days of recovery following biliary-jejunal anastomosis there was progressive diminution of stainable collagen. Even after seven days of recovery the septae became less defined and the matrix surrounding the bile ductules diminished. This process continued until at 42 days there remained only remnants of collagen and matrix in the portal triads (fig 1C, D). There was no notable histological abnormality or evidence of stainable collagen in any of the sham operated control livers.

Histological analysis at peak fibrosis, 21 days after bile duct ligation (BDL). Livers harvested from animals 21 days after BDL were stained with reticulin (A, ×10) and Sirius red (B, ×20). A highly distinct pattern of matrix and collagen is apparent in the expanded portal tracts. This neomatrix extends in a septate manner into the parenchyma, in places linking portal tracts, and beginning to distort the liver architecture. Histological analysis of animals 42 days after biliary-jejunal anastomosis: following biliary-jejunal anastomosis there was a progressive diminution in the stainable collagen and matrix both within the parenchyma and adjacent to the bile ducts. At 42 days post anastomosis, reticulin staining (C, ×10) and Sirius red staining (D, ×10) demonstrated that considerable matrix remodelling had taken place with a return to near normal patterns of collagen and matrix.
SPONTANEOUS RECOVERY FROM FIBROSIS IS ASSOCIATED WITH A DECREASE IN NUMBERS OF ACTIVATED HSC
Because α-SMA is expressed by activated HSCs, immunostaining for this protein was used to detect and quantify numbers of activated HSCs.15 Fibrotic liver at 21 days was demonstrated to contain α-SMA positive cells in the region that had been previously demonstrated to be strongly stained with Sirius red. In addition, α-SMA positive cells were observed extending into the parenchyma as well as within and surrounding fibrotic bands (fig 2A). In fibrotic liver 21 days after BDL there were 14.4 (0.23) α-SMA positive cells per high power field. The number of α-SMA positive cells then progressively decreased over the 42 days of recovery (fig 2B, 2C). At all times during recovery, the distribution of α-SMA positive cells was within and extending into the parenchyma from the fibrotic bands and the areas of fibrosis surrounding the expanded portal triads. The numbers of α-SMA positive cells in the sham operated control livers were negligible (<0.5 per high power field).
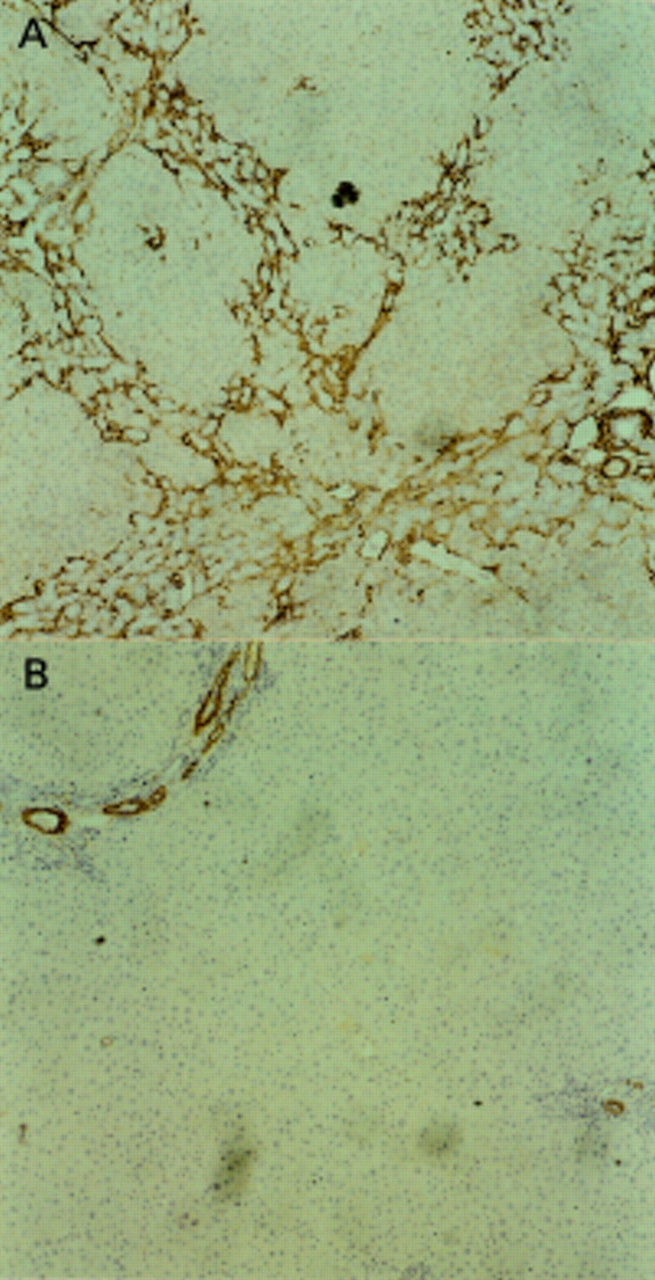

Alpha smooth muscle actin (α-SMA) staining of each liver sample was used to demonstrate activated hepatic stellate cells (HSCs). A progressive diminution of the number of positive cells was observed when fibrotic liver, 21 days after bile duct ligation (BDL), was compared with liver samples harvested after biliary-jejunal anastomosis. Representative examples are shown of α-SMA staining at peak fibrosis (21 days after BDL) (A) and after 42 days of biliary-jejunal anastomosis (B) (each at ×10). Activated HSCs are observed within and around the periportal neomatrix and around the developing fibrotic septae (A). After 42 days of recovery, residual activated HSC are present in the periportal region but are considerably diminished in number. (C) Overall results of quantification of numbers of activated HSC defined by α-SMA expression. There is progressive diminution in activated HSCs following biliary-jejunal anastomosis, but even after 42 days the number is still raised above that observed in sham operated controls.
HSC APOPTOSIS OCCURS DURING SPONTANEOUS RECOVERY FROM BILIARY FIBROSIS
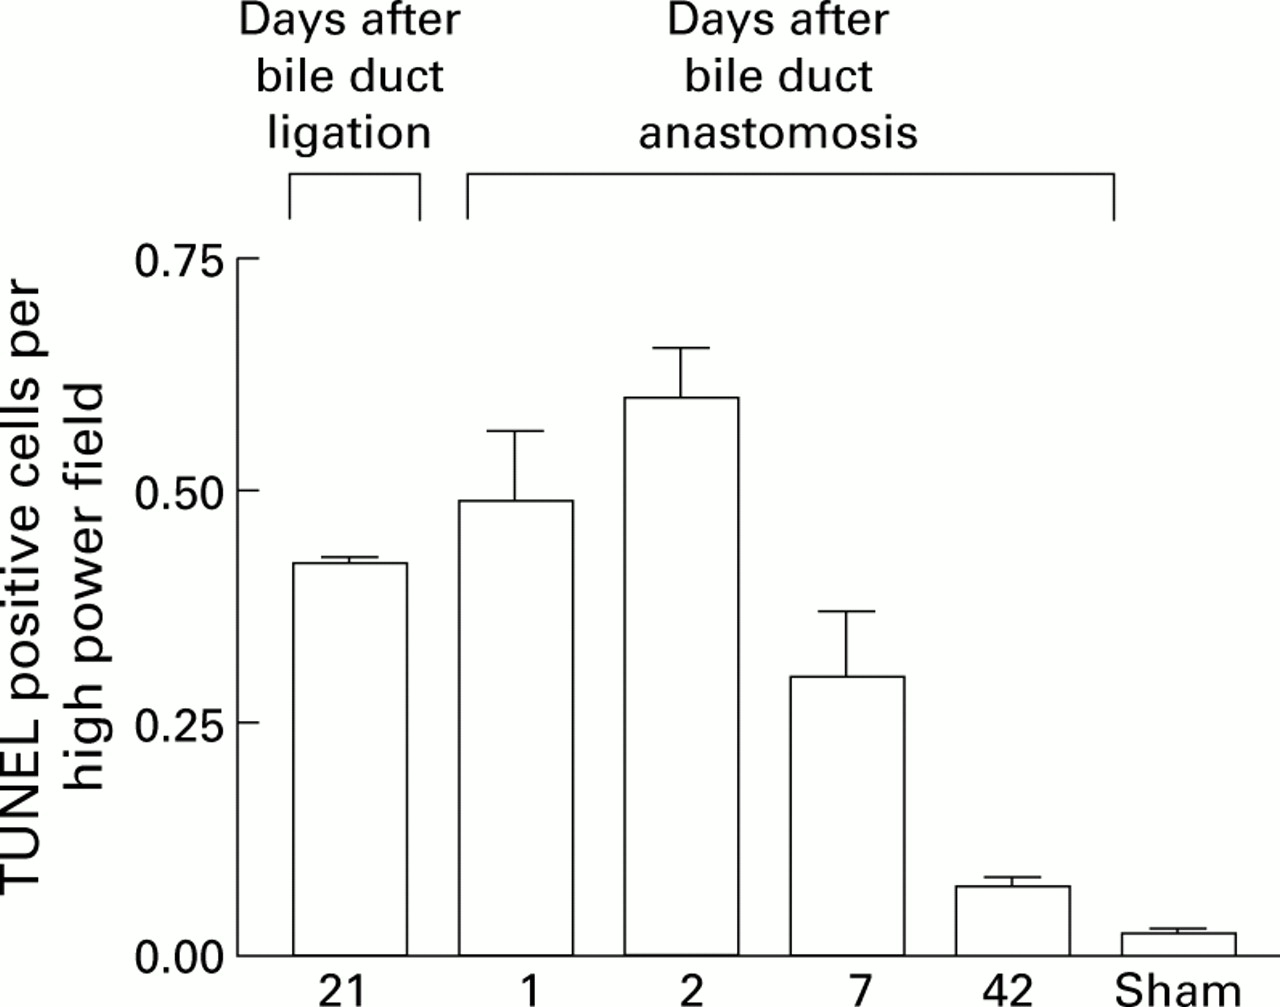
Liver sections were dual stained for TUNEL and α-SMA. TUNEL positive condensed nuclei in the distribution of the collagen fibrils, demonstrated by Sirius red and reticulin staining, were demonstrated to be within the α-SMA positive cells (fig 3). Moreover, there was no evidence of necrosis in α-SMA positive cells. These data strongly support the hypothesis that HSC apoptosis is occurring during spontaneous recovery from fibrosis. The rate of apoptosis in non-parenchymal cells during recovery from fibrosis was quantified by direct cell counting of TUNEL positive nuclei. These were counted only around collagen fibrils—that is, in the regions demonstrated to have the highest density of α-SMA positive cells, as described above. At 21 days after BDL, there were 0.45 (0.02) TUNEL positive nuclei per high power field which increased after two days of recovery before falling progressively to 0.08 (0.01) TUNEL positive nuclei per high power field on day 42 (fig 4). There were negligible numbers of TUNEL positive cells in the sham operated control livers.
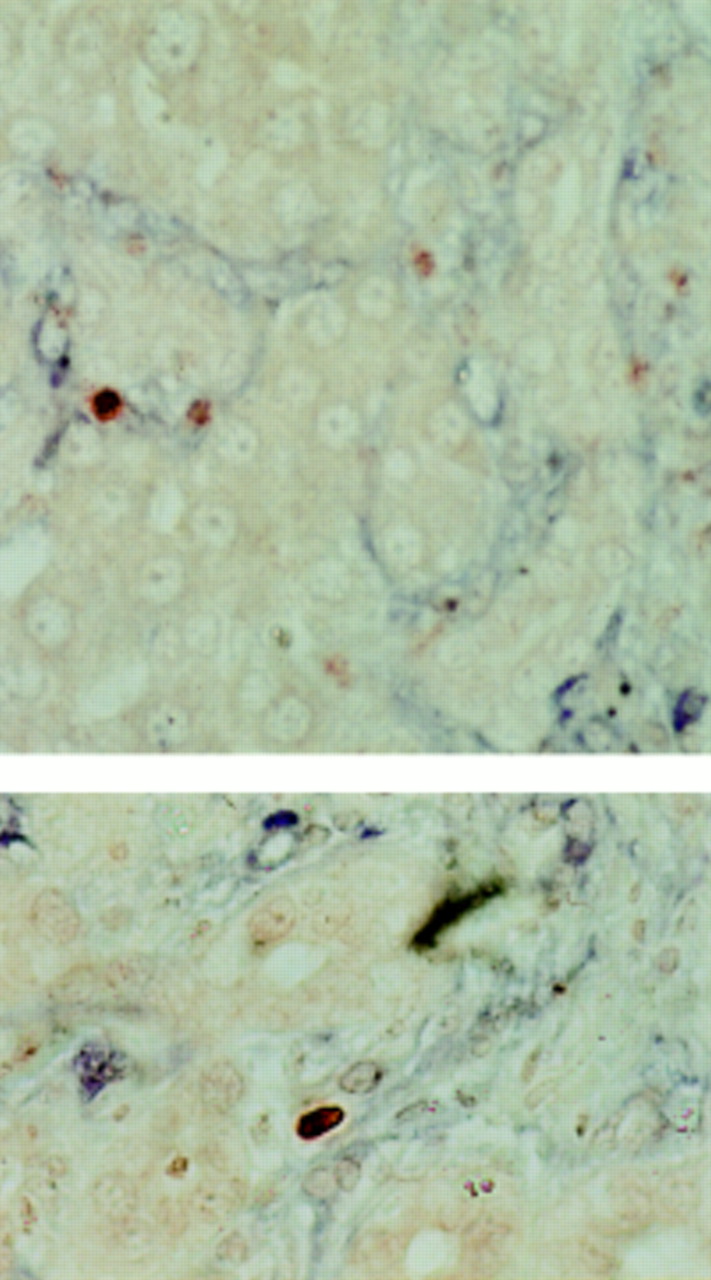
Two examples of apoptotic hepatic stellate cells (HSCs) demonstrated by dual terminal UDP-nick end labelling (TUNEL) and α smooth muscle actin (α-SMA) staining. Liver sections at two days after biliary-jejunal anastomosis were dual stained with α-SMA and TUNEL. Non-parenchymal TUNEL positive cell nuclei (red) demonstrating the characteristic condensation and halo are observed within the α-SMA positive cells (blue), indicating that the apoptotic nuclei lie within activated HSCs (×40).

Quantification of non-parenchymal cell apoptosis during recovery from bile duct ligation (BDL). Terminal UDP-nick end labelling (TUNEL) positive non-parenchymal cell apoptotic bodies in a distribution consistent with activated hepatic stellate cells (HSCs) were quantified as described in the methods both before and after biliary-jejunal anastomosis. The results indicated that the first two days following biliary reanastomosis are associated with an increase in apoptosis, which coincides with the observed diminution in activated HSCs.
ACTIVATED HSC UNDERGO APOPTOSIS FOLLOWING SERUM DEPRIVATION
Apoptosis in cultured HSCs was quantified in vitro by staining with acridine orange and counting under fluorescence (as demonstrated in fig 5A). In addition, to confirm that these condensed cells had undergone apoptosis, they were harvested by gentle washing, prepared as a cytospin, and Giemsa stained (fig 5B). DNA was extracted from further preparations. The DNA thus obtained demonstrated the laddering that results from oligonucleosomal fragmentation and is considered to be characteristic of apoptosis (fig5C). By determining the rate of apoptosis at predetermined times after serum withdrawal, as described above, we demonstrated that deprivation of growth factors was associated with a significant increase in HSC apoptosis at 6, 24, and 72 hours (fig 6). Cycloheximide has been reported to enhance serum deprivation induced apoptosis in a variety of cell types,12 ,16 therefore a further experiment was conducted in which 6.25–50 μM cycloheximide was added to the serum free media. Cycloheximide induced a concentration dependent increase in apoptosis compared with serum withdrawal alone, which was maximally effective at 50 μM (data not shown).
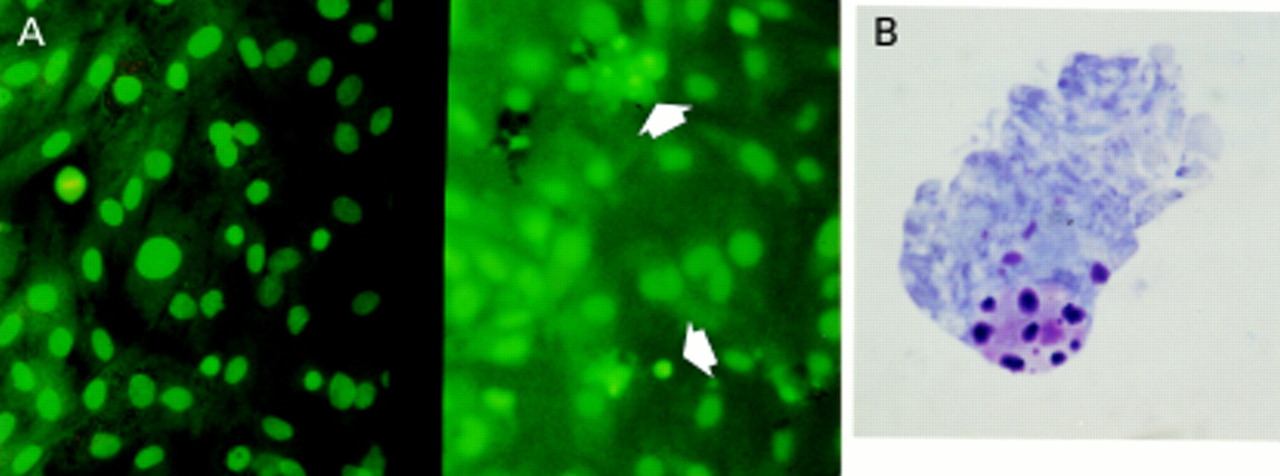

Acridine orange staining illustrating normal and apoptotic activated hepatic stellate cells (HSCs). (A) Representative fields from passaged HSC incubated for four days in media with 16% serum (left) and in serum free conditions (right). Normal HSC have large pale nuclei and orange tinged cytoplasm (the result of RNA staining). Apoptotic HSC are distinct with brightly condensed chromatin with shrunken or absent cytoplasm; two of several examples are arrowed. Apoptotic cells lift off from the monolayer, therefore to focus on these the monolayer falls below the plane of focus. Mitotic figures are also identifiable with this method (left field). Giemsa stain of cytospin preparation of condensed HSC: after exposure to conditions of absolute serum deprivation as described in the methods, the condensed rounded up cells on the monolayer surface, corresponding to the cells counted after acridine orange staining, were harvested by gentle washing and prepared as a cytospin, before being Giemsa stained. The cells demonstrated clear evidence of chromatin condensation and fragmentation, and blebbing; a representative example is given in (B). DNA analysis of the condensed and rounded up cells was undertaken as described in the methods and demonstrates the characteristic laddering associated with apoptosis (C).

Effect of prolonged serum deprivation on hepatic stellate cell (HSC) apoptosis. Rat HSCs were washed three times and incubated for 6, 24, and 96 hours in media with no additives (0% fetal calf serum (FCS)) or returned to media with 16% FCS. After incubation, the number of apoptotic cells was counted and expressed as a percentage of the total cell number per field (mean (SEM), n=7; *p<0.05, **p<0.01 for 0% FCS v 16% FCS at the same time point by paired t test).
IGF-1 BUT NOT PDGF OR IGF-2 RESCUES HSCs FROM APOPTOSIS INDUCED BY SERUM DEPRIVATION
The effect of serum withdrawal suggested that growth factors were important regulators of HSC apoptosis in culture. To explore this concept further we undertook a series of experiments to examine the effect of the growth factors IGF-1, IGF-2, TGF-β1, and PDGF on HSC apoptosis, as these are expressed during fibrotic injury. Incubation of HSC with IGF-1 in serum free media in concentrations of 0.1–10 ng/ml for 24 hours was associated with a modest but consistent dose dependent reduction in apoptosis compared with parallel cultures maintained serum deprived; similar results were obtained after six hours of exposure. This effect was significant at 1 and 10 ng/ml (fig 7A). In parallel studies, the effect of IGF-1 (10 mg/ml) in reducing apoptosis relative to serum free and serum free with cycloheximide (50 μM) control cultures was determined by caspase 3 activity. Relative to controls, IGF-1 reduced caspase 3 activity by 22% in serum free conditions, and by 80% in serum free conditions in the presence of 50 μM cycloheximide. Further studies using quantitative FACS analysis of IGF-1 treated HSCs relative to serum free controls after staining with an anti-single stranded DNA antibody, annexin V binding assays, and propidium iodide staining demonstrated a similar reduction in apoptosis relative to controls in the presence of IGF-1 (data not shown). Incubation of HSCs with IGF-2 (0.125–12.5 ng/ml) or PDGF (0.1–100 ng/ml) resulted in no significant change in apoptosis (22.9 (3.6)% in serum free controlsv 20.7 (3.1)% in cells incubated with 12.5 ng/ml IGF-2, n=3; and 23.8 (3.5)% in serum free controlsv 22.1 (3.1)% in cells incubated with 100 ng/ml PDGF; n=4). Similar results were obtained after six hours of exposure. The addition of IGF-1 to HSCs incubated in serum free conditions in the presence of cycloheximide also significantly protected HSCs from apoptosis after 24 hours of incubation, although the concentration of IGF-1 required to be significantly effective in this context was 100 ng/ml (fig 7B).
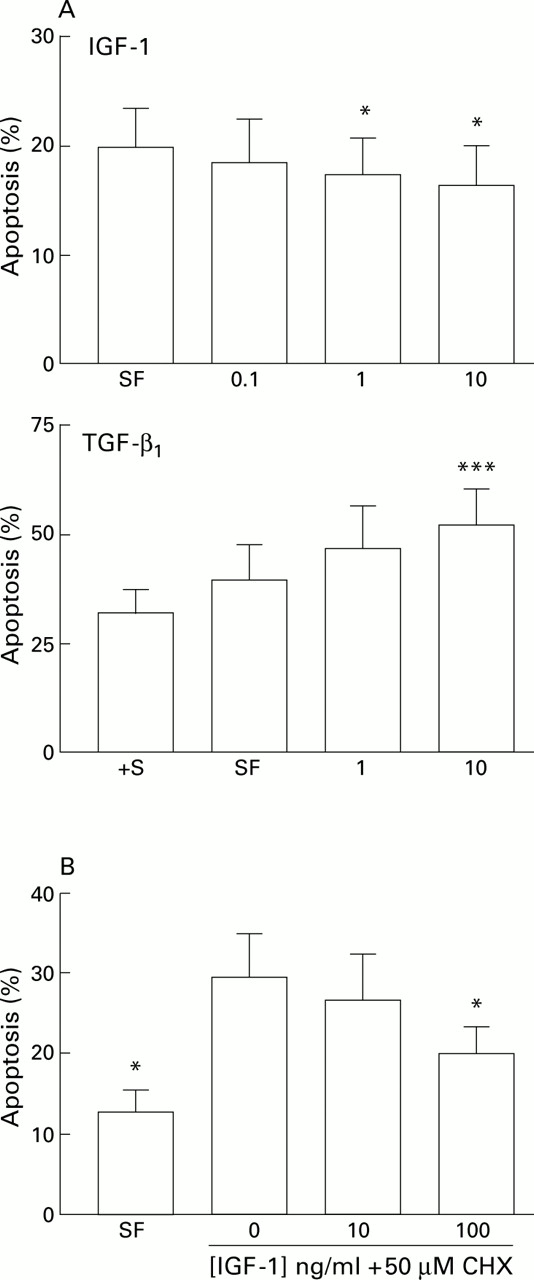
(A) Effect of specific growth factors on hepatic stellate cell (HSC) apoptosis. Effect of insulin-like growth factor 1 (IGF-1) and transforming growth factor β1(TGF-β1) on serum deprivation induced apoptosis of rat HSCs. For each concentration of growth factor (x axis, ng/ml) the percentage of cells demonstrating an apoptotic morphology after staining with acridine orange is expressed as mean (SEM). For the IGF-1 experiments, counting was undertaken after 24 hours (n=5, *p<0.05 v no additives by paired t test). For the TGF-β1 experiments, counting was undertaken after six hours (***p<0.001 by paired t test, n=4). †S, serum containing media. (B) Effects of IGF-1 on cycloheximide induced apoptosis of rat HSCs. Washed rat HSC cultures were incubated for six hours in media with no additives, or media supplemented with 50 μM cycloheximide (CHX) with or without IGF-1. The percentage of cells undergoing apoptosis detected by acridine orange staining is given as mean (SEM) (n=4). *p<0.05 for IGF-1 treated cultures v cycloheximide alone by paired t test. SF, serum free.
The addition of TGF-β1 (10 ng/ml) to serum deprived HSC cultures resulted in a 40% increase in apoptosis relative to serum deprived controls (n=4) which was significant at concentrations of both 1 and 10 ng/ml; this effect was maximal at six hours of exposure (fig7A).
IGF-1 INDUCES AN INCREASE IN HSC NUMBERS BY PROMOTING SURVIVAL
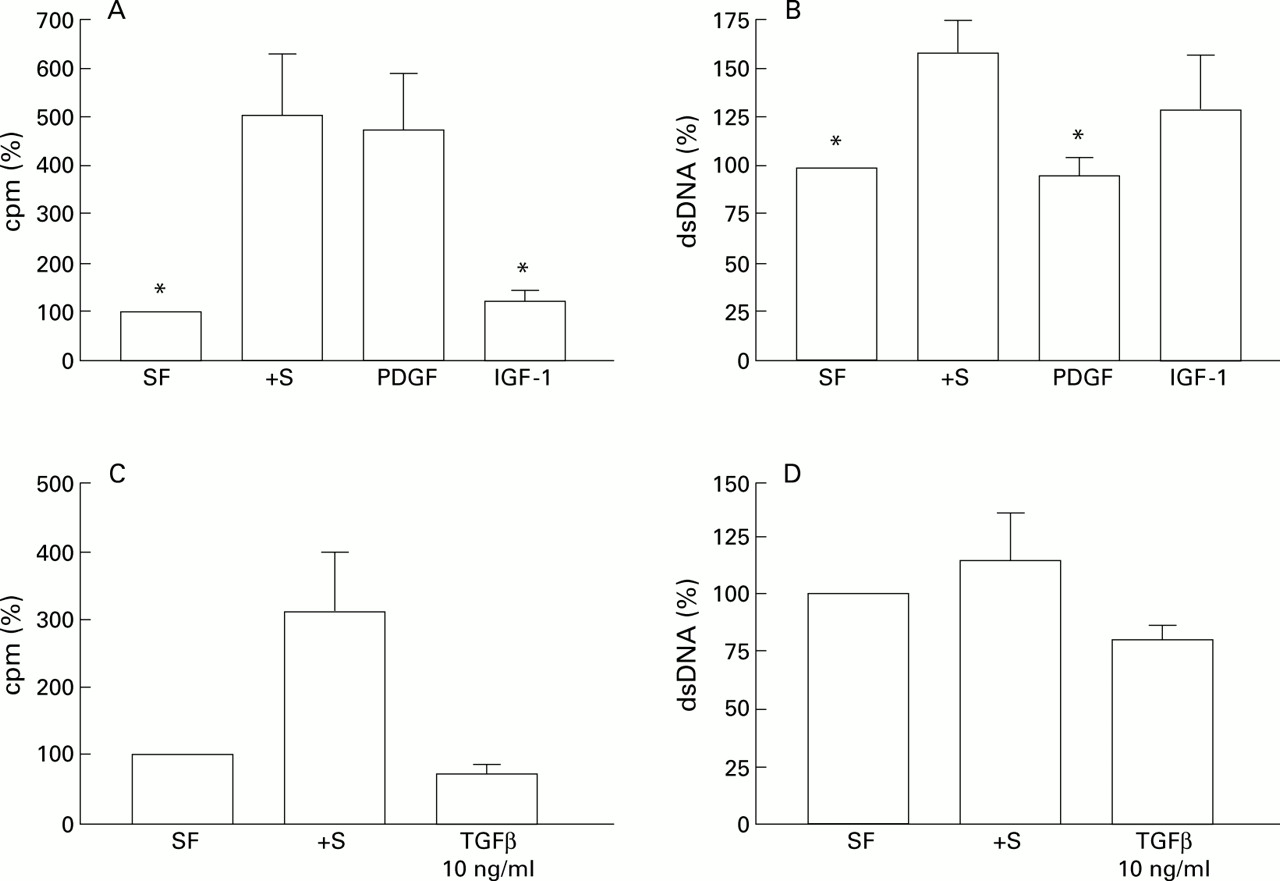
To determine the effect on HSC proliferation and number when cultures were incubated with specific growth factors, further experiments were undertaken in which HSC were exposed to IGF-1 or PDGF for 24 hours and the rate of proliferation and DNA concentration (as an index of overall cell numbers) were determined. As previously anticipated, both serum and PDGF were effective mitogens (fig 8A). In contrast, IGF-1 was not mitogenic. Indeed, there was no significant difference in the rate of proliferation observed with PDGF compared with serum, whereas proliferation was significantly reduced after incubation with IGF-1 compared with serum (fig 8A). When total DNA concentration was analysed in parallel wells to act as an indicator of changes in cell numbers, in comparison with cultures maintained in serum free conditions alone, FCS induced the greatest increase in cell numbers (fig 8B). IGF-1 induced a similar increase in cell number. However, the increase in cell number observed with PDGF was minor in comparison with serum or IGF-1. These data suggest that inhibition of apoptosis is a major contributor to the increase in HSCs in culture models. Incubation of HSCs with TGF-β1 resulted in a reduction in proliferation (fig 8C) and a 30% decrease in total DNA content reflecting a net decrease in HSC numbers relative to serum deprived controls (fig 8D).
(A) Effect of growth factors on3H-thymidine incorporation. After washing, rat hepatic stellate cells (HSCs) were cultured in DMEM with no additives (serum free (SF)), 16% fetal calf serum (FCS) (+S, positive control), or specified growth factors for 24 hours, and the rate of3H-thymidine incorporated was determined as described. Results are expressed relative to control cultures (no additives, SF) which were given the arbitrary value of 100% (n=4, *p<0.05 relative to 16% FCS containing cultures by paired t test). (B) Effect of growth factors on total DNA of cultures of rat HSCs. Washed cultures of rat HSCs were incubated for 24 hours in DMEM with no additives (SF) or supplemented with 16% FCS (+S, positive control) or growth factors as shown and the total DNA concentration of each cell suspension was determined as described in the methods. Results are expressed relative to control cultures (no additives, SF) which were given the arbitrary value of 100% (n=4, *p<0.05 relative to 16% FCS containing cultures by paired t test). (C, D) Effect of transforming growth factor β1 (TGF-β1) on HSC proliferation and total DNA content, respectively, were analysed as described and are represented relative to control cultures (no additives, SF) which have been given the arbitrary value of 100%.
RIBONUCLEASE PROTECTION ASSAY DETECTION OF Fas/FasL
There was no difference in FasL mRNA expression relative to GAPDH in cultures maintained for 24 hours serum free, or treated with IGF-1 (10 ng/ml) or PDGF (10 ng/ml). In the same assays, Fas mRNA was not detected (n=2; data not shown).
Discussion
The data presented in this paper demonstrate evidence of the critical role of HSC apoptosis in the spontaneous recovery from liver fibrosis. By showing that HSC numbers decrease during recovery and by providing clear evidence of HSC apoptosis in a model which is mechanistically distinct from that described in our previous report,5 we conclude that HSC apoptosis is a vital mechanism that contributes to recovery from hepatic fibrosis regardless of aetiology. Moreover, as we have previously discussed, there are clear paradigms of these observations in the form of case reports of human fibrotic disease in vivo.17 ,18
α Smooth muscle actin, an intermediate filament protein that is expressed by activated HSC and is widely accepted to be a marker of activation, was used to identify and quantify activated HSCs. By staining the BDL liver before and after reanastomosis we demonstrated that the high numbers of activated HSCs present at peak fibrosis rapidly diminished while remodelling of the fibrosis occurred and a more normal architecture was restored. Indeed, during the first week following reanastomosis there was a fivefold diminution in activated HSC numbers. The diminution of HSCs was not associated with an increase in inflammatory activity and specifically there was no evidence of necrosis, and therefore we tried to establish if there was evidence to indicate that the HSC loss was mediated by apoptosis.
In our initial studies, dual staining of representative samples of BDL liver which had undergone reanastomosis with TUNEL and α-SMA consistently demonstrated morphologically apoptotic, TUNEL positive nuclei within α-SMA positive cells, providing strong evidence for the presence of HSC apoptosis. We therefore established a series of experiments to quantify HSC apoptosis following BDL induced fibrosis and biliary reanastomosis. As before,5 we undertook TUNEL staining and α-SMA staining independently on sequential liver sections as this method allows optimal conditions to be used for each stain. We then applied strict morphological criteria to the quantification of TUNEL positive apoptotic bodies. Only those apoptotic bodies which were TUNEL positive and lay within the areas of fibrosis in the expanded portal triad were counted. Reference to sections stained in parallel for α-SMA indicated that the cells in these areas were largely activated HSCs. The results indicate that there is a background rate of apoptosis in fibrotic livers 21 days after BDL; these represent between 1% and 3% of the α-SMA positive HSC population. Following reanastomosis there is a clear increase in the rate of apoptosis over 48 hours. Although the absolute number of apoptotic figures remains small and never represents at maximum more than 8% of the total HSC population, an increase in the rate of apoptosis, particularly in association with either a constant rate of HSC proliferation or a reduction in HSC proliferation, was associated with a dramatic overall reduction in HSC numbers in the liver. As the total time for apoptosis to eliminate a single cell may be as little as 20 minutes,12 these results also serve to emphasise that the HSC pool is dynamic and overall numbers reflect changes in the rate of apoptosis in addition to representing changes in the rate of proliferation, a feature emphasised in our cell culture studies. Interestingly, the chronology of HSC apoptosis differs from that observed in biliary epithelial cells during BDL recovery, suggesting cell specificity in response to individual survival signals.9
We had previously proposed that apoptosis might be a default pathway for activated HSCs unless specifically signalled to survive by physical (matrix) or soluble (cytokine and growth factor) agents. To investigate this hypothesis and to complement our studies of the in vivo recovery models we have undertaken a detailed characterisation of the response of HSCs to serum deprivation in the presence and absence of specific growth factors.
Apoptosis was quantified in vitro by direct cell counting under fluorescence illumination after acridine orange staining. We and others have consistently demonstrated that in fibroblast, HSC, and myofibroblast cultures, the rounded up condensed cells on the monolayer surface demonstrate features of apoptosis morphologically and demonstrate the specific nuclear changes of apoptosis.5 ,12 ,19 To further validate this technique we have harvested the condensed cells from the monolayer surface and showed that the DNA demonstrates the laddered pattern that results from oligonucleosomal fragmentation which is characteristic of apoptosis.19 ,20 In further experiments we used caspase activity assays and quantitative FACS analysis after annexin V binding and propidium iodide staining to confirm the increase in apoptosis seen in serum deprivation.
Acridine orange staining demonstrated that absolute serum deprivation increased the rate of apoptosis above that observed in HSC in serum containing media, supporting the hypothesis that specific growth factors may promote HSC survival. However, even in conditions of absolute serum deprivation for up to three days, the absolute level of apoptosis never rose above 25% for HSCs 72 hours post passage or 50% for cells 24 hours post passage. This suggests that other influences, stage of the cell cycle, cell-matrix and cell-cell interactions, autocrine factors, or combinations of these may also influence HSC survival in this model. Moreover, mitotic figures were observed in the serum deprived cultures indicating that this treatment did not halt cell proliferation in highly activated HSCs. Therefore, a possible explanation for the relatively constant rate of apoptosis after serum deprivation is that cells have to be entering the growth cycle to be susceptible to apoptosis. Incubation with cycloheximide has been reported to increase apoptosis in a variety of cell types12 ,16 and was associated with a concentration dependent increase in HSC apoptosis which reached 100% after 24 hours in 50 μM cycloheximide.
Both IGF-1 and PDGF have been reported to promote HSC growth; they and their respective receptors are expressed by HSC. During liver injury they may act in a paracrine (from hepatocytes and Kupffer/infiltrating inflammatory cells, respectively) and an autocrine manner.21-23 We therefore incubated HSCs in the presence of increasing concentrations of these growth factors in the absence of serum. Our results demonstrate that IGF-1 but not PDGF promotes HSC survival. Incubation of HSC with IGF-1 was associated with a highly reproducible although modest reduction in apoptosis in concentrations of 10 and 1 ng/ml. In contrast, PDGF had no consistent effect on apoptosis. IGF-1 also proved to effectively inhibit apoptosis in the presence of cycloheximide although a higher concentration (100 ng/ml) was required to achieve this effect than with cultures in serum free media alone. Taken together these data suggest that IGF-1 is a candidate mediator promoting HSC survival during injury, an effect which has been documented in a series of cell systems.24-27 It also provides a mechanism in wounding in which the epithelium (hepatocyte) may directly regulate the survival of the wound healing myofibroblast (HSC) in a paracrine manner.21 ,28 While maximum inhibition of apoptosis of 20% induced by IGF-1 appears small, it has been suggested that IGF-1 mediated inhibition of apoptosis is somewhat underestimated by in vitro work because more profound effects have been observed in experimental manipulations in vivo.26 ,27 In contrast with IGF-1, TGF-β1 actually increased apoptosis. As TGF-β1 is a powerful profibrogenic stimulus to HSCs, this observation suggests that the same cytokine may simultaneously limit the survival of matrix sythesising HSCs.
Expression of Fas and FasL has recently been demonstrated in HSCs.6 ,29 FasL mRNA was not regulated by either IGF-1 or PDGF exposure when assayed by ribonuclease protection, and Fas mRNA was not detectable using this method. This may suggest that the antiapoptotic effect of IGF-1 was not due to a decrease in FasL (a proapoptotic ligand) but by some other, as yet, unidentified mechanism. In our model, as in the previous FasL mediated model reporter by Gong and colleagues,29 cycloheximide appears to promote HSC apoptosis. One possible explanation is that inhibition of a critical autocrine or intracellular survival factor is necessary to prime highly activated HSCs for apoptosis through growth factor withdrawal or TNF receptor superfamily (Fas and related receptors) stimulation.
As the overall cell number in a tissue reflects the net effect of proliferation in addition to apoptosis/death, we determined the impact of our manipulations of culture conditions on proliferation and total HSC number. In these studies experiments were performed in an identical manner to those in which apoptosis was quantified and without cell cycle coordination. The 4.8-fold increase in 3H-thymidine seen with PDGF is consistent with the well described mitogenic effects of this cytokine28 and contrast markedly with the lack of effect on apoptosis. Exactly the converse was observed with IGF-1; a marginal effect on proliferation was observed (1.2-fold increase) in contrast with the significant effect on apoptosis. Viewed with the data on total DNA, where incubation with IGF-1 was associated with a 38% increase, these results emphasise the importance of survival as a mechanism to promote an overall increase in HSC numbers.
Compared with cultures returned to serum containing media, all serum free experimental conditions showed a reduction in cell number, as determined by DNA concentration. Cultures supplemented with PDGF contained a similar number of cells suggesting that cell loss must have occurred simultaneously and reinforcing the observation that the number within the HSC pool is a dynamic function of proliferation and apoptosis. In fact there is evidence that PDGF is proapoptotic for fibroblasts in conditions of low serum.30 In physiological terms it is logical to propose that such a potent inducer of proliferation should not concurrently inhibit apoptosis—this combination of events is a classical feature of tumorigenesis. Rather, that HSC proliferation and apoptosis are independently controlled and that the net cell number reflects the overall balance of these cell fates.
We have described HSC apoptosis in the spontaneous recovery from BDL induced hepatic fibrosis. These data together with our previous report provide strong evidence for the critical role of apoptosis of HSCs in spontaneous recovery from liver fibrosis. We have also demonstrated that IGF-1 is a potent inhibitor of HSC apoptosis in vitro and may function in disease to regulate the increase in the pool of activated HSC. In contrast, PDGF promotes proliferation but is neutral with respect to HSC apoptosis while TGF-β1 was observed to increase apoptosis. These data are consistent with a model in which HSC apoptosis results from changes in the balance of pro and antiapoptotic influences which impinge on the cell and are regulated independently of proliferative influences.
Acknowledgments
JPI is an MRC UK senior clinical fellow. The support of the Wessex Medical Trust and Bayer AG are gratefully acknowledged. This study was also supported by a grant from the Swiss National Foundation for Scientific Research (45349.95) to JR.
Conflict of interest. This work was supported by Bayer AG.
Abbreviations used in this paper
- HSC
- hepatic stellate cell
- IGF-1 (-2)
- insulin-like growth factor 1 (2)
- TGF-β1
- transforming growth factor β1
- PDGF
- platelet derived growth factor
- BDL
- bile duct ligation
- TUNEL
- terminal UDP-nick end labelling
- FCS
- fetal calf serum
- α-SMA
- α smooth muscle actin
- DMEM
- Dulbecco's modified Eagle's medium
- TE
- tris EDTA
- [3H]-TdR
- [methyl-3H]-thymidine
- FasL
- Fas ligand