Article Text

Abstract
Background and aims: A reliable non-invasive assessment of the severity of diffuse liver disease is much needed. We investigated the utility of hepatic vein transit times (HVTT) for grading and staging diffuse liver disease in a cohort of patients with hepatitis C virus (HCV) infection using an ultrasound microbubble contrast agent as a tracer.
Materials and methods: Eighty five untreated patients with biopsy proven HCV induced liver disease were studied prospectively. All were HCV RNA positive on polymerase chain reaction testing. Based on their histological fibrosis (F) and necroinflammatory (NI) scores, untreated patients were divided into mild hepatitis (F ⩽2/6, NI ⩽3/18), moderate/severe hepatitis (3 ⩽F <6 or NI ⩾4), and cirrhosis (F = 6/6) groups. In addition, 20 age matched healthy volunteers were studied. After an overnight fast, a bolus of contrast agent (Levovist) was injected into an antecubital vein and spectral Doppler signals were recorded from both the right and middle hepatic veins for analysis. HVTTs were calculated as the time from injection to a sustained rise in Doppler signal >10% above baseline. The Doppler signals from the carotid artery were also measured in 60 patients and carotid delay times (CDT) calculated as the difference between carotid and hepatic vein arrival times. The earliest HVTT in each patient was used for analysis.
Results: Mean (SEM) HVTT for the control, mild hepatitis, moderate/severe hepatitis, and cirrhosis groups showed a monotonic decrease of 38.1 (2.8), 38.8 (2.4), 26.0 (2.4), and 15.8 (0.8) seconds, respectively. Mean (SEM) CDT for the control, mild hepatitis, moderate/severe hepatitis, and cirrhosis patients again showed progressive shortening of 30.3 (2.6), 25.9 (2.6), 14.8 (2.1), and 5.6 (1.2) seconds, respectively. There were significant differences between the groups for HVTT (ANOVA, p<0.001) and CDT (ANOVA, p<0.001). There was 100% sensitivity and 80% specificity for diagnosing cirrhosis and 95% sensitivity and 86% specificity for differentiating mild hepatitis from more severe liver disease.
Conclusion: We have shown, for the first time, that HVTT using an ultrasound microbubble contrast agent can assess HCV related liver disease with clear differentiation between mild hepatitis and cirrhosis. There were significant differences between these two groups and the moderate/severe hepatitis group. CDT offers no additional benefit or greater differentiation than HVTT and can be omitted, thus simplifying this technique. HVTT may complement liver biopsy and may also be a useful alternative for assessment of liver disease in patients who have contraindications to biopsy.
- ALT, alanine aminotransferase
- AST, aspartate aminotransferase
- APRI, ratio of serum AST/platelet count
- CDT, carotid delay time
- F, fibrosis
- HCV, hepatitis C virus
- HVTT, hepatic vein transit time
- NI, necroinflammatory
- PCR, polymerase chain reaction
- ultrasound
- microbubbles
- hepatitis C
- liver
- tracer studies
- functional studies
Statistics from Altmetric.com
- ALT, alanine aminotransferase
- AST, aspartate aminotransferase
- APRI, ratio of serum AST/platelet count
- CDT, carotid delay time
- F, fibrosis
- HCV, hepatitis C virus
- HVTT, hepatic vein transit time
- NI, necroinflammatory
- PCR, polymerase chain reaction
Chronic liver disease is a major health problem worldwide with 1–3% of the population in the developed world chronically infected with hepatitis C virus (HCV) and carriage rates in other countries reaching up to 35%.1,2 Estimation of the degree of hepatic fibrosis is important for diagnostic and therapeutic management of these patients and at present liver biopsy is the only accepted test.1–6 However, only a small fraction of the liver parenchyma is sampled and the biopsy procedure is associated with significant patient morbidity and a small but definite risk of mortality.5,6 Hence the development of a non-invasive technique for assessing liver disease is much needed.
Ultrasound, which is widely available around the world, is frequently the first imaging investigation but unfortunately it, in common with other imaging tests, is unreliable as an accurate means of assessing disease severity.7,8,9,10,11 A number of Doppler based methods have been developed, mainly to measure the relative flow or velocity in the hepatic artery or vein and the portal vein.12,13 However, there is controversy with regard to the reproducibility of these studies and many do not permit investigation and grading of precirrhotic liver disease.14–16 We have recently described an alternative method in which the relative transit time through the splanchnic bed of a bolus of microbubbles is measured.17,18 In that series of 39 patients with a variety of liver diseases predisposing to fibrosis and cirrhosis, hepatic vein transit times (HVTTs) using the microbubble agent Levovist (Schering AG, Berlin, Germany) allowed distinction between fibrosed and non-fibrosed livers, in addition to allowing distinction between fibrosis and cirrhosis. However, this study was limited in that it assessed a diverse group of patients without a standard histological classification, so that a clear differentiation of the severity of fibrosis in precirrhotic disease was not possible. The current study therefore concentrates on the question of whether this technique could accurately grade the severity of precirrhotic liver disease from a single disease entity. We thus focused on a cohort of patients with HCV related liver disease. Results were correlated with the Ishak histological grading and staging system.3
MATERIALS AND METHODS
Patient population
The study population comprised 85 patients (51 males, 34 females) with biopsy proven HCV related liver disease. Their mean age was 47 (range 26–67) years. All patients had positive polymerase chain reaction (PCR) tests to HCV RNA, indicating active viraemia. In the precirrhotic group, the average time from biopsy to HVTT was 9.3 months (median 5) and in the cirrhosis group the mean time was 14.6 months (median 6).
The 85 patients were treatment “näive”, having had neither interferon nor ribavirin previously. The reference population for HVTT data comprised 20 healthy volunteers (nine males, 11 females) of mean age 39.3 (range 23–57) years. All subjects consumed less than 20 g of alcohol daily and none was taking regular medication. The study conformed to the guidelines outlined by the 1975 Declaration of Helsinki and permission was obtained from the Ethics Committees of Imperial College London at the Hammersmith Hospital, London (REC 98/5471). Written informed consent was obtained from all patients and healthy volunteers who were studied.
Blood profiles
Serum biochemical markers of liver function, including aspartate aminotransferase (AST), alanine aminotransferase (ALT), γ-glutamyl transpeptidase, and other haematological markers, such as platelet count, were collected retrospectively and timed to be as close to the date of liver biopsy and the ultrasound examination as possible. The ratio of AST to platelet count (APRI) was calculated in each case, as this has recently been considered to be a non-invasive marker of fibrosis in hepatitis C.19,20 The AST to ALT ratio was also calculated. Full biochemical data were only available for 30 patients. Genotyping of HCV RNA was also only available on a selected number of patients and was only performed on those who were going to receive interferon treatment. Of these, eight were genotype 1, one was genotype 2, two were genotype 3, and two were genotype 4.
Histological grading and staging (Ishak system)
All liver biopsies were read by a single independent liver pathologist (RDG) who was blinded to the results of the HVTT and other clinical data, and assessed for necroinflammation and fibrosis. They were scored according to the Ishak (modified histological activity index) system.3 Subdivision of these patients into mild and moderate/severe disease was based on the Ishak fibrosis (F) and necroinflammatory (NI) scoring system: mild hepatitis (F ⩽2/6 and NI ⩽3/18) and moderate/severe hepatitis (3< F <6 or NI ⩾4). This subdivision was used because it corresponded with the histological separation used in the current UK algorithm recommended for managing patients with HCV related liver disease.1
HVTT and CDT
All patients were fasted overnight or for a minimum of six hours prior to the ultrasound study to reduce variations in splanchnic flow, which could be attributed to digestion. The method of measuring HVTT is illustrated in fig 1, and is similar to that described in previous studies.17,18 A continuous spectral Doppler trace of a hepatic vein was obtained with the patient in gentle respiration using a machine known to produce good Doppler traces (Sequoia; Siemens, Acuson, Mountain View, California, USA). Simultaneously, a small continuous wave ultrasound probe (Huntleigh Diagnostics, Cardiff, UK) was placed over the carotid artery of the patient. Doppler signals from both the hepatic vein and carotid artery trace were recorded using a standard PC via the stereo audio line input. The software to perform both the acquisition and subsequent analysis was written by one of the authors (RJE) in MATLAB (The Mathworks, Massachusetts, USA) (see below).

Diagrammatic representation of the technique employed to measure hepatic vein transit time and carotid arterial arrival time after injection of a 2 g bolus of the microbubble contrast agent Levovist. CW, continuous wave.
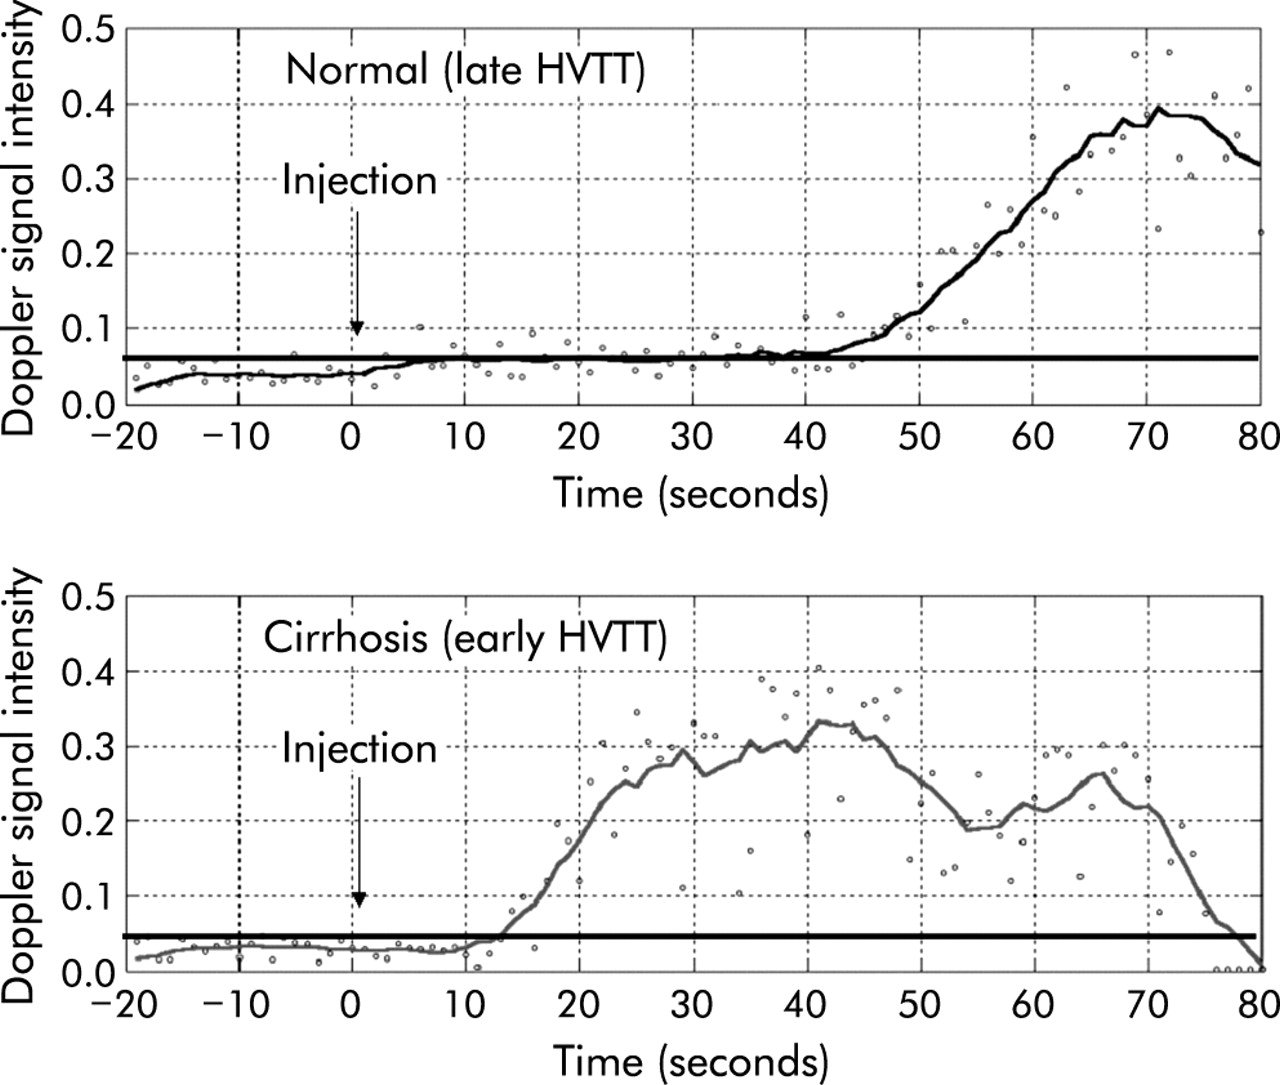
A cannula (21 gauge or larger) was inserted into the antecubital fossa vein. A baseline spectral Doppler trace from the hepatic vein was recorded for 20 seconds prior to injection. “Time to injection” was counted down by the PC MATLAB software. A bolus injection (2 g at 300 mg/ml) of the microbubble Levovist (Schering AG, Berlin, Germany) was given over 2–4 seconds immediately followed by a rapid normal saline flush (10 ml) using a three way tap. After 90 seconds, data acquisition was stopped and the recorded signals were analysed immediately. An example of a time-Doppler intensity profile plotted by the MATLAB program is shown in fig 2.

Illustration of a normal hepatic vein transit time (HVTT) (43 seconds) and a comparative early HVTT in a patient with cirrhosis (14 seconds). Note 20 seconds of baseline are collected before injection of the microbubbles. The continuous horizontal line denotes a Doppler intensity 10% above baseline and hence HVTTs are taken as the intersection of this line with that of the Doppler intensity trace.
Two injections were given to each patient or subject. In each case, the right and middle hepatic veins were studied. The left hepatic vein did not provide optimal traces due to interference from cardiac motion. If the arrival time of the microbubble bolus was not clearly seen after two injections, the study was repeated with a bolus of 4 g of Levovist.
The studies were performed with real time grey scale and spectral Doppler updates (duplex mode). Grey scale imaging was performed using relatively low acoustic power settings and without the use of tissue harmonic imaging as we had observed in our previous studies that this could disrupt the microbubbles. The reason for scanning in duplex mode was to ensure that the Doppler sample gate remained over the hepatic vein when acquiring the data and also to check for reflux of microbubbles into a hepatic vein via the inferior vena cava (this could be seen easily on grey scale imaging).
The rise time of the hepatic vein (HVTT) and the carotid artery were determined (see below) and the difference calculated as the carotid delay time (CDT). Where values differed between the two injections, the smaller value was used.
MATLAB
Data analysis performed on the raw data consisted of low pass filtering and decimation to remove the high frequency components of the audio signal. Low pass filtering was performed in two stages. This allowed the heart rate of the patient to be detected after the first smoothing stage. The second smoothing stage (mean filter with a cut off at 0.5 Hz) was then performed to remove the cardiac pulsatility prior to detection of the rise time. The rise time was obtained from the smoothed curve where it intersected the continuous horizontal line, which denoted a Doppler intensity of 10% above baseline (see fig 2).
Statistical analysis
Data were normally distributed and an ANOVA test was used to detect differences in HVTT and CDT among the groups using the SPSS program (version 10.1). A post hoc t test was then used for observations between individual groups of patients. A p value <0.05 was considered to be significant for ANOVA, and a p value <0.017 (Holm-Bonferroni correction) was considered significant for comparison between groups using the t test.
Multiple regression analysis of the relationships between HVTT, fibrosis, and necroinflammatory scores were performed by a medical statistician.
RESULTS
A total of 85 patients with liver disease attributable to HCV were studied. No rise in Doppler signal intensity (that is, a flat trace) was seen in seven patients, despite a dose of 4 g. Thus these data were excluded from analysis.
In the remaining 78 patients, 28 had cirrhosis, 20 were classified as having mild hepatitis, and 30 moderate/severe hepatitis on liver biopsy. A monotonic decrease in HVTT and CDT values was observed with increasing severity of disease. Statistically significant differences between the mild hepatitis, moderate/severe hepatitis, and cirrhosis groups were observed. Table 1 gives the mean (SEM) values for the indices of each group. No difference in mean arrival times (HVTT) or CDT was seen between the control and mild hepatitis groups. This supports the hypothesis that with more severe liver disease and fibrosis, there is increased shunting, resulting in earlier arrival times of the microbubble agent within the hepatic veins. This “left shift” of the curve is illustrated in fig 2.
Hepatic vein transit time (HVTT) and carotid delay time (CDT) for each of the four study groups
When comparing patients who had both HVTT and CDT measured, greater differences and more significant p values among the groups were seen using HVTT as an index for group differentiation compared with CDT values.
There were no differences in HVTT between the right and middle hepatic veins. Sensitivity, specificity, positive, and negative predictive values of using a HVTT value of ⩾28 seconds to denote mild hepatitis is shown in table 2. Similar details for a HVTT value of ⩽21 seconds to denote cirrhosis is also shown here.
Illustration of the high sensitivity and specificity for a diagnosis of cirrhosis using a hepatic vein transit time (HVTT) value of <21 seconds and a HVTT value >28 s for the diagnosis of mild hepatitis
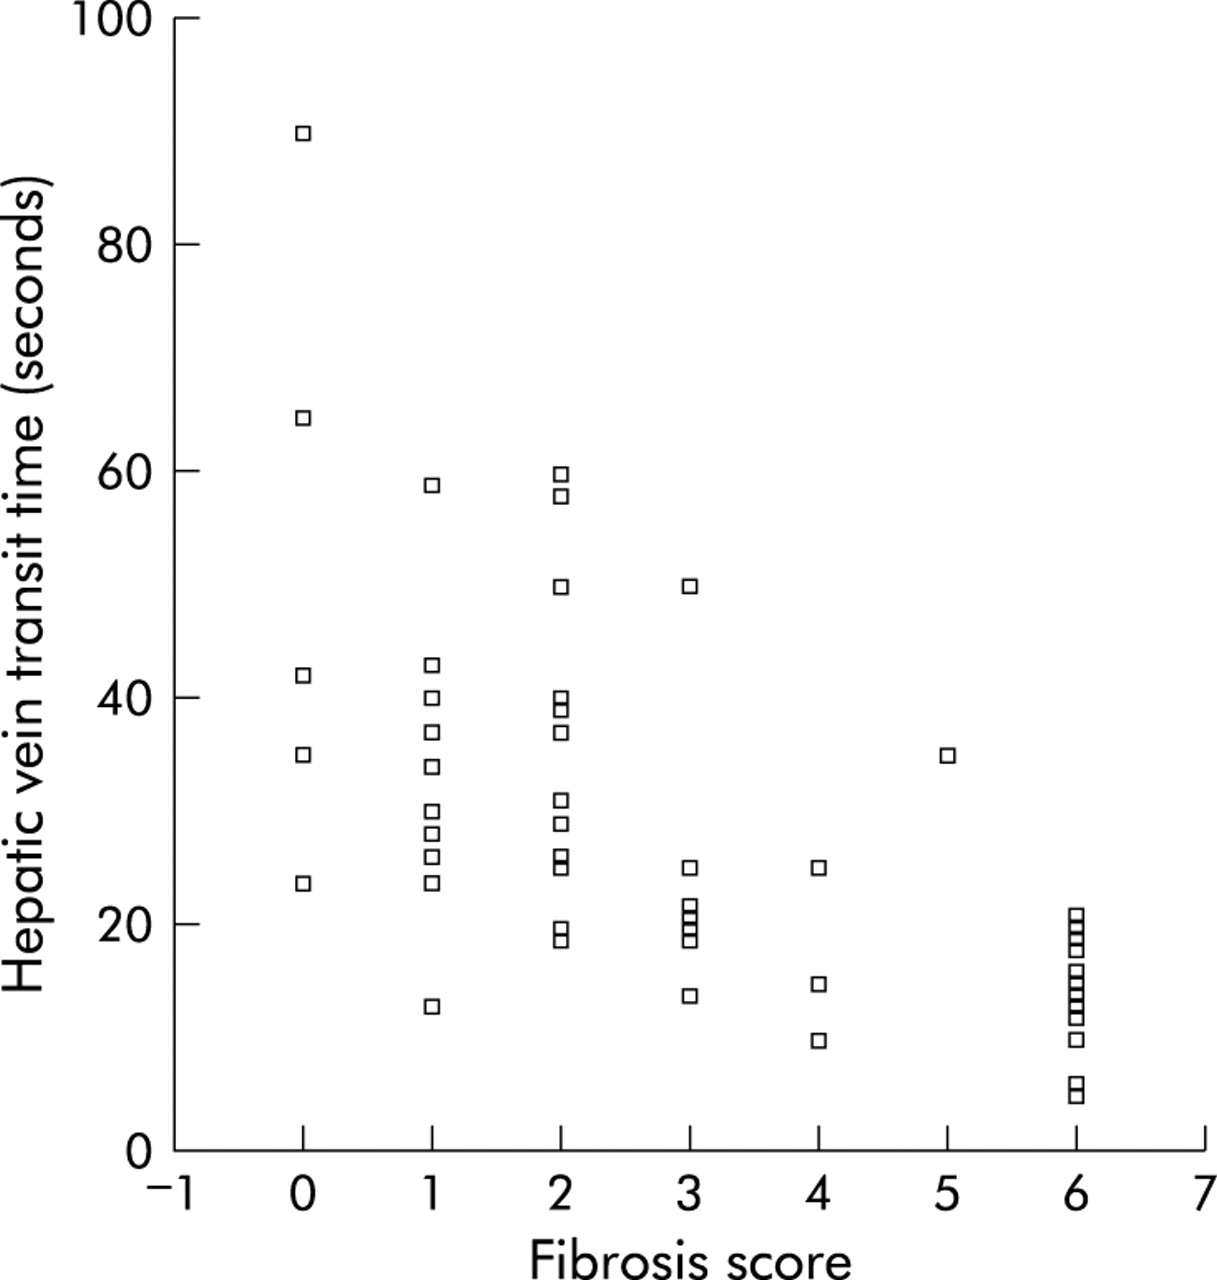
Multiple regression analysis of the relationship of HVTT to histological fibrosis and NI scores revealed a strong correlation between HVTT and fibrosis score (Spearman correlation −0.73, p<0.001) and HVTT and NI score (Spearman correlation −0.56, p<0.001). HVTT was a significant predictor of fibrosis (HVTT = 42.05−4.51×fibrosis score) (fig 3) while there was insufficient evidence to suggest that the NI score had any effect on the model with fibrosis.
Regression analysis of hepatic vein transit time versus fibrosis score and values obtained for each group based on the Ishak scoring system.
Appropriately timed blood results were available retrospectively in 30 patients (table 3). The AST to platelet ratio index (APRI) was also calculated as the ratio of AST to platelet count, multiplied by 100, as described by Wai and colleagues 19. ALT was the only index which showed significant differences between mild hepatitis and more severe disease (p = 0.03). This index however showed no difference between the moderate/severe hepatitis and cirrhosis groups.
Basic blood profile of each patient group (based on a subanalysis of 30 patients)†
Reproducibility of HVTT measurements
Although the earliest arrival time of two injections (right hepatic vein and middle hepatic vein) of Levovist were used for analysis in each subject, these were highly comparable in each patient, with 95% limits of agreement between −11.6 and 4.7. No significant difference was observed between the two arrival times (Kendall’s tau, p<0.001).
DISCUSSION
The clinical diagnosis of chronic liver disease is commonly based on clinical history and laboratory investigations, including liver function tests and, in hepatitis C patients, PCR tests give an indication of active viraemia. However, the definitive stage (extent of fibrosis) and grade (degree of necroinflammatory activity) of HCV related liver disease requires a liver biopsy, which may have significant associated morbidity. A non-invasive test of disease severity would thus be helpful, both for diagnosis and to assess response to treatment.
Previous ultrasound studies without contrast agents have attempted to correlate the Doppler characteristics of the portal vein and hepatic artery (velocity, waveform, or resistive index) with the diagnosis of cirrhosis and the severity of fibrosis. The reproducibility of these data has been unreliable and none was particularly successful at diagnosing early cirrhosis or separating mild from moderate/severe fibrosis in precirrhotic patients.12–16 In a recent paper, Bernatik and colleagues14 concluded in their study of 43 patients with HCV and varying severity of liver disease that simple Doppler measurements of liver vasculature were not a valid surrogate marker of cirrhosis, and that these measurements were not a useful method to estimate the extent of hepatic fibrosis.
We have previously shown that HVTT is a highly sensitive marker of cirrhosis using microbubbles as a tracer.17,18 The validity of this technique as a non-invasive indicator of cirrhosis has been reproduced by other groups.21,22 In this study, we have not only shown that this test is 100% sensitive for cirrhosis but, for the first time, we have been able to classify precirrhotic disease due to a single entity (HCV) which has also been well stratified and scored histologically. This is a significant advancement on our previously published studies17,18 which investigated chronic liver disease of various aetiologies and where classification of precirrhotic disease was not possible. This simple test (HVTT) could thus have a significant clinical impact for assessing liver function prior to treatment with interferon and ribavirin and may provide insight into the response of the liver following viral eradication. Future longitudinal studies are required.
The CDT value, which was calculated mainly to allow for differences in cardiopulmonary transit, did not improve differentiation between the groups. In fact, the data were statistically less significant than the HVTT index. We postulated that the reason why the HVTT value offers better disease assessment is that this measurement takes into account all aspects of the haemodynamic changes that occur with increasing severity of liver disease, including a hyperdynamic circulation, in addition to the gastrointestinal collateral circulation, pulmonary shunting, and capillarisation of the hepatic sinusoidal bed. However, recent work by Sugimoto and colleagues22 suggests that the changes in hepatic vein transit times are mainly caused by these intrahepatic circulatory changes rather than extrahepatic changes in blood flow. However, their data set was small (six control patients and six with cirrhosis). Nevertheless, based on their findings and on our current 60 CDT measurements, it can be concluded that the technique can be simplified by omitting carotid arterial measurements.
All of our patients with cirrhosis (n = 28) had a HVTT of 21 seconds or less and all but one patient with mild hepatitis (n = 20) had a HVTT of 28 seconds or more. These criteria for differentiating patient groups achieved a very high sensitivity and specificity (see table 2). However, some of the patients with moderate/severe hepatitis showed early arrival times (<21 seconds) and this is probably related to altered hepatic sinusoidal blood flow which is known to occur at an early stage, before the onset of cirrhosis in many patients.23 Another explanation for some of this overlap could be that liver biopsy only examines a very small part of the liver parenchyma, while our method takes into account haemodynamic changes in most of the liver. It is possible that undersampling of the liver at biopsy is the cause of this minor discrepancy, leading to underrepresentation of the severity of fibrosis on histological scoring.24
The HVTT data correlated best with fibrosis scores on multiple regression analysis, with no significant effect of adding NI scores. However, when we subdivided patients into mild, moderate/severe hepatitis, and cirrhosis groups based their histological scores (in conjunction with the current UK algorithm recommended for managing patients with HCV related liver disease1), we found improved sensitivity and specificity when taking into account both the histological grade and stage together (fibrosis and NI scores), rather than these factors individually.
There are indices calculated from routine blood profiles, as well as specific serological markers of fibrosis, under investigation and development that have the advantage of being non-invasive and easy to perform.19,20,25,26 Interestingly, we found that in our study, only serum ALT could differentiate mild hepatitis from more severe disease but that it did not offer differentiation between the moderate/severe hepatitis and cirrhosis groups. Our results were unable to show a correlation between APRI and severe fibrosis, as previously described,19 but our data set was small, because at that time many of the patients did not have AST measured routinely in clinical practice by referring physicians. However, one limitation of these blood tests and serological markers, such as APRI, is that they do not provide information on surveillance for the development of hepatocellular carcinoma, unlike ultrasound microbubble techniques which can characterise focal hepatic lesions based on their enhancement features to a high degree of accuracy and have also been reported to detect subcentimetre lesions earlier than MRI scans.27,28 Furthermore, distinguishing mild from moderate/severe disease is not clear with these blood tests. Therefore, it is likely that microbubble enhanced ultrasound will find a complementary role, alongside newer serum fibrosis markers.
We advocate that HVTT using a microbubble agent should complement initial staging and grading of hepatic disease from a liver biopsy (the current gold standard); if there are marked discrepancies between HVTT and the initial liver biopsy, expert re-review of the histology should be performed. HVTT would also serve as a useful alternative for assessment of liver disease in patients who have contraindications, relative or absolute, to liver biopsy.
It would be interesting to correlate these findings with other recently documented non-invasive techniques for characterising HCV related liver disease, such as 31P magnetic resonance spectroscopy.29 A prospective study combining these techniques, in addition to measurement of serum enzymes and markers of fibrosis, would allow comparison of the accuracy of each test. It may be that an index accounting for all of these variables will provide the most accurate non-invasive assessment of the severity of chronic liver disease.
Levovist is at present the most commonly used microbubble agent but there are several newer agents, such as SonoVue (Bracco, Milan, Italy) or Definity (Bristol-Myers-Squibb, New York, USA), which have different chemical properties to Levovist, but also provide enhanced Doppler intensity when they arrive in the hepatic veins. It remains to be shown whether HVTTs for these agents are similar and whether they can be used interchangeably. A benefit of using these newer agents is that their arrival within a hepatic vein can be observed in “real time” using low acoustic power two dimensional harmonic scanning modes. The main benefit of using these modes is that it would not require computer aided post processing of the data to calculate HVTT, thus making it accessible to any department with a modern ultrasound machine.
In conclusion, we have shown for the first time that HVTT measurement using an ultrasound microbubble is a simple non-invasive test which can be used to stage and grade precirrhotic liver disease with clear differentiation between mild hepatitis and cirrhosis, and statistically significant differences between these two groups and moderate/severe hepatitis. This is the largest published series employing the HVTT technique and, importantly, this is a histologically well stratified group of patients with HCV related liver disease. The response to treatment needs to be assessed in future longitudinal studies.
Acknowledgments
This study was supported by the United Kingdom Department of Health, the British Medical Research Council, the United Kingdom National Health Service Research and Development Initiative (NHS R&D), Siemens (Acuson, Mountain View, CA, USA), and Schering AG (Berlin, Germany). We are also grateful to Sr Mary Crossey, Sr Theresa Roguin, the staff of the Liver Unit at St Mary’s Hospital, and the staff of the Gastroenterology Unit at Hammersmith Hospital, London, for help with patient recruitment. Iain Grace and Basant Puri from Imperial College London provided statistical advice.
REFERENCES
Footnotes
-
↵* Present address: Queen Mary’s School of Medicine and Dentistry, The Royal London Hospital, DDRC, Turner Street, London E1 2AD
-
Conflict of interest: None.
Linked Articles
- Digest