Article Text

Abstract
Background: The response to antiviral therapy of chronic hepatitis C virus (HCV) infection is determined by virological, environmental and genetic factors.
Objective: The hypothesis was tested that the expression of specific genes and their haplotype frequencies can differentiate between non-responders (NRs) and sustained virological responders (SVRs) to antiviral treatment.
Methods: A methodological approach based on molecular marker discovery and validation was used to study the genes influencing the antiviral treatment in lymphoblastoid cell lines from 74 genotype 1b HCV patients (44 from Southern Italy and 30 from Northern Italy) treated with pegylated interferon (IFN) α and ribavirin. Furthermore, an association study was performed, testing three single nucleotide polymorphisms (SNPs) of suppressor of cytokine signalling 3 (SOCS3) in 162 NR and 184 SVR subjects (SOCS3 −8464 A/C (rs12952093), −4874 A/G (rs4969170) and 1383 A/G, (rs4969168)).
Results: SOCS3 basal expression levels were significantly increased in two independent sets of NR groups (p<0.05). A highly significant association was found between NRs and both the positively associated haplotype (OR = 2.01, 95% CI 1.45 to 2.79, p = 0.0002) and the negatively associated haplotype (OR = 0.56, 95% CI 0.42 to 0.76, p = 0.0014). In particular, the SOCS3 −4874 AA genotype was strongly associated with failure of antiviral therapy (OR = 4.00, 95% CI 2.09 to 7.66, p = 0.0003) and the AA genotype carriers had significantly higher SOCS3 mRNA and protein levels (p<0.05).
Conclusions: Basal levels of SOCS3, an inhibitor of the IFNα-induced Janus kinase–signal transducer and activator of transcription pathways, and its genetic polymorphisms influence the outcome of antiviral treatment. SOCS3 thus represents a novel blood biomarker for the a priori prediction of treatment response.
Statistics from Altmetric.com
Worldwide, approximately 170 million people are chronically infected with the hepatitis C virus (HCV). As chronic hepatitis C is associated with a significantly elevated risk for the development of liver cirrhosis and its sequelae, successful treatment of this infection is of the utmost importance. Since the early 1990s, a variety of interferon (IFN) α-based regimens have been used to treat chronic HCV infection.1 The combination of pegylated (PEG)-IFNα and ribavirin is the best available therapy, although outcomes in genotype-1-infected patients remain suboptimal, with about 40–50% experiencing a sustained virological response; while in patients infected with genotype HCV-2 and HCV-3, these rates exceed 80%.2 3 Treatment responses can be predicted more reliably at week 12 of therapy, with patients who fail to experience a 2-log10 reduction in HCV RNA levels from baseline having a ⩽3% chance of a sustained virological response.4 Due to significant drug costs and toxicity, there is tremendous interest in finding more effective ways to predict treatment responses.
Although the viral genotype is the major determinant of treatment responses in HCV-infected patients, genetic host factors have also been shown to influence the treatment response. Gene and protein expression and association studies have been performed on sets of patients that have included different viral genotypes and treatments. For instance, abnormal tumour necrosis factor α (TNFα), interleukin (IL) 10, IFNα receptor 1 (IFNAR1) and myxovirus resistance protein A (MxA) levels,5–8 and inheritance of functional genetic variants of these genes have been demonstrated to influence response to IFNα therapy.9–12
Furthermore, there have been no studies carried out on circulating blood that have included only HCV patients with the same viral genotype and antiviral treatment and that have used a methodological approach based on molecular marker discovery and validation. For these reasons, we have tested the blood basal expression of a large number of genes, including inhibitors of the IFNα-induced Janus kinase–signal transducer and activator of transcription (JAK–STAT) pathway (suppressor of cytokine signalling 1 (SOCS1), SOCS2, SOCS3, protein inhibitor of activated STAT1 (PIAS1), PIAS3 and small ubiquitin-like modifier 1 (SUMO1)), genes associated with the failure of IFNα treatment (TNFα, IL10, IFNγ, IFNAR1, IL1β, IL6 and IL8) and IFNα-induced antiviral effectors (MxA and oligoadenylate synthetase 2 (OAS2)),13–15 using two independent sets (one from Naples in the South of Italy and another from Trieste in the North of Italy) of HCV genotype-1 patients treated with PEG-IFNα and ribavirin. Only the SOCS3 gene was highly expressed in both sets of patients who had failed antiviral therapy.
There are no literature data demonstrating any association between single nucleotide polymorphisms (SNPs) of SOCS3 and the resistance to antiviral treatment. In order to strengthen the hypothesis that SOCS3 is a marker that is useful to predict antiviral treatment efficacy, we investigated SOCS3 haplotypes and correlated these haplotypes with selected outcome parameters in a cohort of Caucasian patients with chronic hepatitis C, in comparison with a carefully selected control population. Furthermore, we evaluated the relationship between variation in SOCS3 expression and different genotypes of SOCS3 −4874 SNP.
Our findings provide evidence that blood basal SOCS3 overexpression and gene haplotypes, carrying a functional SNP, are associated with a negative response to antiviral therapy in chronic HCV genotype-1.
PATIENTS AND METHODS
Patients
Overall, 346 patients with chronic hepatitis C infection were included in the study (table 1).
All of these were of Caucasian origin and they were recruited from two Italian university hospitals. The inclusion criteria were: elevated alanine aminotransferase (ALT) levels during the previous 6 months; HCV antibodies; HCV RNA; genotype 1; and no history of alcohol abuse. Exclusion criteria were: HCV antibodies with genotypes 2 or 3; other hepatitis viruses; alcohol abuse (>20 mg/day in women, and >30 mg/day in men in the 5 years before enrolment), evaluated according to Reid16; history of drug abuse; and a positive HIV test. Markers of hepatitis B virus and HIV infection were tested using commercially available ELISAs (Abbott Laboratories. Abbott Park, IL).
Liver biopsies and histology
The hepatic percutaneous biopsies were performed with Surecut 17G needles, via the intercostal route using an echo-assisted method. Liver specimens were used for histological examination if they were at least 1.5 cm long and contained >5 portal spaces. The specimens were fixed in formalin, embedded in paraffin and stained with H&E, Red Sirius, ubiquitin, trichrome and Prussian blue. Biopsies were evaluated by the Ishak score.17
RNA preparation and HCV RNA determination
RNA preparation and HCV RNA qualitative determination have been performed as previously described.18 HCV RNA has been quantified according to the Cobas Monitor test (version 2, Roche Diagnostics, Milan, Italy).
HCV genotyping
HCV genotypes have been determined as previously described.18 All of the patients included in this study were genotype 1 infected.
Antiviral therapy
All of the patients included in this study received their first course of antiviral therapy and were treated for 48 weeks with PEG-IFNα in combination with ribavirin, according to current consensus protocols. The virological response to therapy was assessed via measurements of HCV RNA at baseline, at 12 weeks and 48 weeks during treatment, and 24 weeks after treatment ended. According to the qualitative HCV RNA results, the patients were defined as either sustained virological responders (SVRs) (no detectable HCV RNA after 48 weeks of treatment and 6 months afterwards) or non-responders (NRs) (including viral breakthrough, and virological non-response, with the continued presence of HCV RNA at the end of treatment).19 The patients who relapsed at the end of the treatment were not included in this study. According to the respective study protocols, the treatment was discontinued in virological non-responders at week 12 of therapy, based on a positive quantitative HCV RNA test.
Healthy control population
Our control population comprised 281 Caucasian subjects (table 1). In all of the control subjects, chronic hepatitis C was excluded by a negative anti-HCV assay (Abbott, Wiesbaden, Germany), and none of the patients had clinical or biochemical signs of acute HCV infection. The controls were not significantly different from the HCV patients with respect to age and gender. The study was approved by the Ethics Committee of the Second University of Naples, and patients gave their informed consent.
Generation of cell lines from HCV patients, RNA isolation and reverse transcription
Ninety-one (61 from Naples and 30 from Trieste) treatment-naïve patients were studied prospectively prior to the antiviral therapy. Epstein–Barr virus-transformed lymphoblastoid cell lines (EBV-LCLs) were generated from the peripheral blood mononuclear cells (PBMCs) of these patients. Generation of EBV-LCLs and total cellular RNA extraction and reverse transcription were performed as previously described.20
Quantitative real-time PCR analysis
Quantitative real-time (QRT)-PCR was performed using the SYBR Green PCR Master Mix with the Applied Biosystem Model 7900HT Sequence Detection System. The primers were designed by the Primer Express 2.1 program (Applied Biosystems, Branchberg, NJ). β-Actin (forward 5′-CGTGCTGCTGACCGAGG-3′, reverse 5′-GAAGGTCTCAAACATGATCTGGGT-3′) and glyceraldehyde phosphate dehydrogenase (GAPDH; forward 5′-CCACATCGCTCAGACACCAT-3′, reverse 5′-AGTTAAAAGCAGCCCTGGTGAC-3′) were used as internal controls. Relative gene expressions were calculated by using the 2−ΔΔCt method, as previously described.21
Western blotting
Harvested cells were washed three times with ice-cold phosphate-buffered saline (PBS) and homogenised with extraction ice-cold buffer for the cytosolic fraction at 4°C (10 mM HEPES, pH 7.9, 1.5 mM MgCl2, 1 mM EDTA, 0.5 mM dithiothreitol (DTT), 10% (v/v) glycerol and a complete protease inhibitor cocktail (Roche, Milan, Italy)). Protein extract concentrations were determined by the Bradford assay (BioRad, Milan, Italy). A 30 μg aliquot of the cytosolic lysates was loaded onto 12% polyacrylamide gels according to the method of Laemmli,22 and Western blotting (WB) was performed as described,23 with a specific commercial mouse anti-SOCS3 antibody (1:500) (BioLegend, San Diego, CA), mouse anti-STAT1 and mouse anti-pSTAT1 (1:200) (Santa Cruz Biotechnology, Santa Cruz, CA). A mouse anti-β-actin antibody (1:1.000) (Sigma Aldrich, Milan, Italy) was used as the control for equal loading.
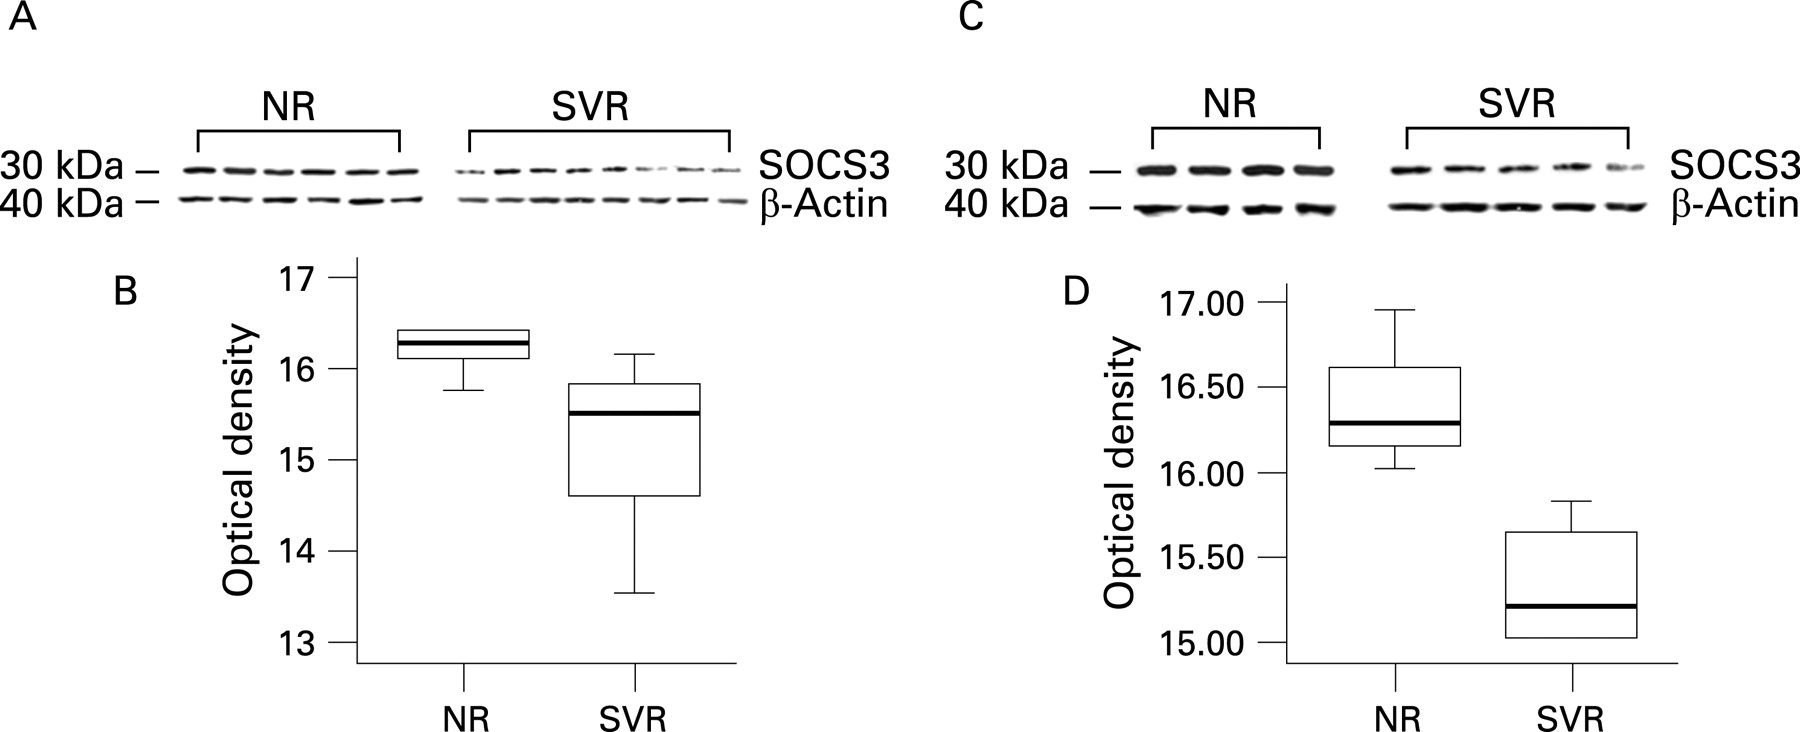
Semiquantitative analysis of protein expression was performed. The bands were quantified by densitometry to obtain an integral optical density (OD) value, which then was normalised with respect to the β-actin value.
SNP analysis
Genomic DNA was prepared using the Wizard Genomic DNA purification kit (Promega Coorporation, Madison, WI). Three SNPs were selected from the NCBI dbSNP Home Page from ∼10 kb upstream of the SOCS3 gene and throughout the gene. The SNPs that had been validated by several methods according to dbSNP and that had a minor allele frequency (MAF) >10% were chosen as priority. They were: rs12952093, rs4969170 and rs4969168. The genotyping of SNP rs4969170 was performed with the TaqMan SNP Genotyping Assay (Applied Biosystems, Branchberg, NJ). This SNP was amplified using the TaqMan Universal PCR protocol (95°C for 10 min, followed by 40 cycles at 92°C for 15 s, and 60°C for 1 min). The plates were then placed in a 7900HT Fast Real Time PCR System, where the fluorescence intensity in each well of the plate was read using the SDS 2.1 program. For the other two SNPs, rs12952093 and rs4969168, the genotyping was performed with direct sequencing. Briefly, a 341 bp fragment of the SOCS3 promoter region and a 383 bp fragment of the SOCS3 3′ untranslated region (UTR) were amplified from genomic DNA by PCR in a 50 μl volume with Master Mix 2.5X (Eppendorf, Hamburg, Germany). The oligonucleotide primers were designed from the sequence of the promoter and 3′UTRs of human SOCS3 (forward 5′-AACCTGGAGCATGTGAACTG-3′, reverse 5′-GGCAAACACCGTCTCTACCT-3′; forward 5′-TGGGACAGGGAGCATTTAAG-3′, reverse 5′-ATCCTGGTGACATGCTCCTC-3′). The PCR products were checked by DNA agarose gel electrophoresis.
Direct sequencing was performed using the Dye Terminator Cycle Sequencing FS Ready Reaction Kit (Perkin–Elmer Applied Biosystems) and a 373A DNA sequencer (Applied Biosystems, Branchberg, NJ).
Statistical analysis
Gene and protein expression analysis
For QRT-PCR data, the mean fold change = 2−(average ΔΔCt) was calculated using the mean difference in the ΔCt between the genes and the internal control.21 The ΔCt was calculated using the differences in the mean Ct between selected genes and the internal control. The error bars in the histograms were determined by the SEM difference of the ΔCt values, so that the tops of the error bars correspond to (mean fold change) × (2SEM – 1). The significances of the protein and gene expression differences were determined using the Mann–Whitney test. Statistical significance was established at p<0.05.
Haplotype analysis
For each gene SNP, the allele frequencies were defined, and testing for Hardy–Weinberg equilibrium was performed. Haplotypes at the gene locus were defined using the modified estimation-maximisation algorithm implemented in the Haploview software package.24
A comparison of the genotype, haplotype and allele frequencies between the groups was performed using the χ2 test. In the case of multiple tests, the significance levels were adjusted according to the Bonferroni method. Thus, the p value for a test became kp, where k was the number of hypotheses being tested. Odds ratios (ORs) and 95% CIs were calculated to assess the relative disease risk conferred by a specific allele, haplotype and genotype.
RESULTS
Basal expression of host genetic factors related to the failure of IFNα therapy in two independent sets of HCV patients
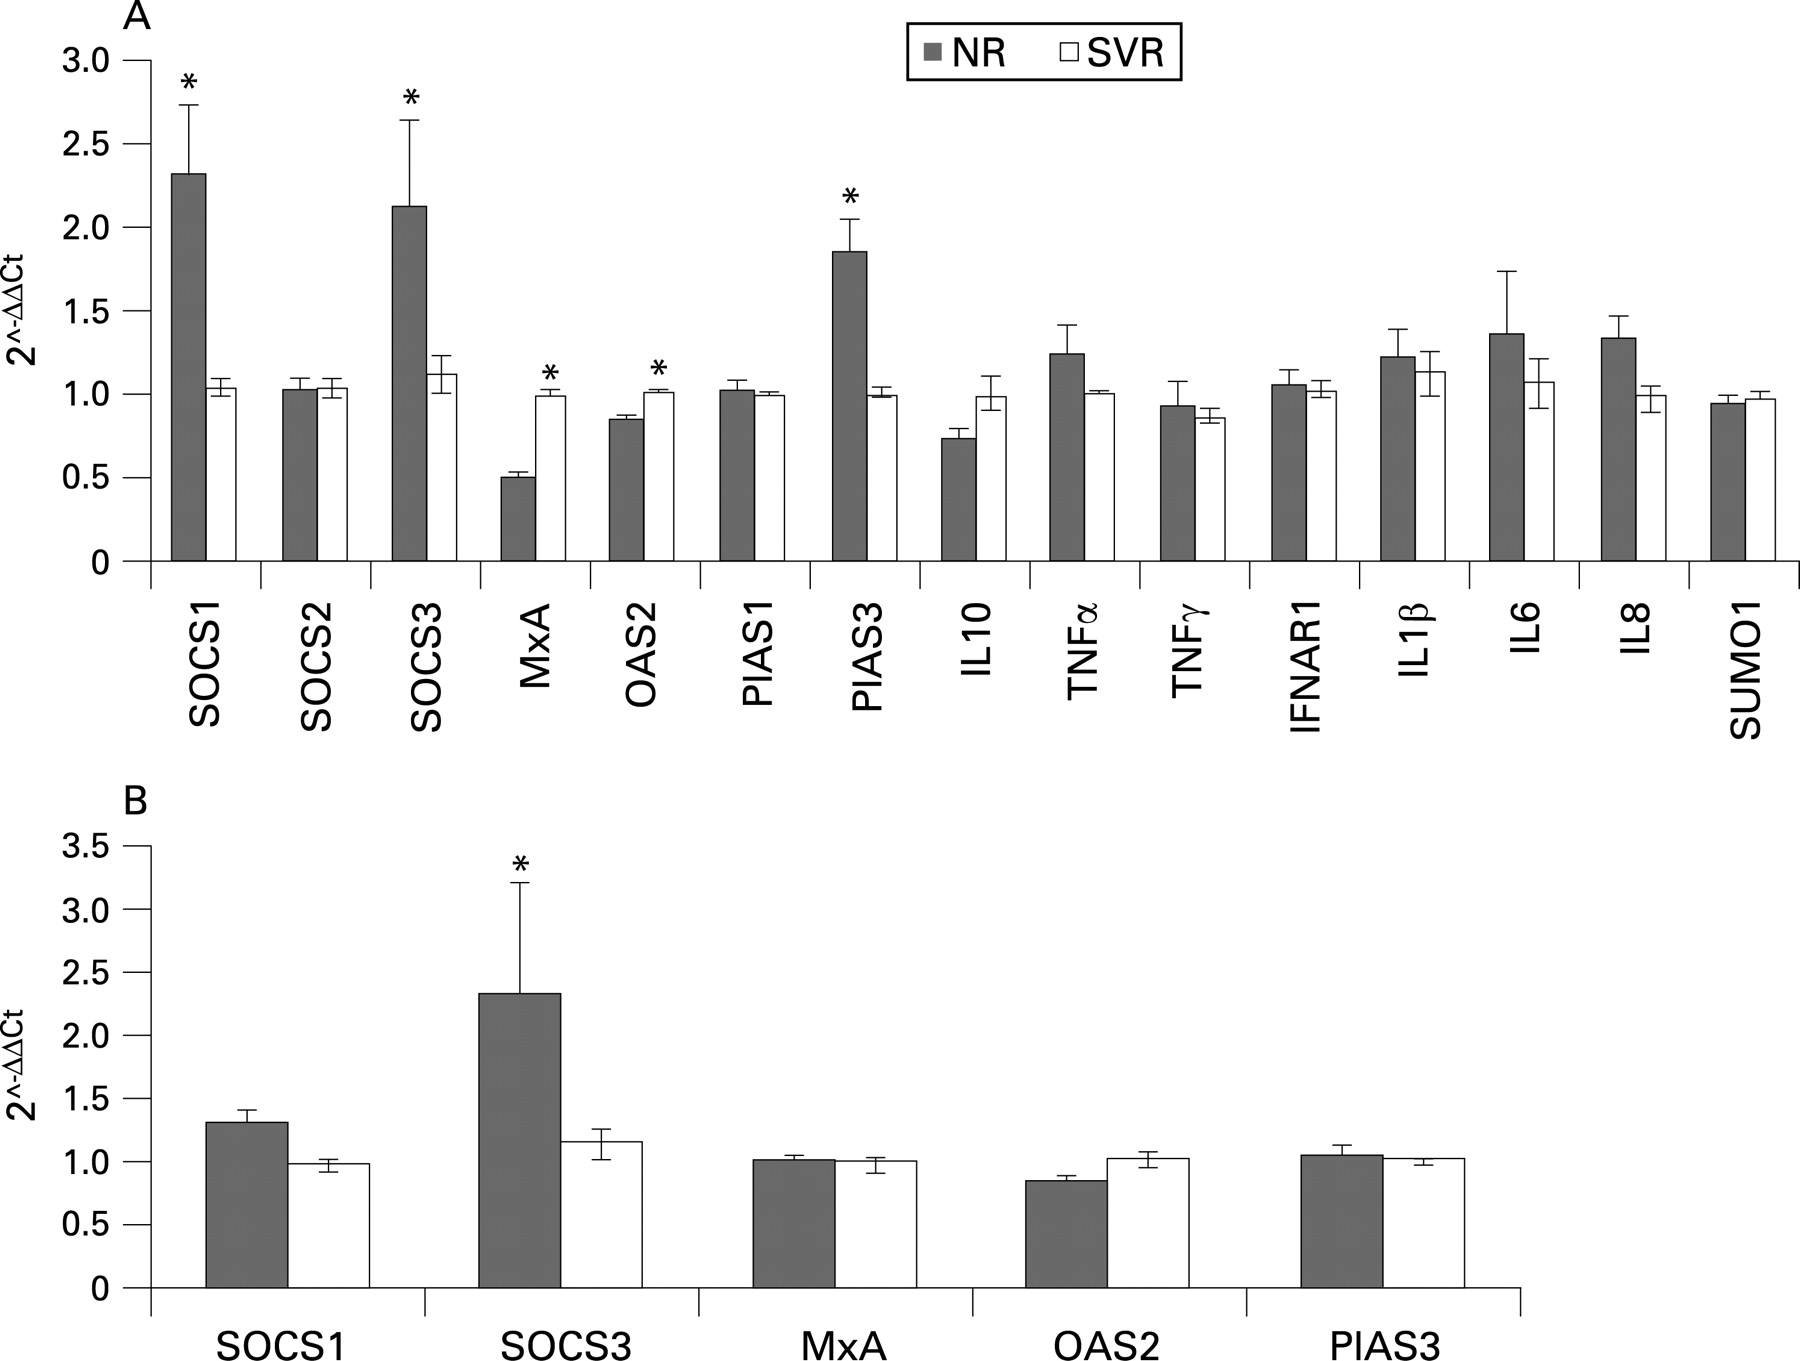
In the effort to identify genes whose expression is correlated to antiviral response in HCV genotype 1b-infected patients, we selected six genes inhibitors of the JAK–STAT pathway (SOCS1, SOCS2, SOCS3, PIAS1, PIAS3 and SUMO1), seven cytokine genes associated with the failure of IFNα treatment (TNFα, IL10, IFNγ, IFNAR1, IL1β, IL6 and IL8) and two IFNα-induced antiviral effectors (MxA and OAS2)13–15 (Supplementary table 1s), and we analysed their expression in the EBV-LCLs from the PBMCs of HCV patients. Of a total of 91 patients, 17 were excluded because they had relapsed at the end of the treatment.
We used EBV-LCLs from 22 NRs and 22 SVRs from Naples who were matched for age, sex, ALT, body mass index (BMI) and staging. The QRT-PCR analyses showed that SOCS1, SOCS3 and PIAS3 mRNA levels increased significantly in the NR group as compared with the SVR patients (p<0.05; fig 1A). Conversely, MxA and OAS2 were significantly downregulated in the NR group. The genes that had exhibited statistically significant changes between the NR and SVR groups were analysed in an independent set of HCV patients from Trieste (14 NRs and 16 SVRs, matched for age, sex, ALT, BMI and staging). Here, only the SOCS3 gene was significantly overexpressed in the NR group (p<0.05; fig 1B).

Furthermore, WB analysis confirmed that the SOCS3 protein levels were significantly higher in six NR patients than in eight SVR patients from Naples matched for age, sex, ALT, BMI and staging (fig 2A,B) and in four NR patients compared with five SVRs from Trieste also matched for age, sex, ALT, BMI and staging (fig 2C,D).
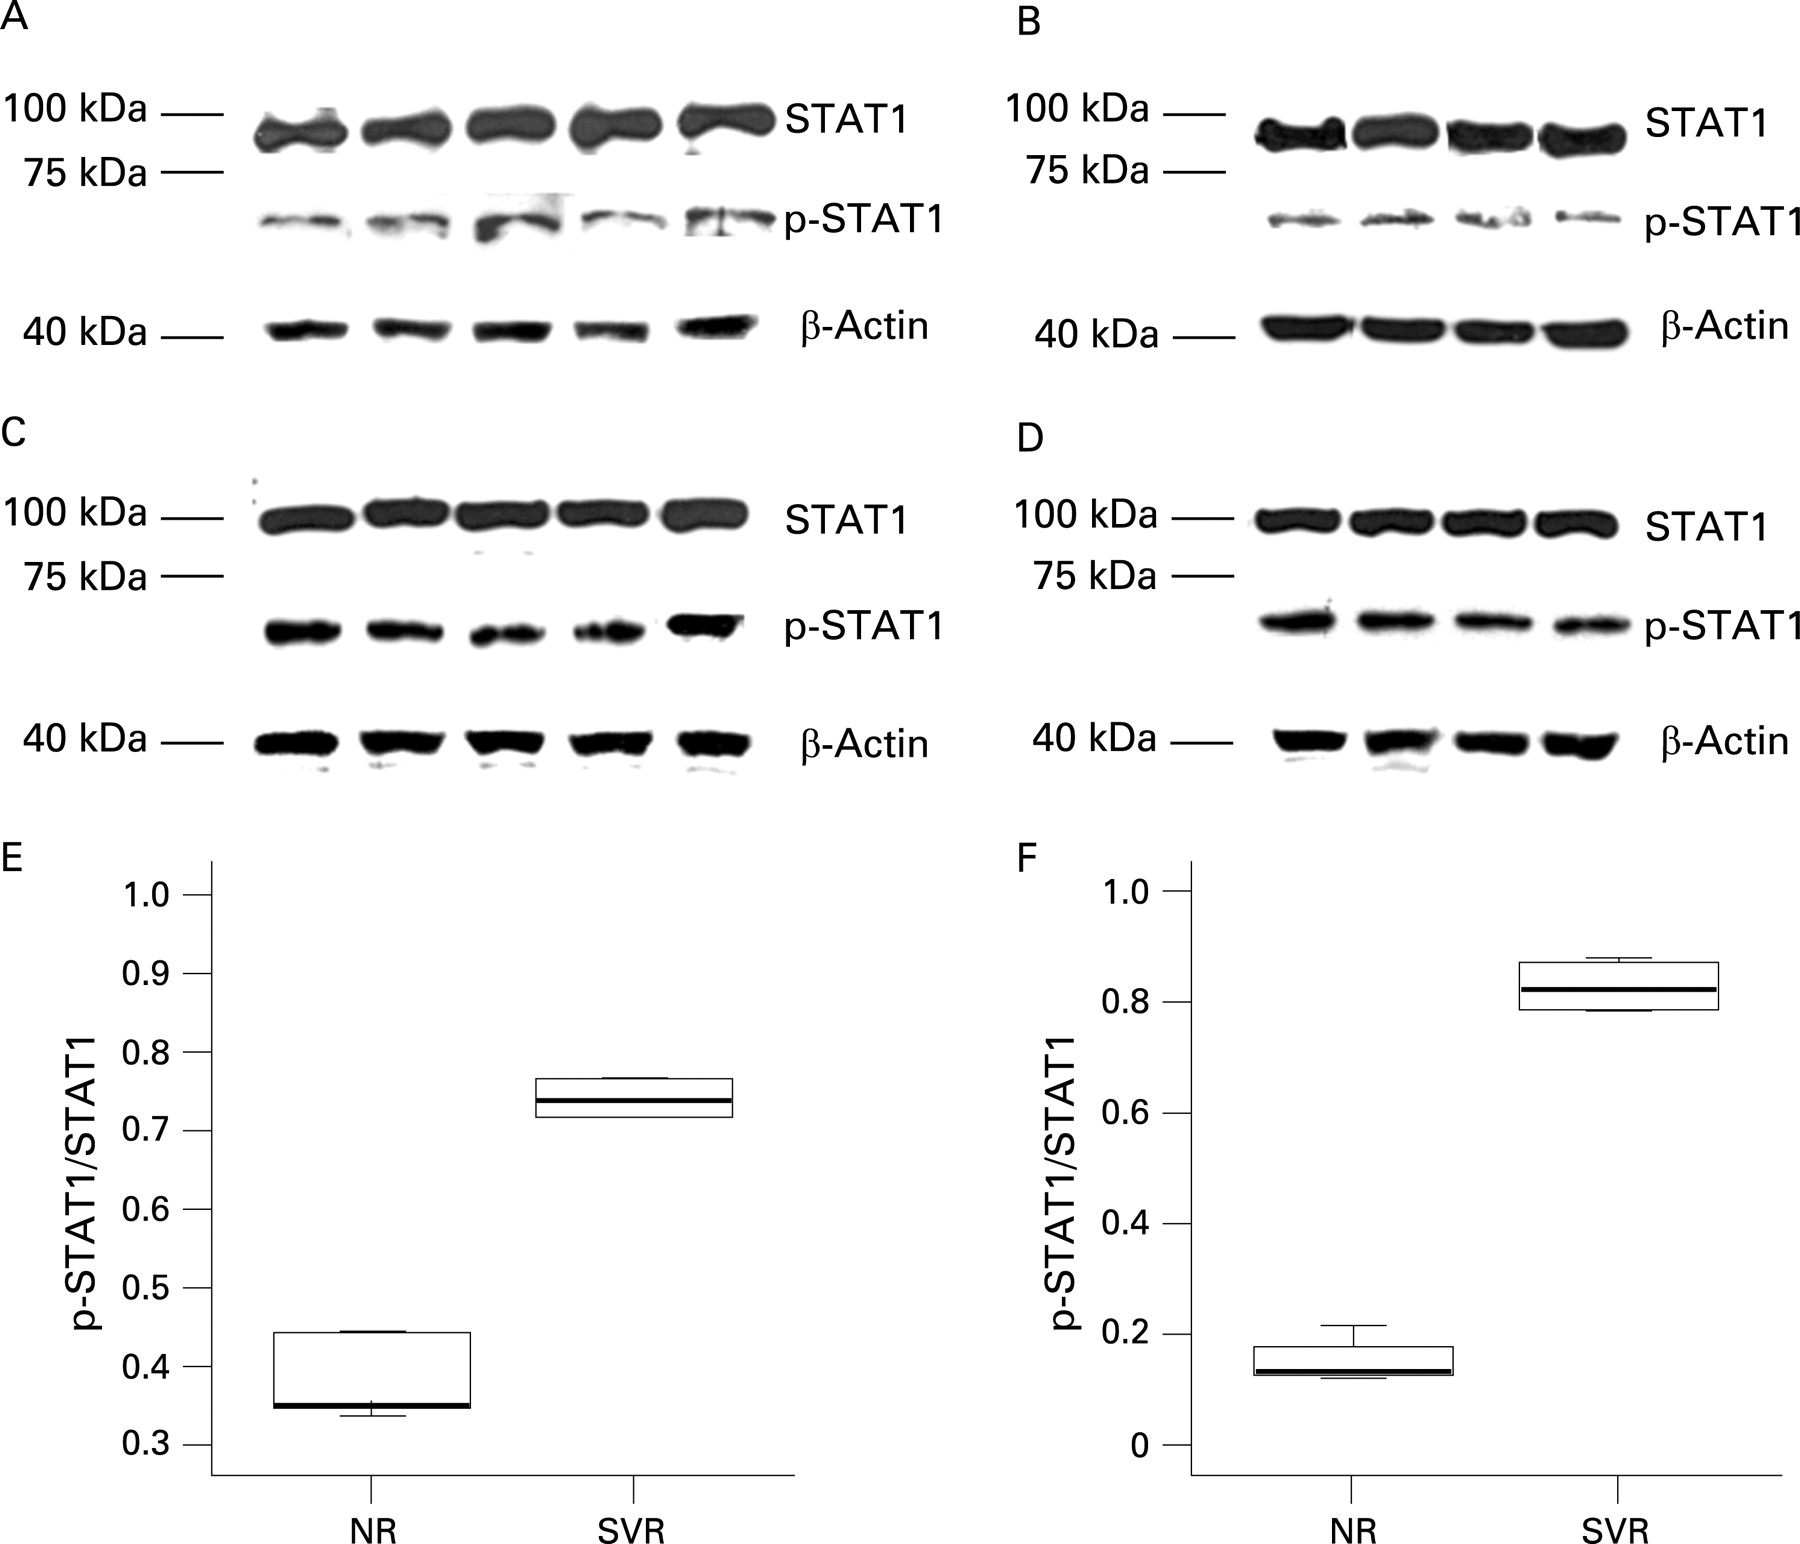
We also confirmed that SOCS3 overexpression inhibits JAK–STAT pathway signal transduction by reduction of STAT1 phosphorylation25 in EBV-LCLs from NR and SVR patients of both the Naples and Trieste groups (fig 3).
SOCS3 mRNA levels in non-transformed PBMCs
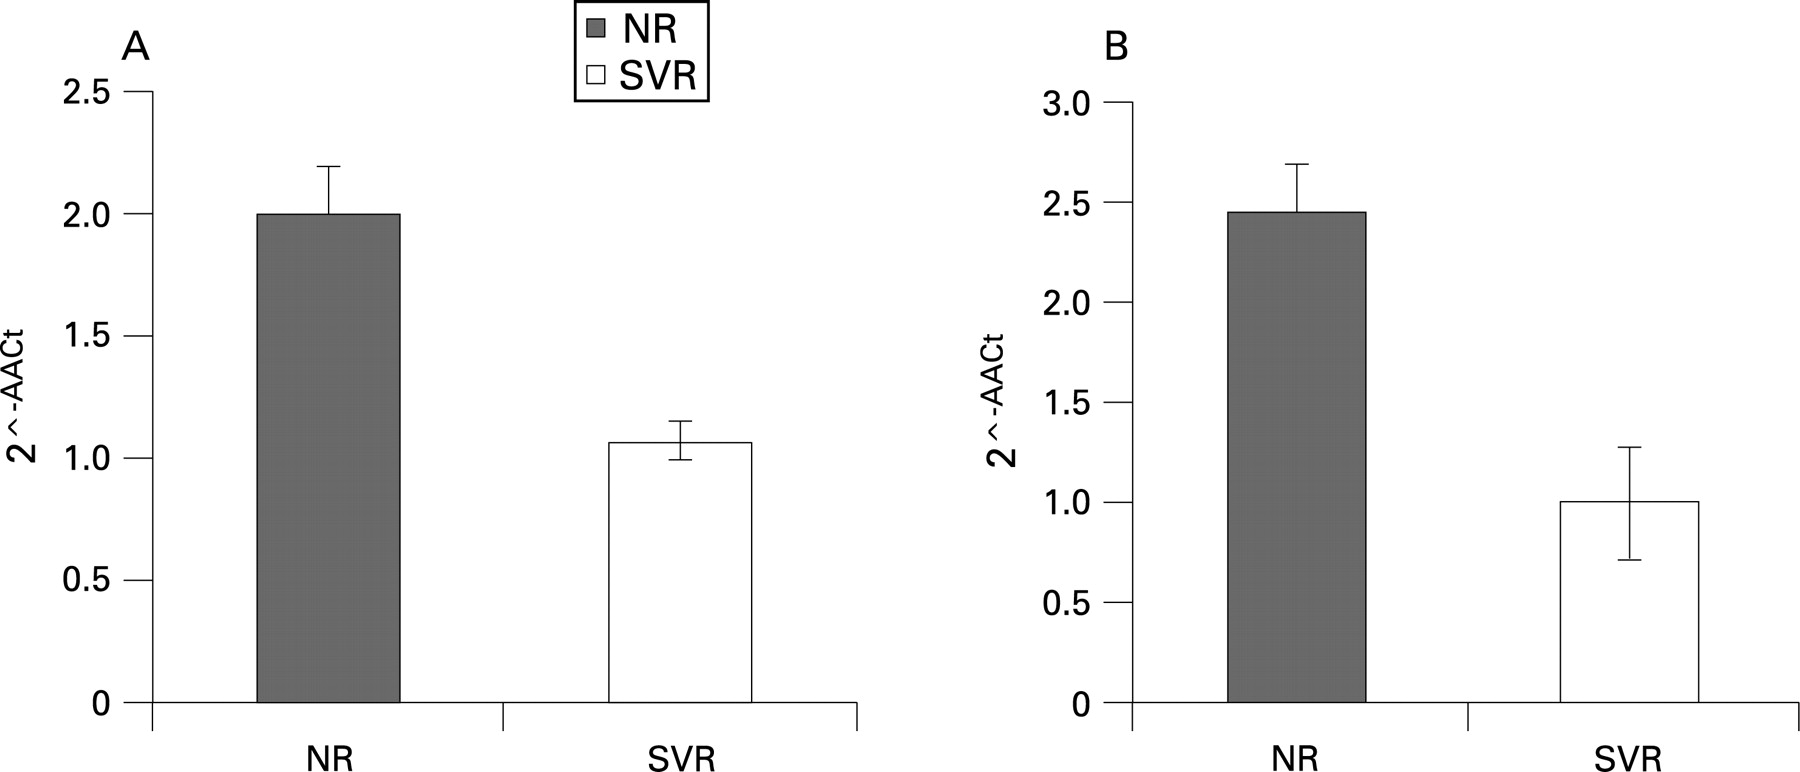
Although the literature indicates that HCV can persist in cells transformed by EBV and cultured in vitro26 and that EBV-LCLs are widely used in various types of studies of gene expression,27–30 we evaluated the SOCS3 mRNA levels in non-transformed PBMCs from 16 NR and 16 SVR patients from Naples and 4 NR and 7 SVR patients from Trieste (matched for age, sex, ALT, BMI and staging). Gene expression analysis by QRT-PCR further demonstrated that SOCS3 expression significantly increased in the NR patients, as compared with the SVR patients, in both populations (fig 4A,B).

SOCS3 allelic, haplotype and genotype distribution in the control, NR and SVR patients
Our QRT-PCR and WB results indicate that SOCS3 is critically involved in antiviral treatment, and this prompted us to investigate genetic associations between SOCS3 and the failure of antiviral therapy. This case–control study comprised 162 NR and 184 SVR patients, matched for age, sex, ALT, BMI and staging. Figure 5A shows the three SOCS3 SNPs (SOCS3 –8464 A/C, –4874 A/G and +1383 A/G) evaluated in this study.

Overall, there were no differences in the MAFs of all of the tested SNPs between healthy controls (n = 277) and HCV-infected patients (n = 346): 0.33/0.35; 0.41/0.41; 0.20/0.18; respectively, all with p>0.05.
The Hardy–Weinberg equilibrium was checked in all three of the groups (NR, SVR and healthy controls) by χ2 tests for each polymorphism. All of the markers were in Hardy–Weinberg equilibrium (p>0.05).
As the detection of an association between marker alleles and a certain phenotype critically depends on the extent of linkage disequilibrium (LD) between disease-associated polymorphisms,31 we reconstructed the characteristic SNP allele combinations on single chromosomes (haplotypes) in our populations. The LD analysis, using the Haploview program, showed that the SOCS3 SNPs −8464 A/C and −4874 A/G are in LD in healthy controls and HCV patients (fig 5B). Four out of eight possible haplotypes were detected with prevalence rates greater than 5% in our cohort. Figure 5C shows the four most common SOCS3 haplotypes and their prevalence rates. The overall haplotype distribution did not differ between the patients with chronic hepatitis C and controls (p>0.05).
When analysing the HCV case–control samples, we found a highly significant association between NRs and both the positively associated haplotype (OR = 2.01, 95% CI 1.45 to 2.79, p = 0.0002) and the negatively associated haplotype (OR = 0.56, 95% CI 0.42 to 0.76, p = 0.0014) (table 2).
Moreover the frequency of the SOCS3 −4874 AA genotype was greatly different between the NR (25.9%) and SVR (10.9%) group (OR = 4.00, 95% CI 2.09 to 7.66, p = 0.0003, table 3).
The power to detect associations for positively associated haplotypes and AA genotype was 85% (p = 0.01; OR 1.40) and 87% (p = 0.01; OR 1.40), respectively.32
The SOCS3 −4874 A/G functional SNP
As shown in table 3, the SOCS3 −4874 AA genotype is strongly associated with failure of the antiviral IFNα therapy. On the basis of these observations, we hypothesised that the −4874 A/G SNP influences SOCS3 expression. In order to confirm our hypothesis, we analysed the SOCS3 gene and protein expression in EBV-LCLs from 28 NR patients with SOCS3 −4874 AA and GG genotypes. Our data show that high mRNA and protein levels were significantly associated with the SOCS3 −4874 AA genotype (fig 6A–C).

DISCUSSION
The results presented here provide evidence that high SOCS3 expression levels and haplotypes carrying the functional SOCS3 −4874 A/G are associated with a negative outcome of antiviral therapy in patients with genotype-1 chronic HCV infection. As the current consensus treatment of genotype-1 HCV infection with PEG-IFNα and ribavirin is only effective in approximately 50% of all cases, the stratification of patients with regard to their individual chances for a positive treatment outcome is relevant in the design of new optimised treatment strategies.14
To achieve our first aim, we used QRT-PCR analysis to characterise the basal expression of hypothetical host genes influencing antiviral therapy in EBV-LCLs from PBMCs of two independent sets of genotype 1b HCV-infected patients. We preferred PBMCs to liver tissue because liver tissue mRNA reflects gene expression not only in hepatocytes, but also in non-parenchymal and infiltrating cells, such as lymphocytes, that could, ultimately, contaminate or dilute the data. At present, it is unclear whether gene expression analysis of PBMCs can provide a surrogate measure of IFN responsiveness. Several recent studies have shown that total RNA derived from circulating blood can distinguish between control subjects and patients with various disease types.33–35 For example, analyses of blood-derived total RNA have been used to differentiate between patients with cardiovascular disease and healthy controls.33 Blood-based microarrays can also indicate patients with chronic fatigue syndrome, as compared with healthy controls.34 However, there have been no studies assessing gene expression in PBMCs in relation to clinical IFN response.
Our data indicate that SOCS3 is highly expressed in PBMCs with and without stabilisation using the EBV from patients who failed in antiviral treatment. We also showed the overexpression of SOCS3 in the liver of genotype 1b-infected patients who were non-responders to antiviral therapy.36 SOCS3 is a member of the suppressors of cytokine signalling family of proteins that act as negative regulators of cytokine signalling. The SOCS proteins interfere with the binding of cytokine receptors and with intracellular molecules that act downstream.37 It has been demonstrated that the overexpression of SOCS1 and SOCS3 in human hepatoma HepG2 cells suppresses IFNα-induced STAT activation and gene expression of the antiviral proteins 2′,5′-OAS and MxA.38 Sakay suggested that constitutive expression of SOCS3 is involved in the IFNα resistance of chronic myelogenous leukaemia (CML) cell lines and the unresponsiveness of IFNα therapy in patients with a CML blast crisis.39 Recent studies demonstrated an association between increased SOCS3 protein and gene expression in liver tissue and treatment of NRs in patients with viral genotype 1.40 41 Therefore, we confirmed that high SOCS3 levels might be a risk factor for IFNα therapy efficacy using blood-based gene expression studies. Blood samples are less invasive and less liable to be contaminated, and they allow for a larger sample size, and make repeated sampling feasible for the monitoring of disease progression.
This study was carefully designed to reduce the dual threats to molecular marker discovery of bias and chance in accordance with published recommendations.42 We selected a set of HCV patients who were treated with the same therapy (PEG-IFNα and ribavirin), infected with genotype-1 virus C, and matched for age, sex, ALT, BMI and staging, and we excluded patients who relapsed at the end of the treatment. Blood specimens of NRs and SVRs were collected, processed and assayed in parallel. One possible limitation of these findings might be the number of patients, but we would highlight that the most rigorous test for the significance of a marker is validation on independent test samples.42 The problem of course is that studies with a small sample size might be “underpowered” to detect differences that exist. Our data show that the discrimination of SOCS3 gene expression can be reproduced and that discrimination of SOCS3 protein levels is validated in both sets of patients. Probably some selected genes other than SOCS3 might have significant values if evaluated in a large population. Further studies are needed to confirm our observations.
The hypothesis that SOCS3 is a useful marker to predict antiviral treatment efficacy was strengthened by our second aim. We determined whether the SOCS3 gene haplotypes predispose to failure of antiviral therapy. This case–control study was performed in genotype-1-infected patients treated with PEG-IFNα and ribavirin. We showed that the SOCS3 gene haplotypes are involved in the outcome of antiviral therapy, and in particular we observed a strong genetic association between haplotypes carrying the SOCS3 −4874 A allele and resistance to therapy. This could be due to increased SOCS3 protein and gene expression being associated with the −4874 AA genotype. Therefore, specific gene haplotypes of SOCS3 could predispose to the overproduction of the protein, and so to antiviral therapy resistance. Interrogation of the Genomatix program43 predicted that the SOCS3 −4874 A/G polymorphism is included in the binding region of two transcription factors, AML1/CBFA2 (RUNX1) and PURα. In particular, the allelic G form could bind both, while the allelic A form could bind only RUNX1. This suggests a functional role for the SOCS3 −4878 A/G SNP, and further functional studies are in progress to validate this hypothesis.
To date, there have been few studies that have documented genetic associations related to SOCS3. Only genetic association between atopic dermatitis and increased whole-body insulin sensitivity, and polymorphisms in the SOCS3 gene have been shown.44 45 There are no data concerning the association between the SOCS3 genetic variants and antiviral treatment efficacy. Several studies have demonstrated the association between cytokine functional polymorphisms and antiviral treatment.9–11 46 For the first time, we report here a genetic association of SOCS3 with the outcome of antiviral therapy.
Furthermore, as the use of single SNPs in many current association studies has little possibility to detect genotype–phenotype correlations, it has been recommended that the overall sequence variations of candidate genes be assessed via haplotype analysis.31 This is particularly true for cohorts of patients with infectious diseases, such as chronic hepatitis C, that do not include family members who can provide phase information on genotypes.31 47 Thus a major aim of our study was to use the SOCS3 haplotype information in an HCV study population. Using a powerful and precise statistical approach to infer these haplotypes from our population genotype data, we identified four common haplotypes with a prevalence of more than 5% in patients with hepatitis C and in our control population.
One possible limitation of these findings is the need to confirm the genetic association in independent sets of patients and controls who originate from another country. Therefore, further studies are needed to confirm that our observations do indeed apply to other patient populations.
In conclusion, we have shown that SOCS3 is consistently highly expressed in chronic HCV genotype 1 patients with a negative response to antiviral combination therapy, and that specific haplotypes of the SOCS3 gene are significantly associated with the failure of the treatment. We suggest that SOCS3 has an important role in this antiviral treatment, at least in an Italian population. We also suggest that SOCS3 and the pathways that it regulates are important targets for future investigations towards the development of new therapies and more effective ways of predicting treatment responses.
REFERENCES
Supplementary materials
web only table 57/4/507
Files in this Data Supplement:
Footnotes
Funding: AIRC, MURST-PRIN, OPEN foundation, Ministero Sanitè and Telethon
Competing interests: None.