Article Text

Abstract
Background: Mechanisms of acinar cell death in pancreatitis are poorly understood. Cytochrome c release is a central event in apoptosis in pancreatitis. Here, we assessed the regulation of pancreatic cytochrome c release by Ca2+, mitochondrial membrane potential (ΔΨm), and reactive oxygen species (ROS), the signals involved in acute pancreatitis. We used both isolated rat pancreatic mitochondria and intact acinar cells hyperstimulated with cholecystokinin-8 (CCK-8; in vitro model of acute pancreatitis).
Results: Micromolar amounts of Ca2+ depolarised isolated pancreatic mitochondria through a mechanism different from the “classical” (ie, liver) mitochondrial permeability transition pore (mPTP). In contrast with liver, Ca2+-induced mPTP opening caused a dramatic decrease in ROS and was not associated with pancreatic mitochondria swelling. Importantly, we found that Ca2+-induced depolarisation inhibited cytochrome c release from pancreatic mitochondria, due to blockade of ROS production. As a result, Ca2+ exerted two opposite effects on cytochrome c release: Ca2+ per se stimulated the release, whereas Ca2+-induced depolarisation inhibited it. This dual effect caused a non-monotonous dose-dependence of cytochrome c release on Ca2+. In intact acinar cells, cytochrome c release, caspase activation and apoptosis were all stimulated by ROS and Ca2+, and inhibited by depolarisation, corroborating the findings on isolated pancreatic mitochondria.
Conclusions: These data implicate ROS as a key mediator of CCK-induced apoptotic responses. The results indicate a major role for mitochondria in the effects of Ca2+ and ROS on acinar cell death. They suggest that the extent of apoptosis in pancreatitis is regulated by the interplay between ROS, ΔΨm and Ca2+. Stabilising mitochondria against loss of ΔΨm may represent a strategy to mitigate the severity of pancreatitis.
Statistics from Altmetric.com
Although acinar cell death is a key pathological response of pancreatitis, its mechanism remains poorly understood.1–8 In models of acute pancreatitis, acinar cells have been shown to die through both necrosis and apoptosis.1 3 4 7–9 The severity of experimental pancreatitis correlates directly with the extent of necrosis and, inversely, with apoptosis; furthermore, stimulating apoptosis decreases necrosis and the disease severity.1 3–5 7 8 10 11 Thus, shifting the pattern of death responses of pancreatitis towards apoptosis and away from necrosis could be of therapeutic value.1 8
Although morphological characteristics of apoptosis and necrosis are different, they are both mediated by mitochondrial membrane permeablisation,12–17 which causes release into the cytosol of cytochrome c, leading to activation of caspases, the proteases that execute apoptosis. On the other hand, mitochondrial permeabilisation causes a loss of mitochondrial membrane potential (ΔΨm), ultimately leading to depletion of intracellular ATP and necrosis. The balance between apoptosis and necrosis depends on the extent of cytochrome c release versus mitochondrial depolarisation. However, the factors that regulate cytochrome c release and dissipation of ΔΨm are not completely understood in general, and have not been investigated in pancreatitis.
The best-known mechanism of permeabilisation is through opening of the mitochondrial permeability transition pore (mPTP), a multiprotein complex involving cyclophilin D and adenine nucleotide translocase (ANT).16–20 “Classical” (eg, liver) mPTP opening is associated with swelling of the mitochondrial matrix and consequent rupture of the outer mitochondrial membrane (OMM),16 18–20 which allows the release of cytochrome c. Recent data on mice lacking cyclophilin D21 22 show, however, that cytochrome c can be released independently of mPTP, through OMM channel(s) comprised of the pro-apoptotic Bcl-2 proteins Bax and Bak.15 17 23 24
We have recently shown that both cytochrome c release and mitochondrial depolarisation occur and mediate cell death in pancreatitis.8 9 On the other hand, an abnormal, sustained increase in cytosolic Ca2+ ([Ca2+]i) and oxidative stress are key pathological signals associated with acute pancreatitis.25–28 However, very little is known of the regulation of death responses in pancreatitis by Ca2+ or reactive oxygen species (ROS). Moreover, pancreatic mitochondria are poorly characterised as compared with other organs.29–31
Here, we investigated the roles of Ca2+, ΔΨm and ROS in the regulation of cytochrome c release and apoptosis in both isolated pancreatic mitochondria and acinar cells. We found that properties of pancreatic mitochondria are different from liver mitochondria. In particular, in contrast to “classical” mPTP in liver mitochondria, Ca2+-induced mPTP opening in pancreatic mitochondria causes inhibition of ROS production. This, in turn, blocks cytochrome c release. Similarly, cytochrome c release in intact acinar cells (as well as caspase activation and apoptosis) is stimulated by Ca2+ and ROS, and inhibited by mitochondrial depolarisation. The results indicate that death responses of pancreatitis are regulated at the mitochondrial level by the interplay between Ca2+, ΔΨm and ROS.
MATERIALS AND METHODS
The experimental procedures are described in detail in the supplementary material.
Isolation of mitochondria
Mitochondria from rat pancreas and liver were isolated using the same procedure (modified from Wilson et al29 30 and Schild et al31), in a medium containing 250 mmol/l sucrose, 10 mmol/l Tris–HCl (pH 7.4), 0.5% bovine serum albumin (BSA), 0.25 μg/ml soybean trypsin inhibitor, and 1 mmol/l ethylene glycol tetraacetic acid (EGTA). For functional assays, the mitochondria were re-suspended in either medium A (250 mmol/l sucrose, 22 mmol/l KCl, 22 mmol/l triethanolamine (pH 7.4), 3 mmol/l MgCl2, 5 mmol/l KH2PO4, and 0.5% BSA); or medium B based on Ca2+/EGTA buffers (Molecular Probes, Eugene, Oregon, USA), which was used to maintain the free Ca2+ concentration, as indicated, from nominal “zero” to 39 μmol/l. The buffers contain varying ratios of 10 mmol/l K2EGTA and 10 mmol/l CaEGTA; 100 mmol/l KCl; and 30 mmol/l 3-morpholinopropanesulfonic acid (MOPS; pH 7.2). To the Ca2+/EGTA buffers we added 5 mmol/l KH2PO4 and 3 mmol/l MgCl2; and we determined (by using Fura-6F) that these additions did not change the free Ca2+ concentration. The medium also contained 10 mmol/l succinate (in most experiments) or 10 mmol/l glutamate plus 2.5 mmol/l malate as respiratory substrates. The osmolarity of medium B was between 319 mosm (at “zero” Ca2+) and 309 mosm (at 39 μmol/l free Ca 2+). The measurements on isolated mitochondria were carried out at 22°C.
Isolation of acinar cells
Rat pancreatic acinar cells were isolated using a standard collagenase digestion procedure,8 9 32 and then incubated in medium 199 containing 0.1 μg/ml soybean trypsin inhibitor.
Mitochondrial respiration was measured using a Clark-type electrode. The value of the respiratory control ratio was >3 in all mitochondria preparations, and it did not change during the incubation of mitochondria at “zero” Ca2+ for 20 min of observation.
ΔΨm in mitochondria suspension was measured using a tetraphenyl phosphonium ion (TPP+)-sensitive electrode33 in the presence of 2 µmol/l TPP+. An increase in ΔΨm causes TPP+ uptake by mitochondria and, correspondingly, a decrease of TPP+ in the medium. Alternatively, we used the ΔΨm-sensitive fluorescent probe tetramethylrhodamine methyl ester (TMRM; 0.5 μmol/l),34 either in a spectrofluorimeter cuvette (Shimadzu RF-1501; Shimadzu Scientific, Kyoto, Japan) or by using flow cytometry.
Intra-mitochondrial free Ca2+ was measured as described by Hotta et al35 in Fura-2-loaded mitochondria.
Mitochondrial swelling was assessed by measuring light scattering, using a Hitachi F4500 spectrofluorimeter (Hitachi High-Technologies, Tokyo, Japan), which reflects changes in the mitochondrial volume.36
ROS levels in the mitochondria suspension were measured using the Amplex Red (1 µmol/l)/horseradish peroxidase (0.2 U/ml) fluorimetric method.37 ROS in pancreatic acinar cells were measured using either the rhodamine dye DHR123, which predominantly monitors mitochondrial ROS,38 or 2,7-dichlorofluorescein (DCF), which monitors both mitochondrial and non-mitochondrial ROS.39 40 Fluorescence images were obtained using a Leica TCS SP MP inverted confocal microscope (Leica Microsystems, Heidelberg, Germany).
Cytochrome c release was measured by western blot,8 9 32 caspase-3 activity was measured using a fluorogenic assay,8 9 and apoptosis in acinar cells was quantified using Hoechst 33258 staining.8 9
Statistical analysis of data
Statistical analysis was done by using the two-tailed Student t test. p Values <0.05 were considered statistically significant.
Reagents
Amplex Red, DHR123, DCF-DA, Fura-2/AM, Fura-6F, MitoTracker Red (CMXRos), TMRM, 1,2-bis(o-aminophenoxy)ethoxy-ethane-N′-tetraacetic acid (BAPTA-AM), thapsigargin, and Ca2+/EGTA buffer kits were from Molecular Probes. Bongkrekic acid, alamethicin, ruthenium red and Ru 360 were from Calbiochem (San Diego, California, USA). The caspase-3 substrate N-acetyl-Asp-Glu-Val-Asp-AMC (where AMC is 7-amino-4-methylcourmarin) (Ac-DEVD-AMC) and cyclosporin A were from Biomol (Plymouth Meeting, Philadelphia, USA). Antibodies against cytochrome c and complex IV cytochrome c oxidase (COX IV) were from BD Biosciences (San Diego, California, USA) and Molecular Probes, respectively. Cholecystokin-8 (CCK-8) was from Research Plus (Manasquan, New Jersey USA). All other reagents were from Sigma Chemical (St Louis, Missouri, USA).
RESULTS
Effect of Ca2+ on the pancreatic mitochondria membrane potential
The information on the properties of pancreatic mitochondria is very limited.29–31 We determined that rat pancreatic mitochondria isolated in the presence of 1 mmol/l EGTA displayed stable ΔΨm, as measured with both the TPP+ electrode (supplementary fig 1A) and the fluorescent dye TMRM (supplementary fig 1C). Addition of more EGTA did not affect ΔΨm; while the mitochondrial uncoupler CCCP completely dissipated ΔΨm (supplementary fig 1A). Measurements of oxygen consumption (supplementary fig 1B) demonstrated coupled respiration of pancreatic mitochondria isolated in the presence of 1 mmol/l EGTA then incubated in medium A. ADP produced state 3 respiration in a standard manner (supplementary fig 1B). Mitochondria also developed uncoupled respiration after the addition of CCCP, comparable with a state 3 rate. The value of respiratory control ratio measured in the presence of succinate was greater than 3 in all mitochondria preparations (supplementary fig 1B).

By contrast, when isolated in the absence of EGTA, pancreatic mitochondria did not preserve membrane potential (supplementary fig 1A). The mitochondria were able to restore ΔΨm after addition of EGTA (supplementary fig 1A). In mitochondria isolated without EGTA respiration was inhibited; moreover, CCCP did not significantly stimulate oxygen consumption (supplementary fig 1B). EGTA chelates both Ca2+ and Mg2+, as well as other divalent cations. Using different ion chelators (N, N, N′, N′-tetrakis (2-pyridylmethyl)ethylenediamine (TPEN), ethylenediaminetetraacetic acid (EDTA) and BAPTA) we showed that it is Ca2+ not Mg2+ (or other ions) that depolarises pancreatic mitochondria (data not shown).
We also measured (supplementary fig 1C) that addition of Na+ into medium A (or substituting K+ for Na+) affected neither the basal ΔΨm nor Ca2+-induced depolarisation. These results provide evidence against a contribution of an Na+/Ca2+ exchanger, in accord with the fact that its activity is limited in mitochondria from non-excitable tissues.41
For comparison, we demonstrated that complete absence of Ca2+ is not as critical for the maintenance of the functional state of liver mitochondria, the most studied and best characterised type of mitochondria. The respiration rate and ΔΨm of isolated rat liver mitochondria were the same independent of whether they were isolated with or without EGTA (supplementary fig 1D). These data show that pancreatic mitochondria are more sensitive to Ca2+-induced damage than liver mitochondria.
In subsequent experiments designed to characterise the regulation of ΔΨm by Ca2+, pancreatic mitochondria were isolated in the presence of 1 mmol/l EGTA and then incubated in medium B in which the concentration of free Ca2+ was clamped using Ca2+/EGTA buffers. Ca2+ in the range from “zero” to 39 μmol/l caused progressive dose-dependent depolarisation of pancreatic mitochondria (fig 1). The extent of depolarisation increased with Ca2+ concentration and duration of mitochondrial exposure to Ca2+ (fig 1A). For example, 10 min exposure to 1.3 μmol/l Ca2+ significantly depolarised the mitochondria whereas ΔΨm did not decrease during 1 min incubation at this Ca2+ concentration (fig 1A).
Using flow cytometry, we showed (fig 1B) that our preparations of pancreatic mitochondria did not contain distinct subpopulations that drastically differ in ΔΨm sensitivity to Ca2+. With increasing Ca2+, the ΔΨm histogram progressively shifted to the left, indicating mitochondrial depolarisation (fig 1B).
It is of note that Ca2+-induced mitochondrial depolarisation was prevented by the Ca2+ uniporter inhibitors ruthenium red and Ru 360 (fig 1C), indicating that it is due to mitochondrial Ca2+ overload.
Using an inhibitory approach, we tested whether mPTP opening mediates Ca2+-induced depolarisation of pancreatic mitochondria. Mitochondria were incubated with various mPTP inhibitors for 10 min at 1.3 μmol/l free Ca2+ (fig 1C). The exposure of mitochondria to this Ca2+ concentration induced a time-dependent decrease in ΔΨm, which reached 70% by 10 min (cf. fig 1A). The mPTP inhibitors applied, namely the ANT inhibitor, bongkrekic acid; the cyclophilin D inhibitor, cyclosporin A; and a broad-spectrum inhibitor of mitochondrial ion transport, ADP, all significantly restored ΔΨm (fig 1C). The potencies of the inhibitors were, however, different from those characteristic for “classical” (ie, liver) mPTP.18–20 42 In particular, whereas bongkrekic acid and ADP fully restored ΔΨm, the classical mPTP inhibitor cyclosporin A restored ΔΨm by less than 50%, at both 2 μmol/l (fig 1C) and 5 μmol/l (data not shown).
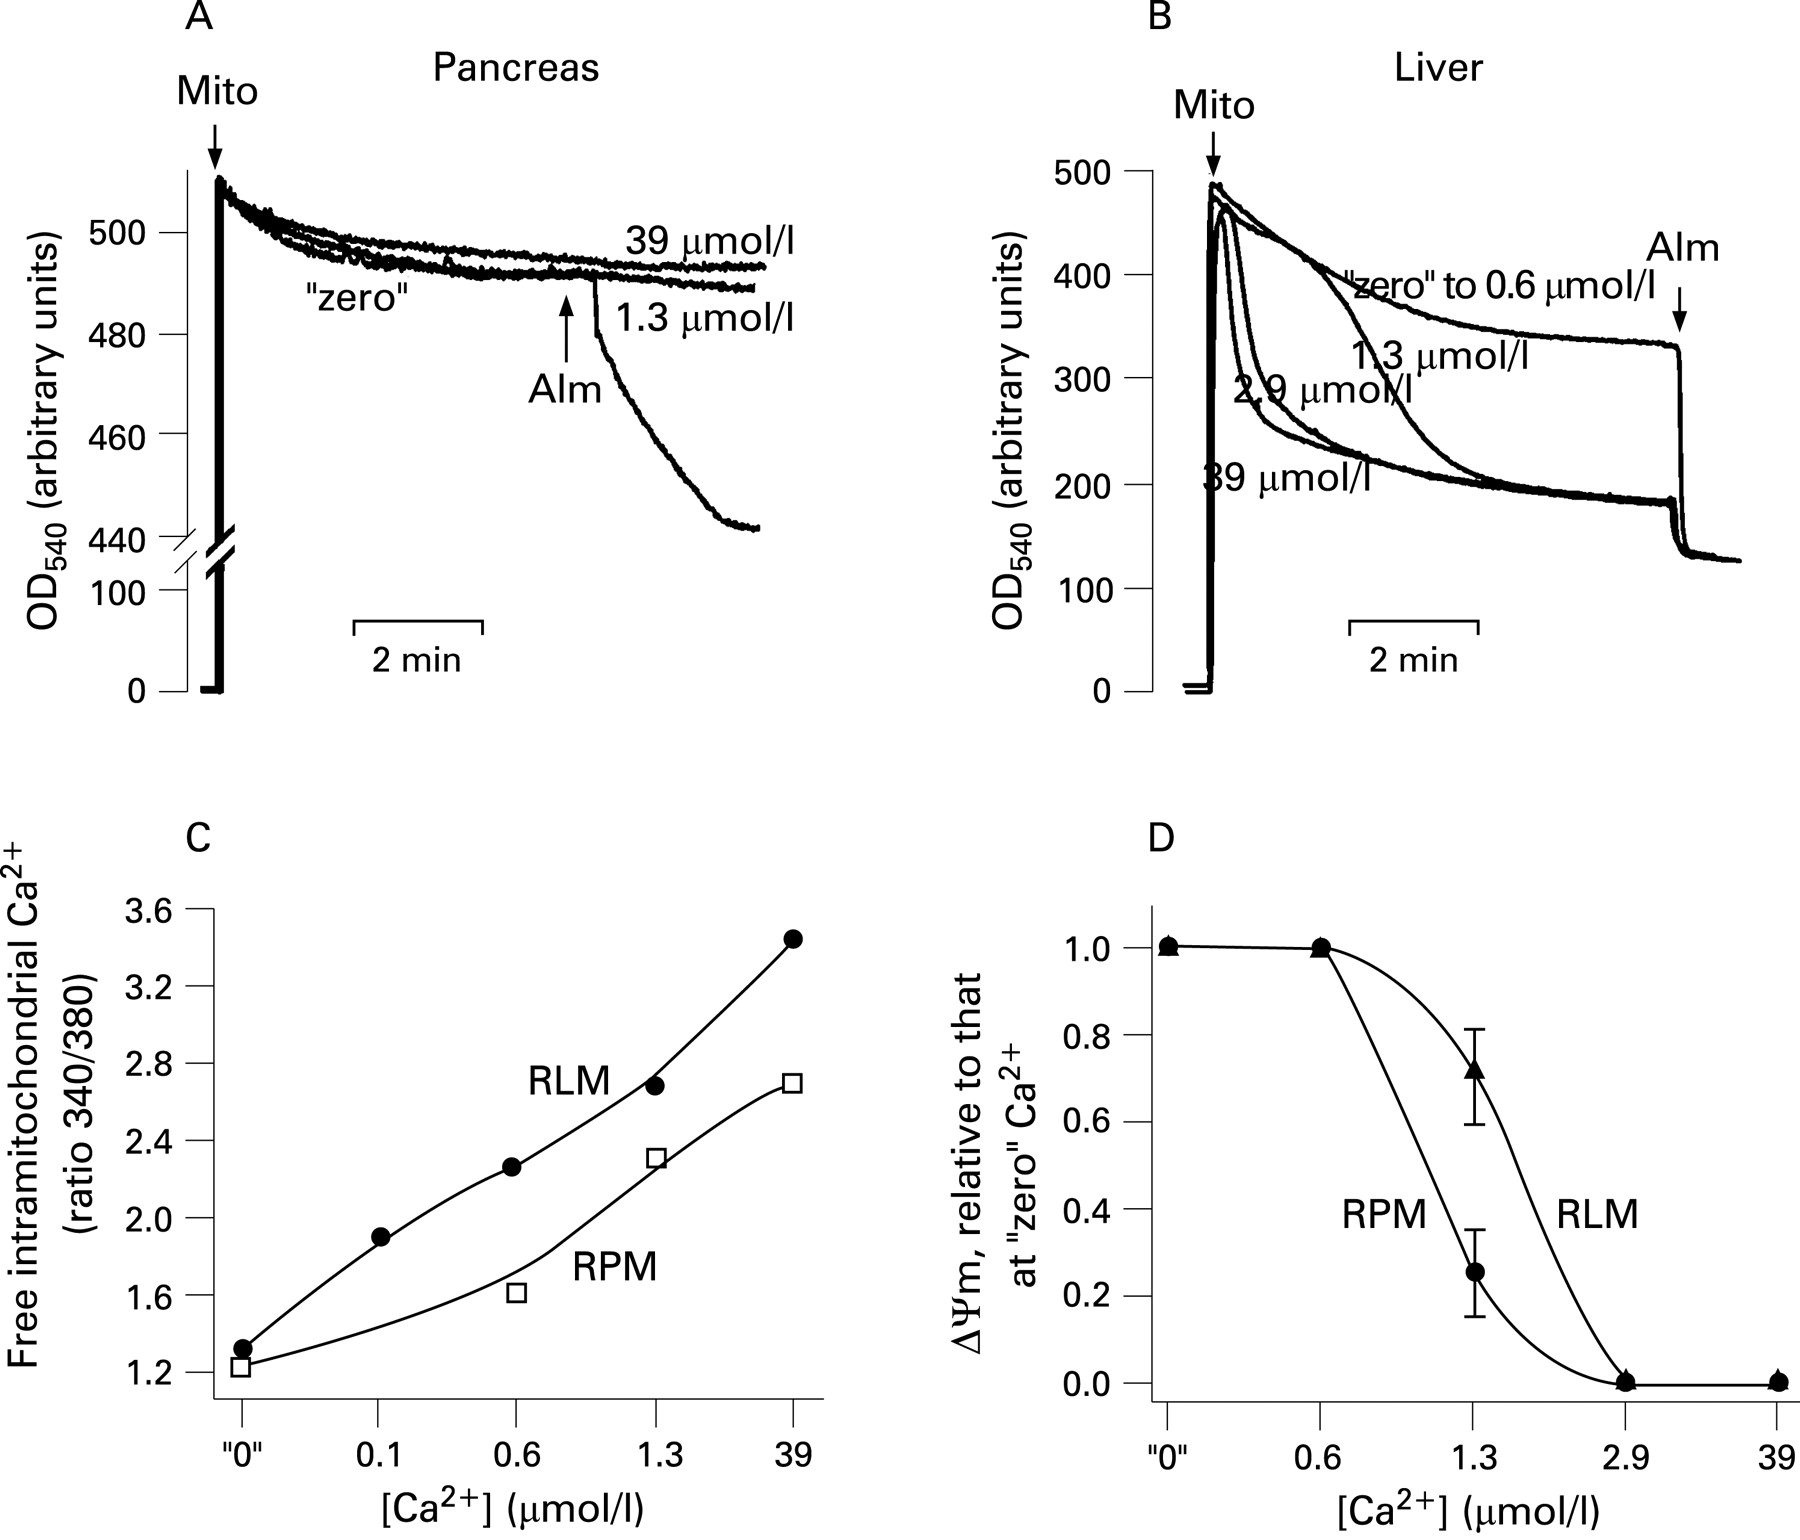
The mitochondrial depolarisation induced by mPTP opening (eg, in liver) is known to cause mitochondrial swelling, manifested by a decrease in light scattering. Mitochondrial swelling, in turn, leads to OMM rupture.17–20 42 43 Unexpectedly, we found that in pancreatic mitochondria Ca2+-induced dissipation of ΔΨm was not associated with a decrease in light scattering indicative of mitochondria swelling and OMM rupture (fig 2A). The pore-forming agent alamethicin (a positive control) caused a rapid decrease in light scattering (fig 2A), indicating swelling of pancreatic mitochondria. Alamethicin at the applied concentration completely depolarised pancreatic mitochondria (data not shown).

We tested that our mitochondria preparations isolated from rat liver, indeed, underwent rapid Ca2+-induced swelling (at free Ca2+ concentrations >0.6 μmol/l) in the same experimental conditions (fig 2B). We further compared the intra-mitochondrial free Ca2+ levels in pancreatic and liver mitochondria (fig 2C). The results showed that in the whole range of external Ca2+ concentrations examined, the intra-mitochondrial free Ca2+ levels were ∼3–4 times lower in pancreatic than in liver mitochondria. For example, at 0.6 μmol/l external Ca2+ the intra-mitochondrial free Ca2+ concentration was 2.8 μmol/l in pancreatic and 11.7 μmol/l in liver mitochondria. These data indicate that liver mitochondria retain more Ca2+ (ie, withstand higher [Ca2+]i) than pancreatic mitochondria. In accord with these data, we found that liver mitochondria were more resistant to Ca2+-induced loss of ΔΨm than pancreatic mitochondria (fig 2D).
The data in fig 2 indicate that the properties of mPTP operating in pancreatic mitochondria are different from “classical” (ie, liver) mPTP. To emphasise these differences, we termed the mPTP in pancreatic mitochondria “non-classical”.
Effect of Ca2+ on cytochrome c release from pancreatic mitochondria
Non-monotonous dependence of cytochrome c release on Ca2+ concentration
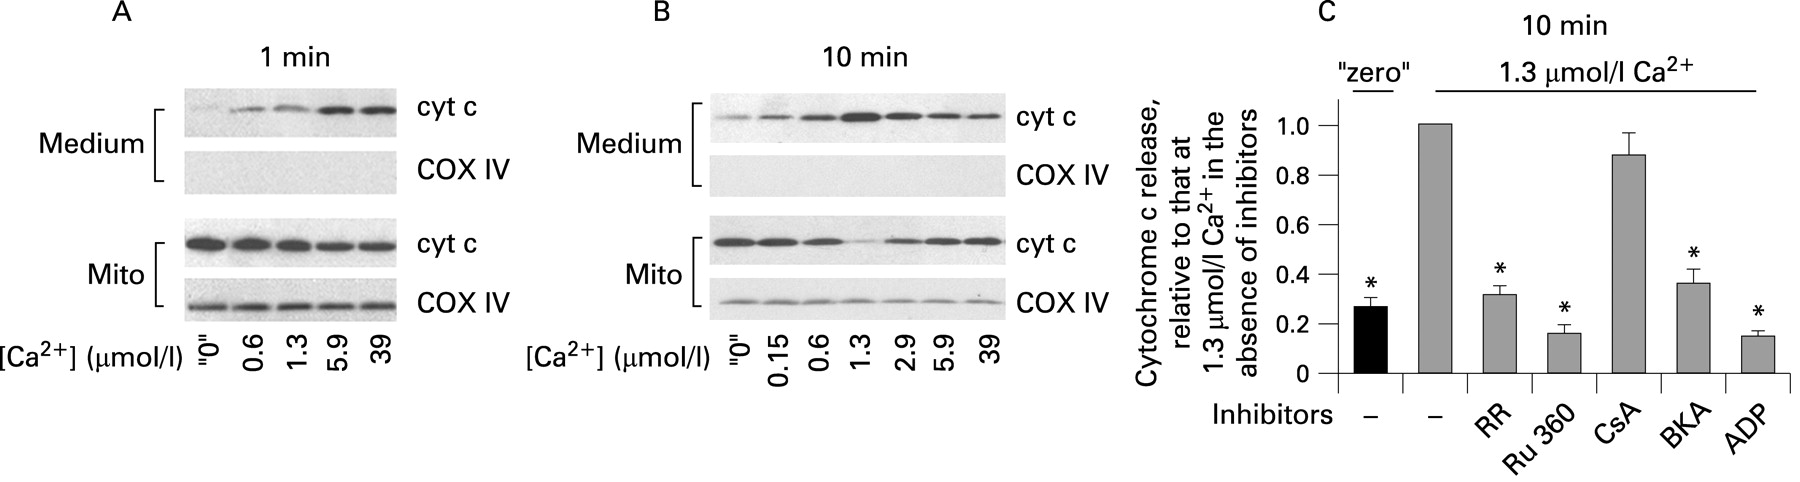
Figures 3–5 show the effect of Ca2+ on cytochrome c release from isolated pancreatic mitochondria into the incubation medium. These measurements were performed on the same mitochondrial preparations as those of ΔΨm (figs 1 and 2). At 1 min mitochondria exposure to Ca2+, cytochrome c release gradually increased with the increase in Ca2+ concentration from “zero” to 39 μmol/l (fig 3A). However, when cytochrome c release was measured after 10 min incubation, we found, surprisingly, a non-monotonous dependence of the extent of cytochrome c release on Ca2+ (fig 3B). That is, the amount of cytochrome c released into the medium was maximal at 1.3 μmol/l Ca2+ and decreased at greater Ca2+ concentrations (fig 3B).


Importantly, cytochrome c release from pancreatic mitochondria appeared very sensitive to Ca2+. It was markedly stimulated by 1 min exposure to 0.6 μmol/l Ca2+, the concentration that is reached at the peak of the agonist-evoked [Ca2+]i signal;25 44 moreover, cytochrome c release was stimulated by 10 min exposure to as little as 0.15 μmol/l Ca2+ (fig 3A,B). It is of note that ruthenium red and Ru 360 (fig 3C) blocked Ca2+-induced cytochrome c release, indicating that it is due to mitochondrial Ca2+ overload.
The classical mPTP inhibitor cyclosporin A had no effect on cytochrome c release (fig 3C), in contrast with its 100% inhibitory effect on Ca2+-induced cytochrome c release from liver mitochondria.45 The ANT inhibitor bongrekic acid, as well as ADP, greatly inhibited cytochrome c release from pancreatic mitochondria (fig 3C).
Loss of ΔΨm inhibits Ca2+-induced cytochrome c release
We next examined the mechanisms underlying the inhibition of cytochrome c release that we observed (fig 3A,B) with prolonged (ie, 10 min) exposure of pancreatic mitochondria to Ca2+ concentrations >1.3 μmol/l. We noticed that the inhibition of cytochrome c release occurred under conditions (Ca2+ concentrations and incubation times) that resulted in dissipation of ΔΨm. Indeed, under conditions in which depolarisation was minimal, ie, at 1 min mitochondria exposure to Ca2+ (fig 1A), cytochrome c release monotonously increased with the increase in Ca2+ (fig 3A). It is of note that, at 39 μmol/l Ca2+, the amount of cytochrome c released during 1 min incubation was the same as at 5.9 μmol/l Ca2+ (fig 3A), which could be explained by the fact that mitochondria lost most of their ΔΨm within 1 min of exposure to 39 μmol/l Ca2+ (fig 1A).
Further evidence for the role of ΔΨm in the effects of Ca2+ on cytochrome c release came from the comparison of the extent of cytochrome c release and depolarisation in mitochondria incubated for 1 min versus 10 min (fig 4A,B). At low Ca2+ concentrations (up to 1.3 μmol/l), at which mitochondria retained all or some ΔΨm, the cytochrome c release significantly increased between 1 and 10 min of incubation (fig 4A,B). By contrast, with greater Ca2+ concentrations (ie, at 2.9, 5.9 and 39 μmol/l) essentially all cytochrome c release occurred during the first minute; that is, in conditions in which mitochondria retained at least some ΔΨm. In other words, there was no additional cytochrome c release between 1 and 10 min of incubation of mitochondria under conditions in which ΔΨm dissipated to a non-measurable level (fig 4A,B). These results indicate that the inhibition of cytochrome c release with greater Ca2+ concentrations is due to Ca2+-induced loss of ΔΨm. The results also suggest that Ca2+-induced cytochrome c release depends on ΔΨm in a threshold manner. Partial depolarisation (such as that observed at 10 min mitochondria exposure to 1.3 μmol/l Ca2+ or 1 min exposure to 2.9 and 5.9 μmol/l Ca2+) did not block cytochrome c release; but dissipation of ΔΨm (eg, at 10 min exposure to 2.9, 5.9 or 39 μmol/l Ca2+) abolished it (fig 4A,B).
The data in figs 1–3 and 4A,B were obtained with succinate as the respiratory (complex II) substrate, as is customary in studies of the effects of Ca2+ on isolated mitochondria.45 46 Because, in intact cells, mitochondria mostly use complex I linked substrates, we also measured the effects of Ca2+ on ΔΨm and cytochrome c release using glutamate/malate as the respiratory substrate. In the presence of glutamate/malate, the effects of Ca2+ on cytochrome c release (fig 4C) and ΔΨm (fig 4D) in isolated pancreatic mitochondria were similar to those observed with succinate. In particular, with either substrate Ca2+ caused a gradual loss of ΔΨm but a non-monotonous release of cytochrome c.
To further prove that mitochondrial depolarisation inhibits the release of cytochrome c, we measured the dose dependence of the Ca2+ effect on cytochrome c release in the presence of CCCP; that is, under conditions where ΔΨm was completely dissipated (fig 5). In the presence of CCCP we observed a monotonous increase in the release of cytochrome c with Ca2+ (fig 5A). Comparison of the extent of cytochrome c release in the presence and absence of CCCP at the same Ca2+ concentration (fig 5B) showed that CCCP markedly decreased the extent of cytochrome c release from mitochondria exposed to low Ca2+ (⩽1.3 μmol/l); ie, from mitochondria which retained all or some ΔΨm; but there was no effect of CCCP on the release of cytochrome c from mitochondria completely depolarised by Ca2+; eg, at 5.9 or 39 μmol/l Ca2+ (fig 5B).
The results in figs 3–5 indicate that Ca2+ has two opposite effects on the release of cytochrome c from pancreatic mitochondria: Ca2+ per se stimulates the release of cytochrome c, but depolarisation induced by Ca2+ inhibits it. As a result, such a dual effect causes the observed non-monotonous dependence of cytochrome c release on Ca2+.
ROS mediate cytochrome c release from pancreatic mitochondria
We hypothesised that the inhibitory effect of depolarisation on Ca2+-induced cytochrome c release could be due to inhibition of ROS production. Using the ROS-sensitive fluorescent dye Amplex Red, we measured the effect of Ca2+ on ROS levels in isolated pancreatic mitochondria. At low concentrations (⩽1.3 μmol/l) Ca2+ had little effect on mitochondrial ROS, whereas greater Ca2+ concentrations completely blocked ROS production (fig 6A). Importantly, the blockade of ROS production occurred at Ca2+ concentrations that dissipated ΔΨm (figs 1A and 6A).

In contrast, no decrease in ROS levels was observed in isolated rat liver mitochondria in the whole range of Ca2+ concentrations, “zero” to 39 μmol/l (data not shown), in agreement with the literature data.47–50
We next measured the effect of inhibitors of mitochondrial ROS production47 48 on the Ca2+-induced cytochrome c release from pancreatic mitochondria. To inhibit mitochondrial ROS we applied the inhibitors of complex I, rotenone and diphenyliodonium (DPI); the anti-oxidant and lipid peroxidation inhibitor BHT; and CCCP. It is of note that DPI and rotenone inhibit ROS because they block the reverse electron transport from complex II to complex I, the main pathway of succinate-driven ROS generation.51 Rotenone and DPI markedly inhibited ROS production by mitochondria exposed to 1.3 μmol/l Ca2+ for 10 min (fig 6B). BHT also caused a significant (down to about 40% of control), but a lesser decrease in mitochondrial ROS (fig 6B). As expected, CCCP, which dissipates ΔΨm, completely blocked ROS production. Importantly, the ROS inhibitors (except CCCP) did not depolarise mitochondria (fig 6C).
All the ROS inhibitors drastically decreased cytochrome c release from mitochondria incubated at 1.3 μmol/l Ca2+ (figs 6D,E and 5B). Conversely, exogenous superoxide added in the form of KO252 significantly stimulated cytochrome c release in mitochondria incubated at 39 μmol/l Ca2+ (fig 6F); ie, in conditions in which ROS production was blocked (fig 6A). Of note, KO2 had no effect on ΔΨm (data not shown). The results in fig 6 indicate that ROS promote cytochrome c release from pancreatic mitochondria.
Taken together, the results in figs 3–6 elucidate the regulation of cytochrome c release from pancreatic mitochondria by Ca2+, ΔΨm and ROS. In particular, these results indicate that Ca2+-induced loss of ΔΨm inhibits cytochrome c release due to inhibition of ROS.
ROS and Ca2+ regulate cytochrome c release and apoptosis in pancreatic acinar cells
To corroborate the findings on isolated mitochondria that revealed key roles for ROS and Ca2+ in cytochrome c release, we performed experiments on rat pancreatic acinar cells stimulated with supramaximal CCK-8 (CCK). We have previously demonstrated8 9 cytochrome c release, downstream caspase-3 activation and apoptosis in this experimental system, which is considered an in vitro model of acute pancreatitis.1 2 6–9 25 53
We first assessed the effect of CCK on mitochondrial ROS and the role of ROS in cytochrome c release, caspase activation and apoptosis in acinar cells (fig 7). To measure mitochondrial ROS in intact cells, we used the ROS-sensitive rhodamine dye DHR123.38 DHR123 fluorescence largely co-localised with that of the mitochondrial marker MitoTracker Red (CMXRos) (fig 7A), confirming mitochondrial localisation of DHR123 in acinar cells. The supramaximal CCK increased DHR123 fluorescence 2-fold (fig 7B), indicating an increase in ROS. These data are in accord with a previous report54 (using a different dye) that supramaximal CCK increases ROS in acinar cells.

To assess the role of mitochondrial ROS in apoptosis in acinar cells, we used rotenone, an inhibitor of complex I, which is routinely applied to stimulate mitochondrial ROS production in intact cells.47 55 56 Of note, in isolated mitochondria that use succinate as a substrate, rotenone produces the opposite effect of inhibiting ROS, which we utilised in the experiments in fig 6. The reason for these opposing effects of rotenone is that in isolated mitochondria using succinate as a substrate, rotenone blocks the reverse electron transport from complex II to complex I and thus inhibits ROS production.47 51 In contrast, cells mostly use complex I-linked substrates (eg, glutamate/malate), and, therefore, inhibiting electron transport through complex I with rotenone stimulates mitochondrial ROS in intact cells.56 We found that in pancreatic acinar cells rotenone, indeed, increased DHR123 fluorescence about 3-fold (fig 7B). We tested that rotenone did not cause a decrease in CMXRos fluorescence (ie, mitochondrial depolarisation) in acinar cells (data not shown).
Stimulating mitochondrial ROS production with rotenone greatly induced cytochrome c release, caspase-3 activity, and apoptosis in acinar cells (fig 7C). The magnitude of rotenone-induced apoptotic signals was similar to those induced by the supramaximal CCK, suggesting a major role for ROS in the CCK-induced apoptotic responses (fig 7C). Our findings are in accord with recent data57 58 showing that the pro-oxidant menadione increases ROS levels and stimulates apoptosis in rat pancreatic acinar cells.
CCCP, which blocked mitochondrial ROS production (fig 7B), completely abolished both CCK- and rotenone-induced cytochrome c release, caspase-3 activation, and apoptosis in acinar cells (fig 7D).
Next, to assess the role of Ca2+ we applied thapsigargin, an inhibitor of the endoplasmic reticulum Ca2+–ATPase, which induces a sustained increase in [Ca2+]i in acinar cells (to approximately 300 nmol/l, compared with the basal of about 100 nmol/l) and thus mimics the effect of supramaximal CCK.44 59 We also used buffering of [Ca2+]i with the intracellular Ca2+ chelator BAPTA. Incubation of acinar cells with thapsigargin significantly stimulated cytochrome c release, caspase-3 activity and apoptosis (fig 8A). The effects of thapsigargin were, however, less than those elicited by supramaximal CCK (fig 8A).

BAPTA, which prevents CCK-induced increase in [Ca2+]i,44 had two effects on apoptotic responses in acinar cells (fig 8B). BAPTA loading increased basal levels (ie, in untreated cells) of cytochrome c release, caspase-3 activity and apoptosis. As a result, in the presence of BAPTA the CCK-induced cytochrome c release, caspase-3 activation and apoptosis were all less than in cells without BAPTA (fig 8B). For example, CCK stimulated apoptosis 3-fold in control cells and 2.1-fold in BAPTA-loaded cells.
We tested whether the increases in the basal levels of cytochrome c release and downstream apoptosis caused by BAPTA could be mediated through ROS. There are data on other cell types60 61 showing that BAPTA stimulates ROS-dependent cell death; for example, BAPTA induces death of cortical cells through stimulating lipoxygenase-mediated ROS production.61 Using DHR123, we did not find any significant increase in mitochondrial ROS in BAPTA-loaded acinar cells (fig 8C). However, BAPTA caused an approximately 2-fold increase in intracellular ROS measured with DCF (fig 8D), a fluorescent dye sensitive to both mitochondrial and non-mitochondrial ROS.39 40 Thus, the pro-apoptotic effect of BAPTA can be explained by its stimulation of ROS. Indeed, the anti-oxidant N-acetylcysteine abrogated BAPTA-induced caspase-3 activation in acinar cells (data not shown).
In contrast, thapsigargin had no effect on either DHR123 or DCF fluorescence in acinar cells (fig 8C,D), indicating the lack of its effect on either mitochondrial or non-mitochondrial ROS. This indicates that, by itself, an increase in [Ca2+]i elicited with thapsigargin does not increase ROS in acinar cells. Therefore, the pro-apoptotic effect of thapsigargin (fig 8A) is mediated through an increase in [Ca2+]i.
Comparison between the two sets of conditions, CCK versus control and BAPTA+CCK versus BAPTA, allows the contributions of Ca2+ and ROS to the effect of CCK on the apoptotic responses in acinar cells to be assessed. The fold increase in DCF fluorescence induced by the supramaximal CCK was the same (approximately three times) in the absence of BAPTA and in BAPTA-loaded acinar cells (fig 8D), indicating that CCK-induced increases in ROS were similar in controls and BAPTA-loaded cells. At the same time, the effects of CCK on apoptotic responses were less in BAPTA-loaded than in control cells (fig 8B), reflecting the contribution of the CCK-induced [Ca2+]i signal, which is abolished by BAPTA.
The results in figs 7 and 8, corroborating our findings on isolated mitochondria, indicate that cytochrome c release, caspase-3 activation and apoptosis in acinar cells are mediated by increases in both [Ca2+]i and ROS, and are inhibited by loss of ΔΨm. In particular, sustained increase in [Ca2+]i stimulates apoptotic responses in acinar cells. The results also indicate that Ca2+ is not the only signal mediating the CCK-induced apoptotic responses; that is, these responses are mediated by both Ca2+-dependent and -independent mechanisms.
DISCUSSION
Mechanisms regulating acinar cell death in pancreatitis remain poorly understood. We have recently shown8 9 that cytochrome c release is a common event in models of acute pancreatitis. Experimental pancreatitis is also associated with sustained elevations of [Ca2+]i, which can locally reach low micromolar concentrations26 and are believed to mediate trypsinogen activation and other pathological responses of pancreatitis.53 62 Oxidative stress is implicated in acute pancreatitis; however, the roles of ROS and the targets of ROS in acinar cells are not known.27 28 63
Here, we investigated the roles of Ca2+, ΔΨm and ROS in the regulation of cytochrome c release in pancreatic mitochondria. We used both isolated pancreatic mitochondria and acinar cells hyperstimulated with CCK.
The properties of pancreatic mitochondria are poorly characterised.29–31 We found that pancreatic mitochondria are more sensitive to Ca2+ than liver mitochondria and maintain their functional state only if isolated in the presence of EGTA. Ca2+ at low micromolar concentrations depolarised isolated pancreatic mitochondria, which was prevented by inhibition of the Ca2+ uniporter, indicating mPTP opening. Further, we found that the mPTP in pancreatic mitochondria has unusual properties, different from the “classical” (eg, liver) mPTP. A key characteristic of “classical” mPTP opening is mitochondria swelling, leading to OMM rupture.18–20 By contrast, Ca2+-induced depolarisation of isolated pancreatic mitochondria was not associated with swelling. Further, in pancreatic mitochondria Ca2+-induced depolarisation caused a dramatic decrease in ROS, in contrast with ROS burst induced by mPTP opening in mitochondria from liver and other organs.47–51 64 65 Of note, endogenous ROS production in mitochondria is mediated by electrons that have escaped from the electron transport chain; thus, dissipation of ΔΨm (eg, with CCCP) blocks ROS production.47 The reasons why the “classical” mPTP-mediated ROS burst occurs in spite of depolarisation are not quite clear, but it is likely due to inhibition of mitochondrial anti-oxidant capacity resulting from swelling.47–51 64 65
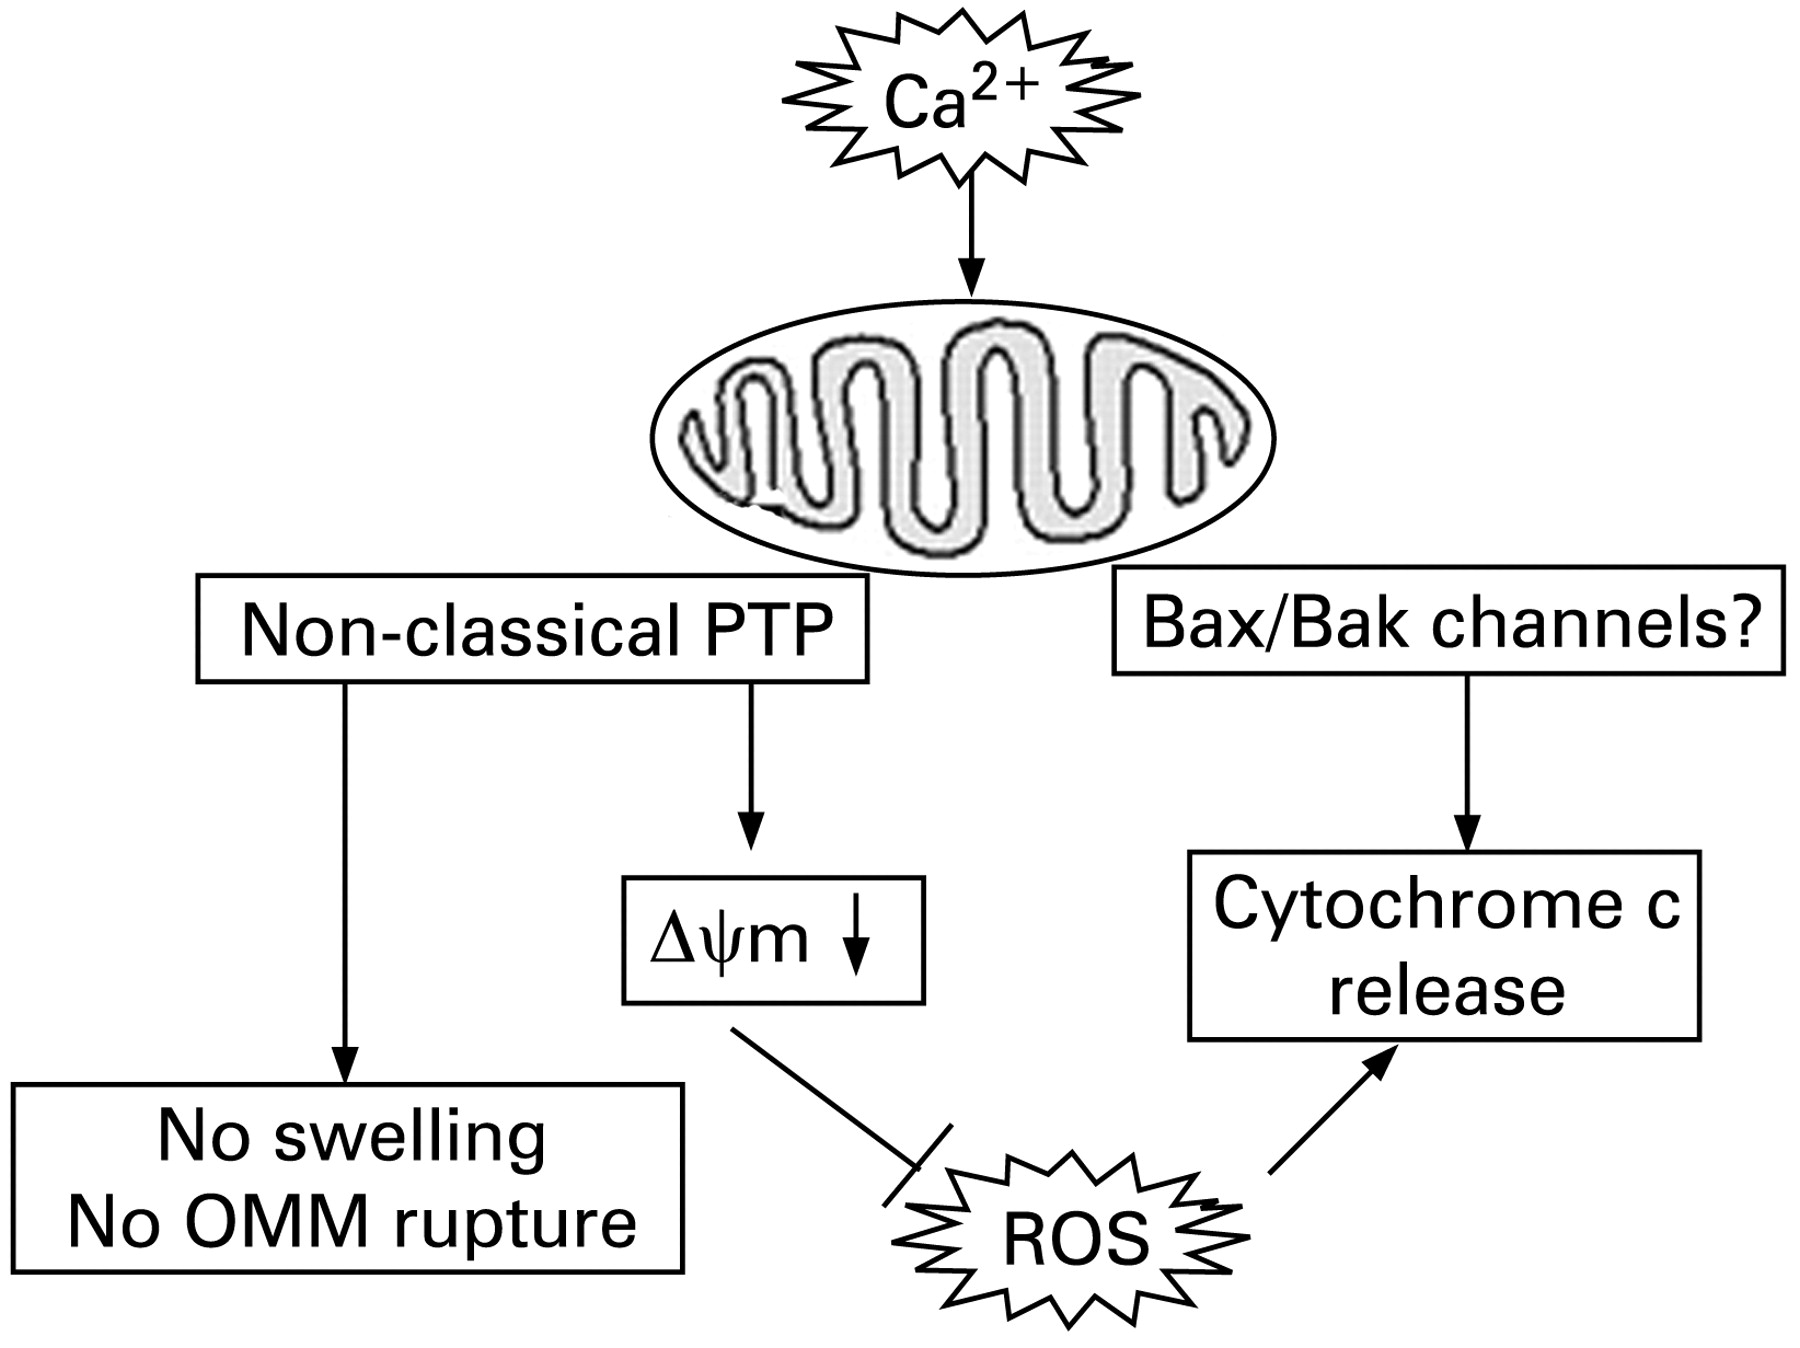
The central finding in our study is that in pancreatic mitochondria, Ca2+-induced cytochrome c release occurs in the absence of OMM rupture. Moreover, we found that the Ca2+-induced, mPTP-mediated depolarisation negatively regulates cytochrome c release, most likely through inhibition of ROS. Thus, although Ca2+ per se stimulates cytochrome c release, Ca2+-induced depolarisation inhibits it. Such a dual effect results in the observed non-monotonous dependence of cytochrome c release on Ca2+. The regulations of cytochrome c release by Ca2+, ΔΨm and ROS in pancreatic mitochondria are depicted in fig 9.
Differently, in liver mitochondria, Ca2+ only stimulates cytochrome c release.45 These differences could be due to the “non-classical” properties of pancreatic mitochondria mPTP. In liver, Ca2+-induced mPTP opening causes ROS burst, which promotes cytochrome c release, whereas mPTP opening in pancreatic mitochondria blocks ROS production, thus inhibiting cytochrome c release.
One mechanism whereby ROS may promote cytochrome c release is peroxidation of cardiolipin, a major phospholipid that anchors cytochrome c to the inner mitochondrial membrane.45 46 66 Its oxidation by ROS facilitates cytochrome c detachment, thus increasing cytochrome c availability for release.
The permeability system mediating cytochrome c release from pancreatic mitochondria in the absence of OMM rupture likely involves the pro-apoptotic proteins Bax and Bak17 23 24 Interestingly, our results with bongrekic acid indicate that ANT may be involved in both Ca2+-induced cytochrome c release and depolarisation of pancreatic mitochondria.
Importantly, the results on intact acinar cells hyperstimulated with CCK (the in vitro model of acute pancreatitis) corroborate those on isolated mitochondria. We found that (1) [Ca2+]i increase mediates, in part, the CCK-induced cytochrome c release, caspase-3 activation and apoptosis in acinar cells; (2) increasing mitochondrial ROS stimulates cytochrome c release and apoptosis; and (3) dissipation of ΔΨm prevents CCK-induced apoptotic responses. Thus, in acinar cells Ca2+ and ROS stimulate whereas mitochondrial depolarisation inhibits cytochrome c release. The results indicate that apoptotic responses in acinar cells are mediated by both Ca2+-dependent and Ca2+-independent mechanisms. On the other hand, the results suggest a major role for ROS in CCK-induced apoptotic responses.
In conclusion, our study presents several novel findings. First, it reveals unusual, “non-classical” properties of the mPTP in pancreatic mitochondria; in particular, that the Ca2+-induced depolarisation occurs without mitochondria swelling and results in ROS decrease. Second, the results indicate a critical role for ROS in cytochrome c release and apoptosis in pancreatic acinar cells. Third, we found that in pancreatic mitochondria Ca2+-induced loss of ΔΨm does not stimulate but, on the contrary, inhibits cytochrome c release, most likely through blocking ROS production. To our knowledge, this is the first demonstration of a negative feedback between mitochondrial depolarisation and cytochrome c release. The implication of this negative regulatory mechanism for cell death responses, in general, is that loss of ΔΨm, while facilitating necrosis, may at the same time limit apoptosis. Fourth, our results demonstrate regulation of the pattern of acinar cell death at the mitochondrial level, by the interplay between Ca2+, ΔΨm and ROS. Specifically, the inhibition of cytochrome c release by Ca2+-induced mitochondrial depolarisation suggests a molecular mechanism underlying the inverse correlation between necrosis and apoptosis observed in experimental pancreatitis. Therefore, stabilising mitochondria against ROS decrease and loss of ΔΨm may represent a therapeutic strategy to shift the death response of pancreatitis away from necrosis and thus mitigate the disease severity.
Acknowledgments
We thank Dr AV Panov for help with the equipment to measure mitochondria characteristics, and Dr SJ Pandol for stimulating discussions.
REFERENCES
Supplementary materials
web only appendices 58/3/431
Footnotes
-
See Commentary, p 328
-
Supplementary methods and a figure are published online only at http://gut.bmj.com/content/vol58/issue3
-
Funding: This study was supported by NIH grant DK059936 (to ASG), an AGA Foundation Designated Research Scholar Award in Pancreatitis (to OAM) and by the Hirshberg Foundation.
-
Competing interests: None.