Article Text

Abstract
Background: Median survival of patients with primary sclerosing cholangitis (PSC) has been estimated to be 12 years. Cholangiography is the gold standard for diagnosis but is rarely used in estimating prognosis.
Aims: To assess the natural history of Dutch PSC patients and to evaluate the prognostic value of a cholangiographic classification system.
Patients: A total of 174 patients with established PSC attending a university hospital and three teaching hospitals from 1970 to 1999.
Methods: Charts were reviewed for validity and time of diagnosis, concurrent inflammatory bowel disease, interventions, liver transplantation, occurrence of cholangiocarcinoma, and death. Follow up data were obtained from the charts and from the attending clinician or family physician. Median follow up was 76 months (range 1–300). The earliest available cholangiography was scored using a radiological classification system for the severity of sclerosis, developed in our institution. Survival curves were computed by the Kaplan-Meier method. Cholangiographic staging was used to construct a prognostic model, applying Cox proportional hazards analysis.
Results: The estimated median survival from time of diagnosis to death from liver disease or liver transplantation was 18 years. Cholangiocarcinoma was found in 18 (10%) patients. Fourteen patients (8%) underwent liver transplantation. Cholangiographic scoring was inversely correlated with survival. A combination of intrahepatic and extrahepatic scoring, together with age at endoscopic retrograde cholangiopancreatography, proved strongly predictive of survival.
Conclusions: The observed survival was considerably better than reported in earlier series from Sweden, the UK, and the USA. Classification and staging of cholangiographic abnormalities has prognostic value.
- primary sclerosing cholangitis
- cholangiocarcinoma
- survival
- liver transplantation
- PSC, primary sclerosing cholangitis
- CCA, cholangiocarcinoma
- ERCP, endoscopic retrograde cholangiopancreatography
- AGEERCP, age at index ERCP
- IBD, inflammatory bowel disease
- OLT, orthotopic liver transplantation
- EHD, extrahepatic disease
- PI, prognostic index
Statistics from Altmetric.com
- PSC, primary sclerosing cholangitis
- CCA, cholangiocarcinoma
- ERCP, endoscopic retrograde cholangiopancreatography
- AGEERCP, age at index ERCP
- IBD, inflammatory bowel disease
- OLT, orthotopic liver transplantation
- EHD, extrahepatic disease
- PI, prognostic index
Primary sclerosing cholangitis (PSC) is a chronic progressive cholestatic disease, characterised by patchy inflammation of the biliary tree, resulting in obliterative fibrosis. The aetiology is unknown, and to date there is no therapy that can effectively halt disease progression.
Regarding the natural history of PSC, three larger independent studies each containing more than 100 cases have been published to date.1–,3 Median survival was estimated at approximately 12 years in all studies. All three studies reported an incidence of cholangiocarcinoma (CCA) of 6–8 %. When counselling patients, we usually rely on these 1970–1980s based series.
Two studies have been published that have assessed the value of cholangiography in predicting prognosis. Both concluded that high grade intrahepatic strictures were indicative of a poor prognosis.4,5 However, the cholangiographic abnormalities encountered in PSC are not widely used to assess disease stage, probably because there is no uniformly accepted classification system. In 1984, Li-Yeng and Goldman were the first to propose a classification system for the cholangiographic findings in PSC based on a series of 19 patients.6 Several years later, Majoie et al from our institution proposed a modification of this system of radiographic findings.7 Recently, we evaluated this cholangiographic classification system in 122 PSC patients.8
The aims of the present study were to assess the natural history of Dutch PSC patients, and to evaluate the predictive value of our cholangiographic classification system.
PATIENTS AND METHODS
Patients
Records from all 181 patients, who were filed with a diagnosis of PSC between 1970–1999 from one tertiary referral centre and three teaching hospitals, were retrieved.
The diagnosis was reviewed together with cholangiograms and histology results when available. Seven patients were excluded because they lacked sufficient evidence for a diagnosis of PSC. Three of these patients had a Klatskin tumour, and four had complicated gall stone disease. From the remaining 174 patients the following data were recorded: age at diagnosis, sex, concurrent inflammatory bowel disease (IBD), cholecystectomy, endoscopic retrograde cholangiopancreatography (ERCP) findings, age at index ERCP (AGEERCP), disease duration until index ERCP, liver biopsies, total follow up time, follow up from index ERCP, clinical status at end of follow up, occurrence of CCA, and orthotopic liver transplantation (OLT). Follow up data were extracted from the charts and obtained from attending clinicians, primary care physicians, patients, or from one of the liver transplantation centres in the Netherlands.
Natural history assessment
Cumulative survival from the time of diagnosis to death from liver disease or OLT was estimated by Kaplan-Meier analysis. The same method was applied to assess the survival of patients with CCA from the time of diagnosis of this complication to death.
Cholangiographic scoring
All available cholangiograms were retrieved and scored by two investigators who were unaware of the patients’ clinical information, applying the modified scoring system as recently described (see table 1⇓).8 Survival curves were computed to assess whether increasing intra- and extrahepatic scorings were correlated with a poorer prognosis.
Classification of cholangiographic findings in primary sclerosing cholangitis
Prognostic model computation
A variable based on the cholangiographic scoring system was defined using Kaplan-Meier and univariate Cox proportional hazards analysis. Subsequently, using backward regression, age at index ERCP, duration of disease until index ERCP, sex, concurrent IBD, and cholecystectomy were introduced into the regression analysis as possible covariates.
The assumption of proportional hazards for a Cox regression model fit was checked as described previously.9
For statistical calculations the SPSS package version 8.0 (SPSS inc., Chicago, Illinois, USA) and S-plus version 4.5 (MathSoft, Seattle, Washington, USA) were used.
RESULTS
General characteristics
Among the 174 patients, 105 (60%) were male. Mean age at diagnosis was 40.4 (14.8) years. A total of 114 (66%) patients were known to have concurrent IBD (ulcerative colitis, n=83; Crohn’s disease, n=28; indeterminate colitis, n=3). Thirty nine patients (22%) underwent cholecystectomy, which not infrequently revealed a diagnosis of PSC.
Natural history assessment
In 161 cases, follow up data were complete at the time of data entry closure (July 1999). Median follow up time was 76 months (range 1–300). During the follow up period there were 32 deaths (18.4 %), six of which were non-liver disease related. An event was defined as (1) death from liver disease or (2) OLT. The estimated median survival from the time of diagnosis until death from liver disease (n=26) or OLT (n=14) was 18 years (95% confidence interval (CI) 15–21 years). The Kaplan-Meier curve is shown in fig 1⇓. The 14 transplanted patients (8%) underwent OLT after a median disease duration of 95 months (range 2–221). At a median of 44 months (range 5–117) after OLT all were alive. CCA occurred in 18 patients (10%) which accounted for 14 (54%) of the liver disease related deaths. Biliary obstruction caused by secondary CCA was the initial mode of presentation in six cases. The other 12 patients developed CCA a median of 27 months (range 9–258) after the diagnosis of PSC was made. One patient was lost to follow up after a diagnosis of CCA was made. The estimated median survival in the remaining 17 patients was nine months (95% CI 7–11).

Kaplan-Meier plot of cumulative survival of the entire primary sclerosing cholangitis cohort (n=174). Estimated median survival until death from liver disease or orthotopic liver transplantation was 18 years (95% confidence interval 15–21 years; broken lines).
Cholangiographic scoring
ERCPs were available from 133 patients, either initially (n=78) or within 2–257 months after diagnosis. Figures 2 and 3⇓⇓ show two typical examples of the cholangiographic spectrum of PSC.

Cholangiography showing type I intrahepatic and type 0 extrahepatic disease.
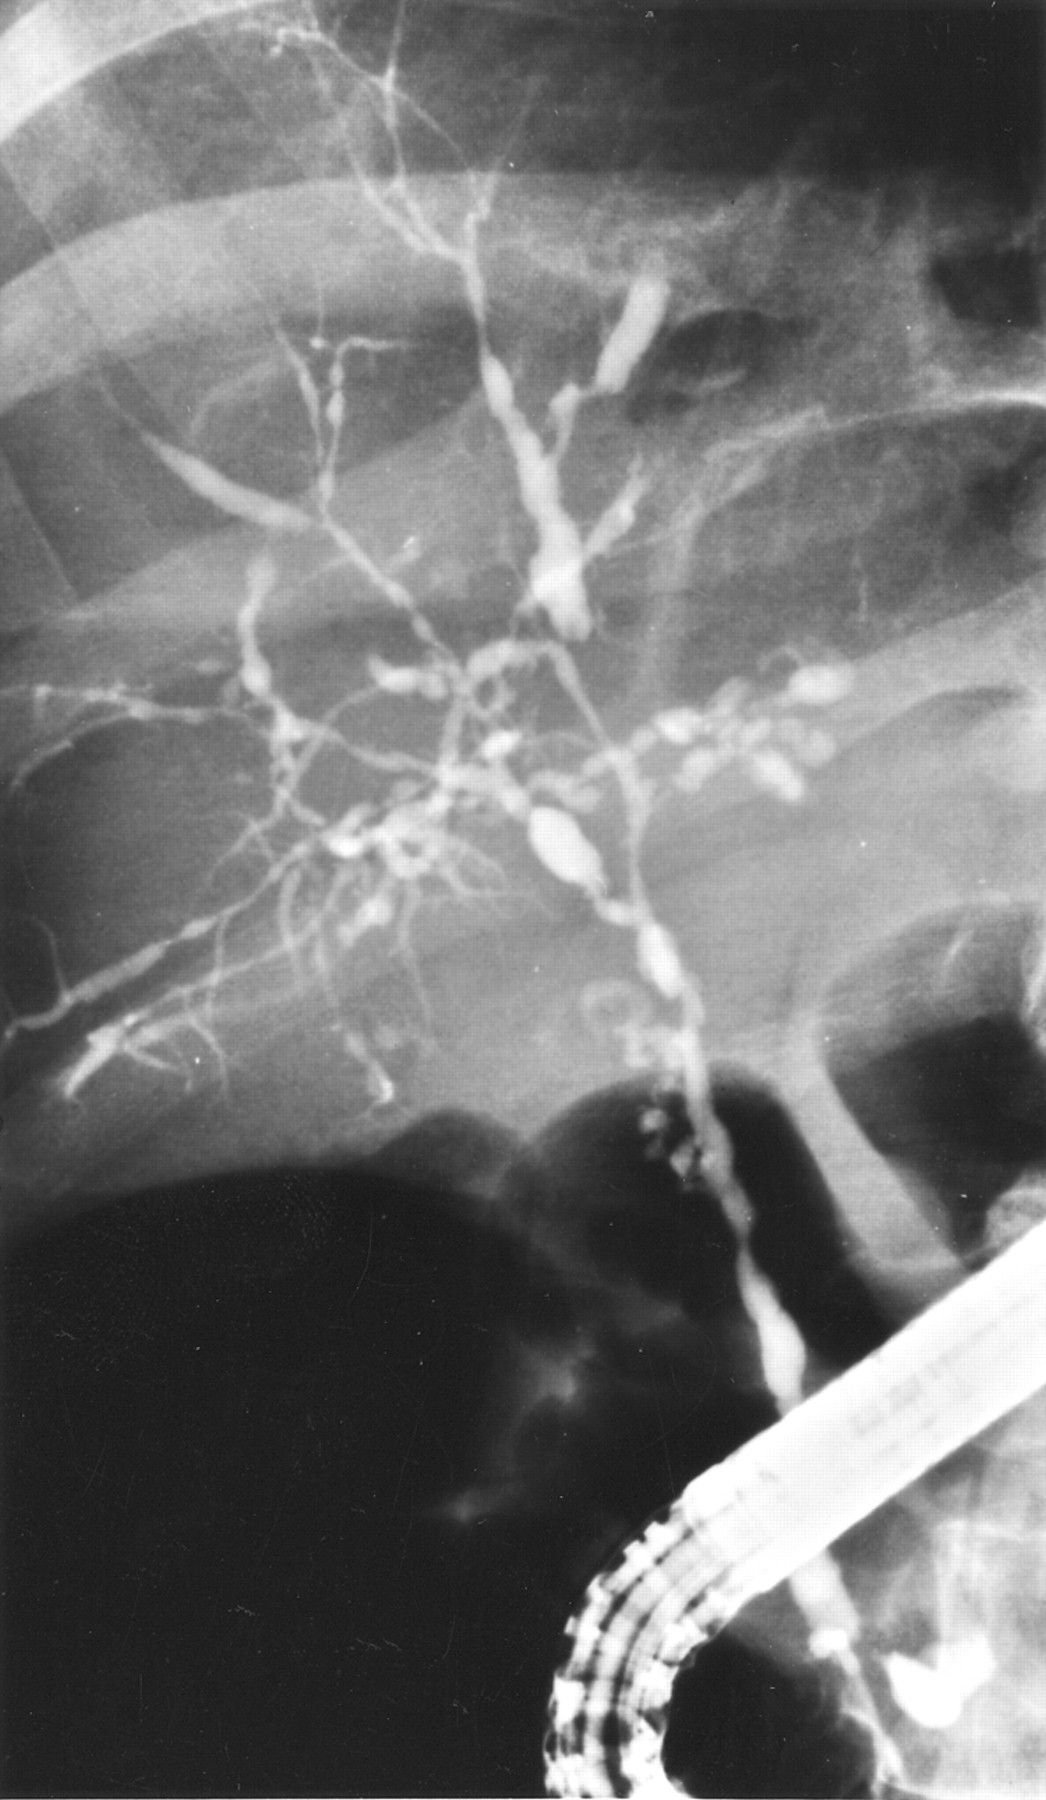
Cholangiography showing type II intrahepatic and type III extrahepatic disease.
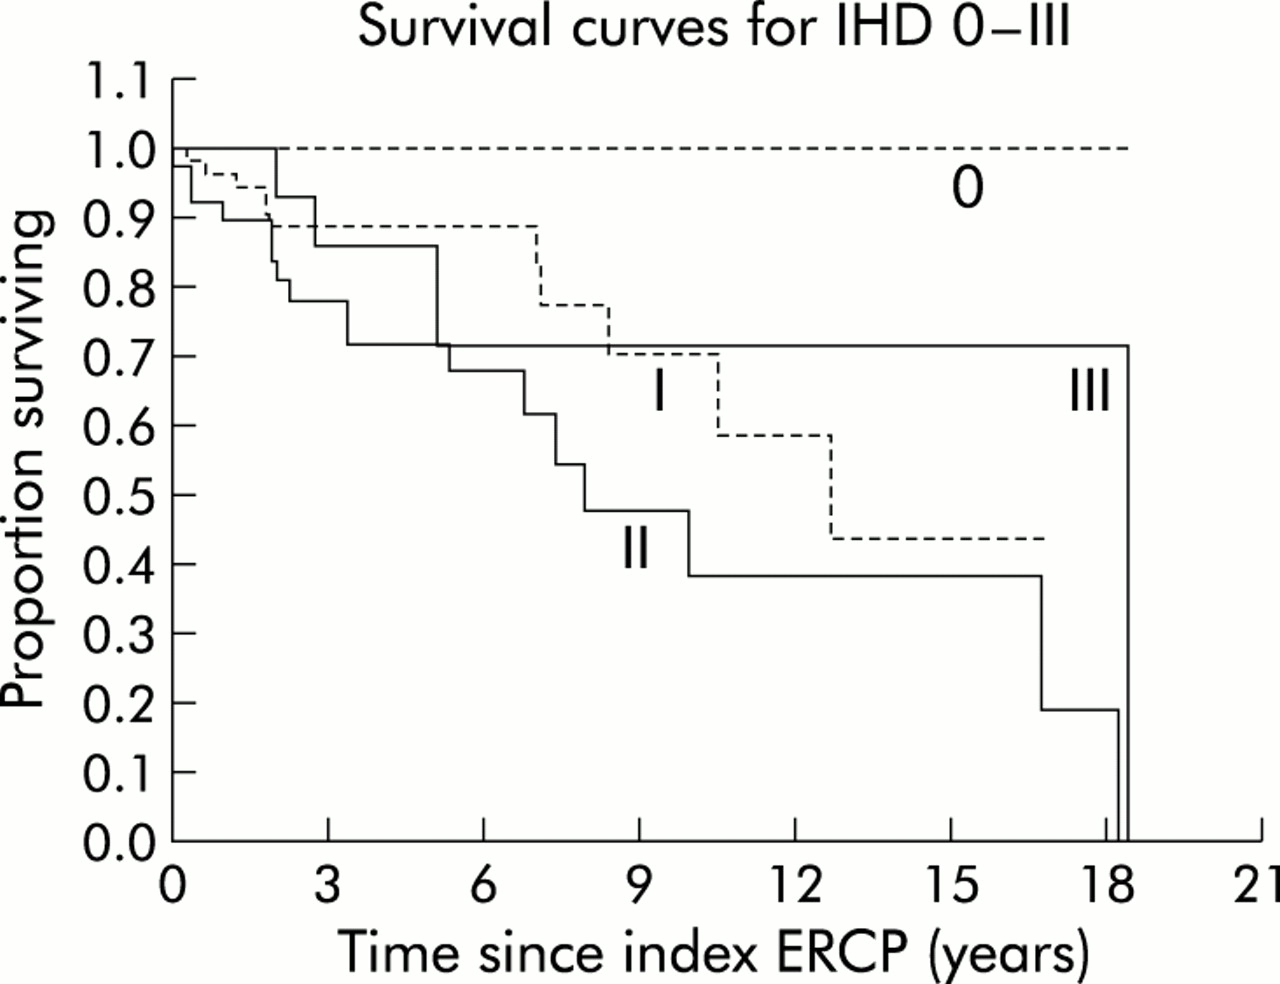
Cumulative survival from the time of the index ERCP for the various intra- and extrahepatic disease types is displayed in figs 4 and 5⇓⇓, respectively. As can be seen in fig 5⇓, differences in survival between extrahepatic disease (EHD) stages 0 and I, and EHD stages III and IV were negligible and not significant (p=0.91 and p=0.58, respectively). Therefore, stages 0 and I were combined into stage I‘, and stages III and IV were grouped into stage III‘. This resulted in a new parameter EHD‘.

Survival curves for intrahepatic disease (IHD) types 0–III. Type 0, n=9; type I, n=66; type II, n=40; type III, n=18. ERCP, endoscopic retrograde cholangiopancreatography.

Survival curves for extrahepatic disease (EHD) types 0–IV. Type 0, n=13; type I, n=22; type II, n=70; type III, n=17; type IV, n=10. ERCP, endoscopic retrograde cholangiopancreatography.
Computing a prognostic model
The assumption was made that both intra- and extrahepatic abnormalities would reflect disease severity. Hence both intra- and extrahepatic scoring would be expected to play a role in determining prognosis. Extensive Cox proportional hazards analysis yielded a single parameter that performed best in predicting survival (p=0.0026). This categorical parameter (SUMIHDEHD‘) was composed of the sum of the intrahepatic scoring (IHD) and the modified extrahepatic scoring (EHD‘). The range of possible values for SUMIHDEHD‘ was 1–6. As the difference in survival curves for the values 3 and 4 was almost nil (p=0.91), these values were taken together. The resulting categorical parameter SUMIHDEHD‘‘ contained five possible values (1–5) and was highly significant in predicting survival (p=0.0008). Table 2⇓ shows the resultant SUMIHDEHD‘‘ score as a function of IHD and EHD.
Resultant SUMIHDEHD‘‘ score from intrahepatic (IHD) and extrahepatic (EHD) disease. The score can be read from the intersection of the pertaining EHD row and IHD column (the combination 0–0 is non-existent because it would preclude a diagnosis of primary sclerosing cholangitis)
In order to assess the influence of other variables such as AGEERCP, duration of disease until index ERCP, sex, concurrent IBD, and cholecystectomy, backward regression was performed including these variables in the model. Only AGEERCP moderately improved the significance of the overall likelihood (p=0.0003). However, independent contribution to the predictive power of the model was only borderline significant (p=0.06).
Assumption of proportional hazards for a Cox regression model fit was tested and found to be valid (p=0.84).
Figure 6⇓ shows the predicted survival curves for the three categories of SUMIHDEHD‘‘ present in the cohort, along with the Kaplan-Meier plots of the estimated survival in these categories. The curves were truncated at 15 years to avoid misinterpretation of the increasingly unreliable right hand side.

Kaplan-Meier cumulative survival curves and predicted survival curves according to the Cox model for the various categories of SUMIHDEHD‘‘ at mean of covariate AGEERCP (categories 1 and 5 for SUMIHDEHD‘‘ were not present in the cohort).
The prognostic index (PI) based on the survival function was as follows: where X3=0 and X4=0 if SUMIHDEHD‘‘= 2; X3=1 and X4=0 if SUMIHDEHD‘‘= 3; and X3=0 and X4=1 if SUMIHDEHD‘‘= 4; Y = AGEERCP in years. (SUMIHDEHD‘‘ scores 1 and 5 were not present in the cohort.)
Higher scores were associated with a considerably poorer prognosis. The relative risk at OLT or death from liver disease of SUMIHDEHD‘‘ score 3 versus score 2 was 3.1 (95% CI 0.7–13.4). The relative risk of SUMIHDEHD‘‘ score 4 versus score 2 was 7.3 (95% CI 1.5–34.7). Each 10 year increment of AGEERCP was associated with a relative risk of 1.3.
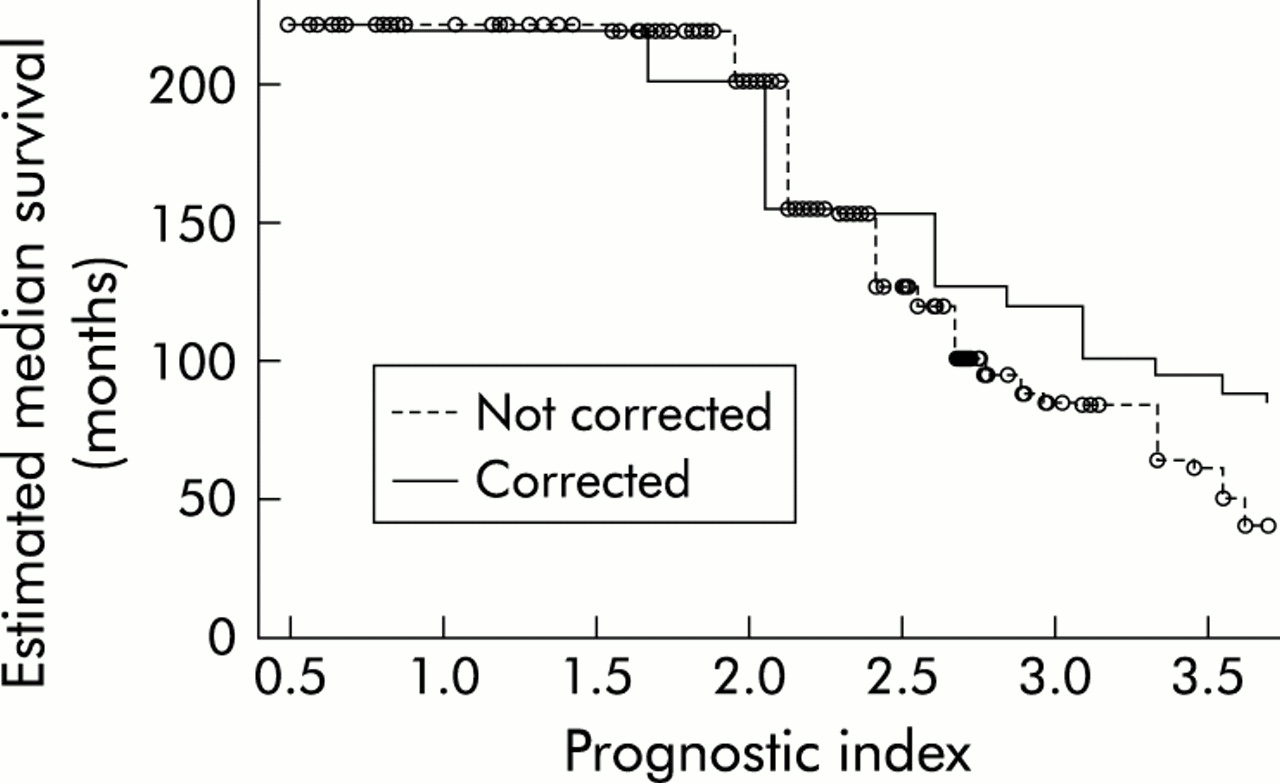
After calculation of PI, the estimated median survival can be determined from the graph in fig 7⇓. In order to correct for particularities in a limited data set, the model was improved by calibration with the leave-one-out method, as described by Verweij and colleagues.10 The effect of this procedure is that good predictions become slightly poorer, and bad predictions become somewhat better. This can be appreciated by the more horizontal slope of the corrected curve in fig 7⇓.

Estimated median survival as a function of the prognostic index before and after calibration.
As an example, the patient whose cholangiogram is depicted in fig 3⇑ was 48 years old at the time of ERCP. Her SUMIHDEHD‘‘ score was 4. Thus her PI was 1.98×1+0.024×48=3.13. From fig 7⇑ it can be read that her estimated median survival would be approximately 105 months. At closure of follow up, her follow up after ERCP was 98 months. She was alive, symptomatic, with some signs of liver cirrhosis but adequate synthetic liver function.
DISCUSSION
The results of this cohort study, which is the second largest reported (together with the Mayo Clinic series), containing the longest follow up so far, showed that median survival appears to be considerably better than reported previously. Three previously published studies involving more than 100 patients1–,3 reported on cohorts mainly from the 1970s and 1980s from the USA, the UK, and Sweden. All three recorded a median survival of approximately 12 years. In contrast, we found a 50% better median survival (18 years). The reasons for this discrepancy may be multifactorial. Selection bias may play a role. However, the general patient characteristics were similar in all four series. In the study from the Mayo Clinic, the date of referral was taken as the time of diagnosis which may have given rise to considerable underestimation of total disease duration. Moreover, death from any cause was regarded as an end point. However, when the six non-liver related deaths in our series were included as an end point in the survival analysis, the estimated median survival was 17.5 years, still much longer than that in the Mayo cohort. The King’s College and Swedish studies used the same end points as in the present study. The Swedish study defined baseline time as the date of diagnosis, as we did. The British study defined baseline as the time of the first symptom consistent with—in retrospect—a diagnosis of PSC. Compared with our series, as well as with the Swedish cohort, this could give rise to a substantial increase in median survival time inasmuch as parameters such as elevated liver function tests may precede a diagnosis of PSC by many years. Yet median survival in our series was 50% longer than that in the series from King’s College.
Alternatively, the time frame studied may be important. The series from the USA, the UK, and Sweden contained cohorts mainly from the 1970s–1980s while our cohort also spanned 1990–1999. Substantial therapeutic advances aimed at slowing down disease progression have not been made in the last decade but perhaps the diagnosis is now made earlier and hence ascertainment bias may well play a role.
The prevalence of CCA in the above mentioned studies was 6–8%. In our series, the prevalence of secondary CCA was somewhat worse (10%). This may be a result of the longer follow up period in our series. The actual prevalence may even be somewhat higher as not all patients who died were autopsied.
Several prognostic models have been proposed to predict the course of PSC and to tailor the timing of OLT.11,12 Independent variables for these models are age, histological staging, and serum bilirubin. However, hepatic histological biopsy findings can be non-specific, with a considerable degree of sampling variability, because the disease may not be evenly spread throughout the liver, and the pathognomonic onion skin lesion can easily be missed.13–,15 Thus for diagnosis, liver biopsy is usually not done and histological staging may be variable. Likewise, serum bilirubin levels at presentation may be an unreliable indicator of disease stage. For instance, when a patient presents with suppurative cholangitis caused by a bile plugged distal dominant stricture, but otherwise patent biliary tree, the elevated serum bilirubin may soon revert to normal when the obstruction is relieved.
The mainstay of diagnosis is cholangiography and therefore it seems obvious to develop predictors based on cholangiographic abnormalities. Two studies have assessed the prognostic value of cholangiography.4,5 Both concluded that high grade intrahepatic strictures indicated poor prognosis. However, grading of intrahepatic strictures in these studies was rather detailed and may be difficult to reproduce because the degree of narrowing of strictures may vary considerably, depending on the amount of contrast injected into the biliary tree. On the other hand, the Amsterdam cholangiographic classification system uses a more qualitative appreciation of the abnormalities in the biliary tree in PSC patients.7,8 To date, this classification has not been evaluated clinically in terms of predicting prognosis. On the assumption that both intrahepatic scoring and extrahepatic scoring influence disease severity and—consequently—survival, a variable was defined representing both scorings. The resulting variable SUMIHDEHD‘‘ showed that there was a clear inverse correlation between combined morphological stage and survival. Moreover, a PI was computed on the basis of SUMIHDEHD‘‘. The predicted survival plots for the various categories of SUMIHDEHD‘‘ closely matched the actual estimated cumulative survival curves for these categories. However, the definitive value of our prognostic model can only be determined after cross validation.
In conclusion, survival of Dutch PSC patients is considerably better than reported previously. The Amsterdam cholangiographic classification system reflects disease stage and has the potential to serve as a predictor in determining prognosis. This may prove useful in patient selection and timing of liver transplantation, patient counselling, and stratifying patients for therapeutic trials.
Acknowledgments
The authors are indebted to Dr AWM van Milligen de Wit Red Cross Hospital, the Hague, and Dr W Bruins Slot, Spaarne Hospital, Haarlem, for providing some patient data.