Article Text

Abstract
Background and aims: The mechanism of the developmental downregulation of the lactase-phlorizin hydrolase (LPH) gene underlying adult-type hypolactasia is unknown. We have determined the functional significance of the recently identified two single nucleotide polymorphisms (SNPs), C/T−13910 and G/A−22018, associated with adult-type hypolactasia by studying LPH mRNA levels in intestinal biopsy samples with different genotypes.
Methods: Intestinal biopsy samples were taken from 52 patients with abdominal complaints. Hypolactasia was diagnosed by determining lactase and sucrase activities and calculating their ratio (L/S ratio). The functional effect of the C/T−13910 and G/A−22018 genotype on expression of LPH mRNA was demonstrated in patients heterozygous for the C/T−13910 and G/A−22018 polymorphism and an informative expressed SNP located in the coding region of the LPH mRNA. Reverse transcription-polymerase chain reaction followed by solid phase minisequencing was used for accessing the relative expression levels of the LPH alleles using informative SNPs located in exons 1, 2, 6, 10, 13, or 17 as markers.
Results: Statistically significant differences between the three different genotypes CC−13910 GG−22018, CT−13910 GA−22018, and TT−13910 AA-22018 and their respective L/S ratios were observed. Relative quantitation of the expressed LPH alleles showed that the persistent allele represented 92 (6)% (mean (SEM), range 78–99%; n=14) of the expressed LPH mRNA. The patient with the homozygous persistent TT−13910 AA−22018, as well as hypolactasic patients with CC−13910 GG−22018, showed equal expression of both alleles (47 (1)%; n=7).
Conclusions: Expression of LPH mRNA in the intestinal mucosa in individuals with T−13910 A−22018 alleles is several times higher than that found in individuals with C−13910, G−22018 alleles. These findings suggest that the two SNPs, C/T−13910 and G/A−22018, associated with adult-type hypolactasia, are associated with the transcriptional regulation of the LPH gene. The presence of the T−13910 A−22018 allele also shows significant elevation of the L/S ratio.
- adult-type hypolactasia
- transcriptional regulation
- lactase-phlorizin hydrolase gene
- lactase-phlorizin hydrolase
- polymorphism
- LPH, lactase-phlorizin hydrolase
- SNP, single nucleotide polymorphism
- cSNP, coding region single nucleotide polymorphism
- L/S ratio, lactase/sucrase ratio
- RT-PCR, reverse transcription-polymerase chain reaction
- dNTP, deoxynucleotide triphosphate
Statistics from Altmetric.com
- adult-type hypolactasia
- transcriptional regulation
- lactase-phlorizin hydrolase gene
- lactase-phlorizin hydrolase
- polymorphism
- LPH, lactase-phlorizin hydrolase
- SNP, single nucleotide polymorphism
- cSNP, coding region single nucleotide polymorphism
- L/S ratio, lactase/sucrase ratio
- RT-PCR, reverse transcription-polymerase chain reaction
- dNTP, deoxynucleotide triphosphate
Adult-type hypolactasia (MIM 223100), also known as lactose malabsorption or lactase non-persistence, is an autosomal recessive condition that affects about half of the world’s population. It is caused by the developmental downregulation of the lactase-phlorizin hydrolase (LPH) enzyme in the brush border of small intestinal epithelial cells.1 Adult-type hypolactasia is inherited as an autosomal recessive trait, the persistent state having a dominant effect over the non-persistent state.2 Although the genetic background of adult-type hypolactasia is well recognised, the mechanism underlying the persistence of high intestinal lactase activity has not yet been clarified.
We have recently identified two single nucleotide polymorphisms (SNPs), C/T–13910 and G/A–22018, residing approximately 14 kb and 22 kb upstream of the 5′ end of the LPH gene, respectively, that completely cosegregate with the persistent/non-persistent trait in Finnish hypolactasia (non-persistent) families. All hypolactasic family members showed homozygosity for both C−13910 and G−22018. One of the variants, C/T–13910, was found to be completely associated with lactase non-persistence in a study sample of 236 individuals with biochemically verified lactase persistence/non-persistence status whereas seven of 236 lactase non-persistence cases were heterozygous G/A–22018. Analysis of another sample set of more than 100 intestinal biopsies with biochemically verified disaccharidase activities further confirmed the association of these SNPs with the lactase persistent trait (H Rasinperä, unpublished data). Furthermore, the frequency of these variants is in agreement with the reported prevalence of adult-type hypolactasia in several populations.3
To explore the functional significance of these variants at the molecular level, we have studied the effect of the C/T−13910 and G/A−22018 SNPs on expression of LPH mRNA in the intestinal mucosa by reverse transcription-polymerase chain reaction (RT-PCR) followed by solid phase minisequencing, which is a method for quantifying the relative expression levels of highly homologous mRNAs.4 Lactase and sucrase activities and their ratio (L/S ratio) in the mucosa were also determined.
MATERIALS AND METHODS
Patients, blood, and intestinal biopsy samples
Two biopsies from the descending duodenum below the level of the papilla Vateri from the same or an adjacent duodenal fold were harvested during routine gastroscopies from an independent set of 52 patients with abdominal complaints. Two additional biopsy specimens from the duodenum were taken for histological examinations, which showed normal villous mucosa in all patients. Peripheral blood samples for genotyping were drawn at the patients’ visits to the endoscopy unit. The study was approved by the ethics committee of Helsinki University Hospital. All the patients gave their written informed consent.
The first biopsy specimen, frozen, and stored at −20°C, was used to determine lactase and sucrase activities and the L/S ratio.4 The second biopsy specimen, submerged in RNAlater solution (Qiagen, Hilden, Germany) incubated at +4°C overnight and stored at −20°C, was used for isolation of total RNA, for lactase mRNA specific RT-PCR, and for solid phase minisequencing to determine relative mRNA levels.5 Peripheral blood samples were used to isolate DNA for genotyping individuals for C/T−13910 and G/A−22018, and to search for informative SNPs from the coding area of the LPH gene by direct sequencing.6
Genotyping
DNA was isolated from peripheral blood samples by submerging a blank strip (Merck, Darmstadt, Germany) into EDTA blood. Strips were dried and heated in 1×PCR reaction buffer (Dynazyme; Finnzymes, Espoo, Finland) containing 10 mmol/l Tris HCl (pH 8.8 at 25°C), 50 mmol/l KCl, 1.5 mmol/l MgCl2, and 0.1% Triton X-100, and degraded proteins were centrifuged. The supernatant (15–20 μl) containing the DNA was amplified in a total volume of 50 μl containing: 1× PCR buffer, 10 nmol deoxynucleotide triphosphates (dNTPs) (Amersham Pharmacia Biotech, Uppsala, Sweden), and 30 pmol forward and reverse primers amplifying the SNPs3 or exons 1, 2, 6, 10, 13, or 17 (table 1). All PCR reactions were amplified under the following conditions: after heating at +94°C for four minutes, PCR was initiated by a hot start (1 U of Taq polymerase), samples were cycled 34 times with a 30 second annealing step at +55°C, a 30 second extension step at +72°C, and a 30 second denaturing step at +94°C, followed by the last 30 second annealing step at +55°C and 10 minutes extension at +72°C. PCR products were run on a 1.5% agarose gel electrophoresis with ethidium bromide to verify the size of the PCR product. PCR products were sequenced on both strands (BigDye Terminator RR mix), run on an ABI 377 Sequencher, and analysed using ABI Sequencing Analysis 3.3 (Applied Biosystems, Perkin Elmer, Foster City, California, USA) Sequencher 4.1 (Gene Godes, Ann Arbor, Michigan, USA) to determine the genotypes of the C/T−13910 and G/A−22018 polymorphisms of each patient.
Primers used for reverse transcription-polymerase chain reaction (RT-PCR), minisequencing, and direct sequencing
RNA isolation, RT-PCR, and quantitation of RNA levels
Duodenal biopsy specimens were homogenised using a sterile syringe and a 20 gauge (Ø 0.9 mm) needle. Total RNA was isolated by the guanidium thiocyanate method (RNeasy mini kit; Qiagen) followed by DNase treatment. RNA was reverse transcribed into complementary DNA (cDNA) using 20 pmol of LPH transcript specific reverse primers downstream from each detectable variant (table 1), GA+593 in exon 1, CT+665 in exon 2, GT+1269 in exon 6, GA+4339 and GA+4357 in exon 10, CT+4926 in exon 13, and CT+5578 in exon 17, in a 20 μl reaction mixture containing 3 mmol/l MgCl2, 50 mmol/l Tris-HCl (pH 8.3), 75 mmol/l KCl, 10 nmol dNTPs, 20 mmol/l DTT, 24 U RNase inhibitor (RNAguard; Amersham Pharmacia Biotech), and 200 U of reverse transcriptase, Superscript II (Invitrogen, Bloomington, Minnesota, USA). RT reactions were performed at +50°C for 60 minutes and stored at −20°C. PCR was performed in 1×PCR reaction in 50 μl containing 2 μl cDNA, with the previously described LPH transcript specific reverse primer and a corresponding forward primer, 30 pmol biotinylated and 60 pmol non-biotinylated primer, and 1 U of Taq polymerase (table 1). PCR reactions were performed as described in the genotyping section. mRNA levels of each PCR product were quantified by the solid phase minisequencing method.7
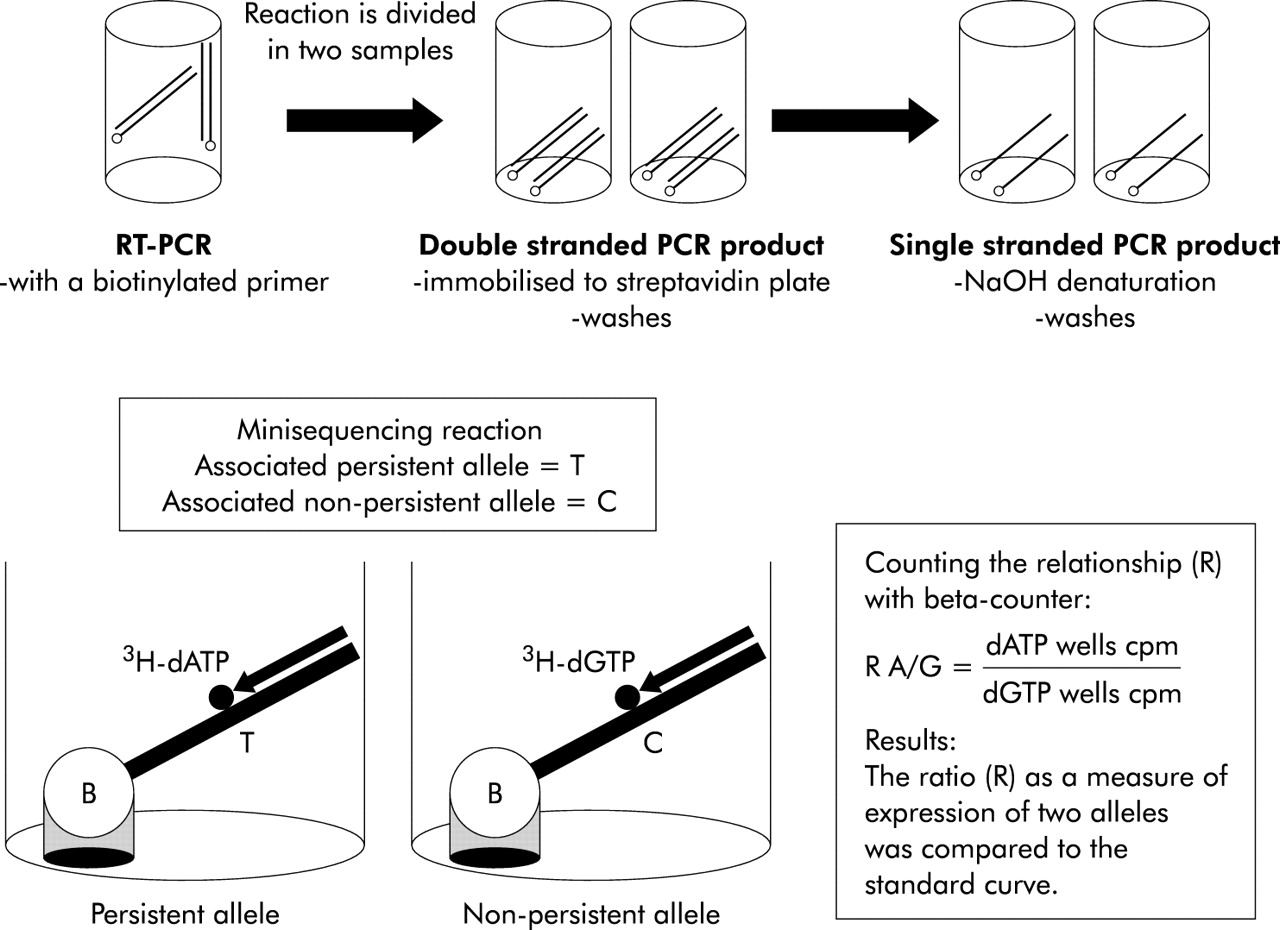
Each of the previously described biotinylated PCR products were divided in two 10 μl samples. PCR products were immobilised on a streptavidin coated solid support by incubation with 40 μl of 20 mmol/l Na2SO4 (pH 7.5), 0.15 mol/l NaCl, and 0.1% Tween 20 in streptavidin coated microtitre wells for 90 minutes at 37°C (Thermomix; Labsystems, Helsinki, Finland). The wells were washed six times with 350 μl of 40 mmol/l Tris HCl, pH 8.8, 1 mmol/l EDTA, 50 mmol/l NaCl, and 0.1 % Tween 20 using an automated washer (Multiwasher; Labsystems). To remove the complementary strand of the immobilised PCR product, wells were incubated with 100 μl of 50 mmol/l NaOH for five minutes and washed six times, as described previously. Minisequencing reaction mix (50 μl) containing 20 pmol of the corresponding detection primer for each variant (table 1), 0.5 U of Taq polymerase 1×PCR buffer, and 2 pmol tritium labelled dNTP:3H-dTTP (111 Ci/mmol), 3H-dCTP (64 Ci/mmol), 3H-dGTP (33 Ci/mmol), or 3H-dATP (69 Ci/mmol) (Amersham Pharmacia Biotech). The minisequencing reaction was performed for 10 minutes at 50°C. Wells were washed as described above. Wells were treated with 60 μl of 50 mmol/l NaOH for five minutes to release tritium labelled detection primers. NaOH solution (50 μl) with eluted detection primer was added to 100 μl of scintillation liquid (Perkin Elmer). The principle of minisequencing is shown in fig 1.

The principle of quantitation of mRNA levels by solid phase minisequencing. RT-PCR, reverse transcription-polymerase chain reaction.
The incorporated 3H labelled nucleotides were measured using a scintillation counter (1450 Microbeta; Perkin Elmer). The ratio (R) between the incorporated labels was calculated by the equation:


Preparation of the standard curve
A standard curve was constructed to relate the result of the minisequencing assay with the actual relative amounts of LPH mRNA derived from the two LPH alleles. In our material, the most common informative cSNP, GA+593, located 593 nucleotides downstream of the starting codon of the LPH gene in exon 1, was used here as an example. Two total RNA samples, one homozygous for GG+593 and the other homozygous for AA+593, were first mixed at various ratios (20, 40, 60, and 80% of AA+593 containing total RNA sample). These RNA mixtures were subjected to RT-PCR and solid phase minisequenced together with an amplification product of a genomic DNA sample in which these alleles are present at exactly 1:1 ratio. This was used to calculate the relative amounts of the A and G alleles in these RNA samples. Based on this information the RNA samples were mixed to give RNA mixtures having A and G allele mRNAs at known proportions (table 2). Samples for construction of the standard curve and the patients’ RNAs informative for G/A+593 were then amplified simultaneously by RT-PCR and studied by solid phase minisequencing. As a result, a standard curve was created where the per cent of A+593 is a function of the AG+593 ratio on a log scale (fig 2). This curve was used to calculate the level of expression of both alleles present in the actual biopsy samples. The standard curve was observed to be linear up to 92% A+593 (y=−1.276+0.023x) and for 92–100% A+593 the standard curve behaved exponentially (y=2×10⁻¹⁰×e0.2618x).
A dilution series of total RNA containing known proportions of expressed G+593 and A+593 alleles with their calculated ratios and logaritms
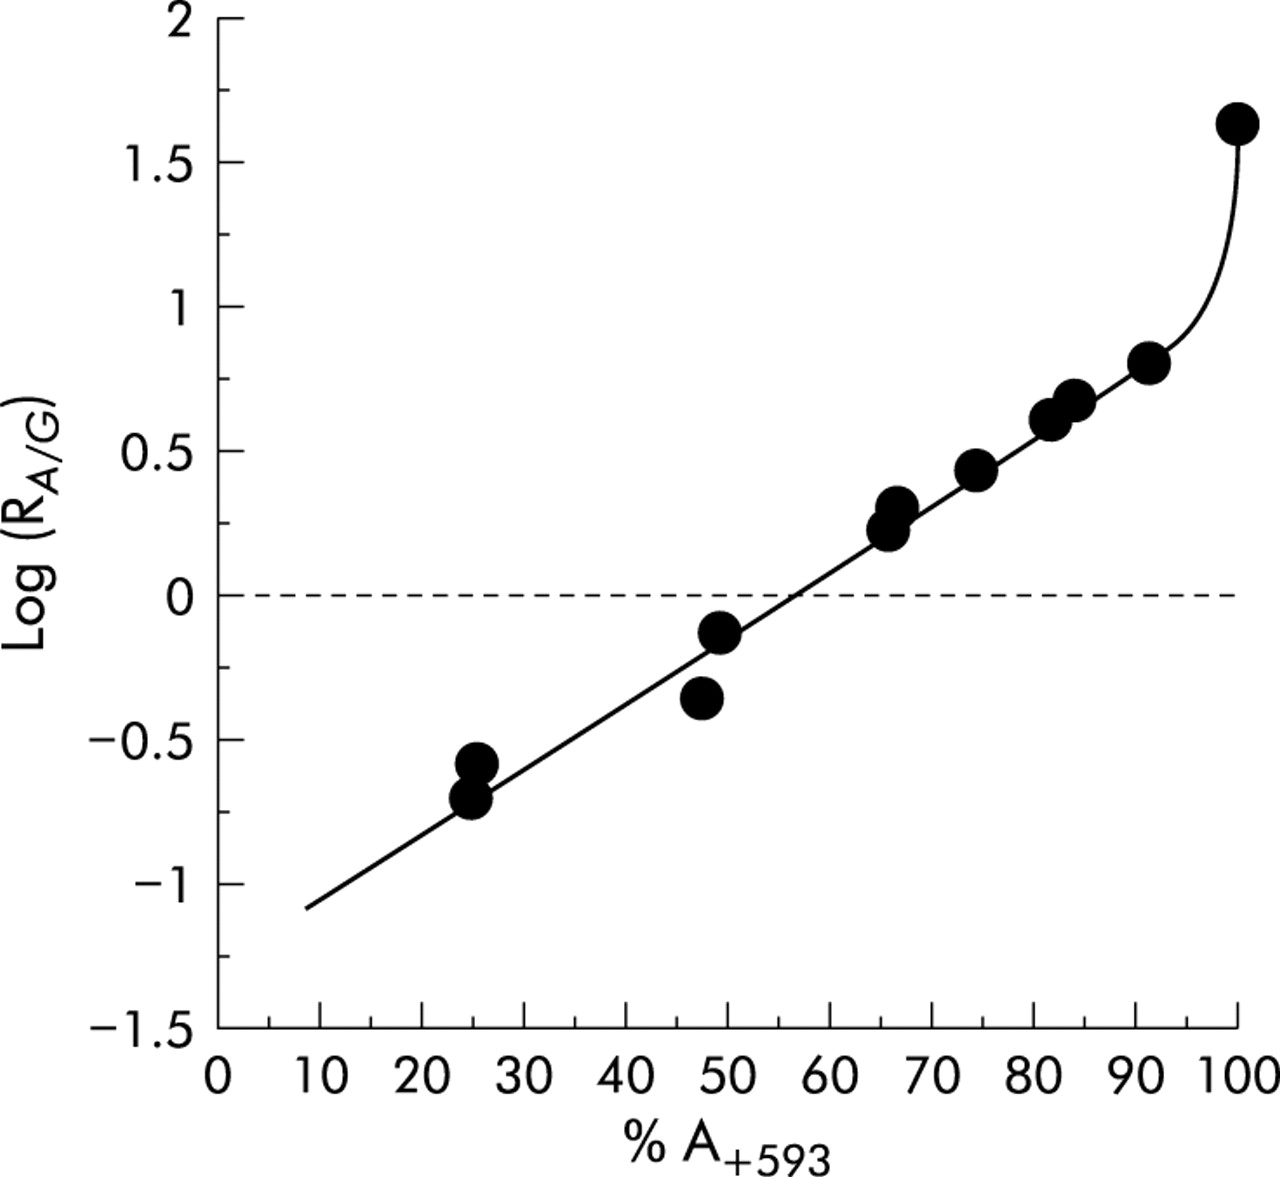
Standard curve constructed for determination of the amount of expressed alleles (%) using solid phase minisequencing. The amount of A+593 allele in total RNA is plotted as a function of the AG+593 ratio on a log scale.
RESULTS
Genotypes CC−13910 and GG−22018 associated with adult-type hypolactasia were detected in 11 of 52 (21%) patients. They had low lactase activities (4–9 U/g) and L/S ratios (0.05–0.18). Twenty three of the 52 (44%) patients were heterozygous for CT−13910 and GA−22018, respectively, and their lactase activities ranged from 13 to 49 U/g and their L/S ratios from 0.35 to 0.69. Homozygous TT−13910 and AA−22018 were detected in 18 of 52 (35%) patients whose lactase activities ranged from 18 to 87 U/g and L/S ratios from 0.49 to 1.05 (table 3, fig 3). A statistically significant difference between each genotype and their corresponding L/S ratio was found (p<0.0001, Fischer’s PLSD).
Genotypes of each individual with their quantitative allelic expression of mRNA of informative lactase-phlorizin hydrolase (LPH) exons, lactase activities, and lactase/sucrase (L/S) ratio

Ratio of lactase/sucrase (L/S) activities versus genotype of each individual.
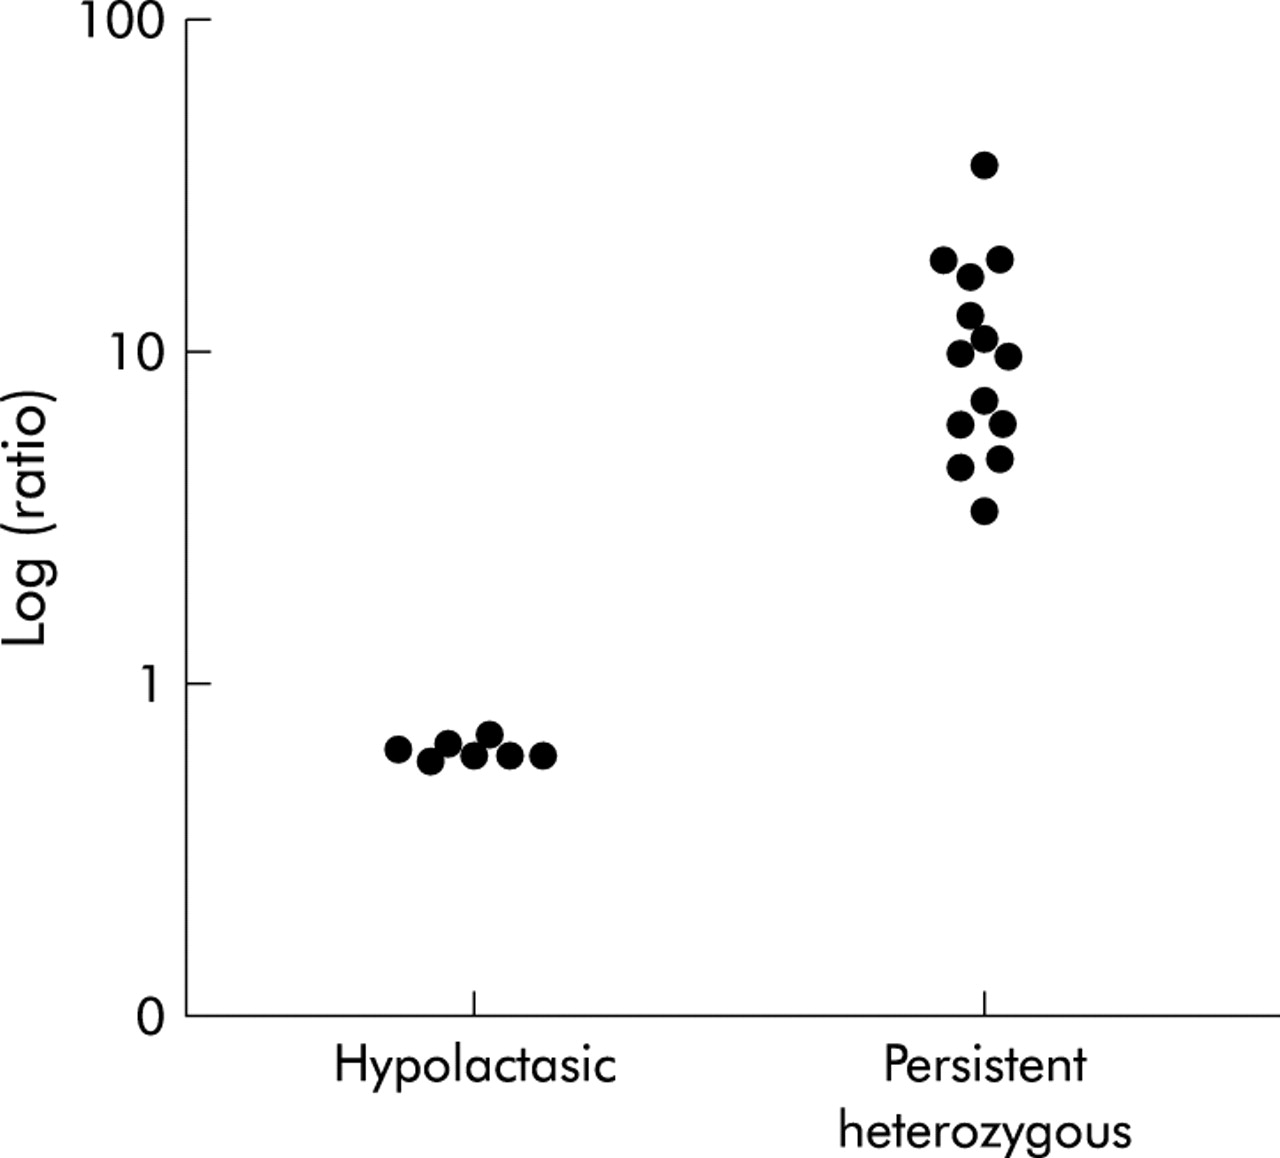
Based on our experience, the most polymorphic coding region SNPs (cSNPs) of the LPH gene are located in exon 1 and exon 17 in Finnish families. These cSNPs were primarily chosen to quantify relative mRNA levels. Of the 52 patients studied, 22 (42%) were found to be heterozygous for one or both of these cSNPs. Novel polymorphisms were looked for in the 30 uninformative patients by direct sequencing of exons 2, 6, 10, and/or 13. Six of the patients were heterozygous for at least one of the sites. The majority of the remaining 24 patients were genotypically homozygous persistent TT−13910, AA−22018, and no cSNPs were identified for the exons listed above. Thus 11 hypolactasic patients, 16 patients heterozygous for lactase persistence, and one patient homozygous for lactase persistence were further analysed for relative allelic expression by minisequencing. The minisequencing results showed that individuals with the CC−13910 GG−22018 genotype equally expressed both LPH alleles, but a clear increase in the R value of individuals heterozygous for CT−13910 and GA−22018 was seen, independent of any of the cSNPs located in the markers—that is, exons 1, 2, 6, 10, 13, or 17 (table 3). A standard curve was prepared for the GA+593 cSNP in exon 1 to relate the elevation in R value with an elevated number of template mRNA copies in an attempt to determine the actual difference in expression of the LPH alleles. Relative quantitation of the LPH alleles expressed using exon 1 cSNP as a marker showed that the persistent allele represented 92 (6)% (mean (SEM), range 78–99%; n=14) of the total LPH mRNA, a mean 11.5-fold difference in the relative amounts of the LPH alleles. The patient with the homozygous persistent TT−13910 AA−22018 genotype as well as hypolactasic patients with the CC−13910 GG−22018 genotypes had equal expression of both alleles (47 (1)%; n=7) (table 3). Only one subject homozygous for lactase persistent T−13910 A−22018 was found to be informative for one of the SNPs of the coding region of the LPH gene. This individual equally expressed both LPH mRNA alleles (table 3). Expression levels of the LPH gene between hypolactasic and heterozygous persistent individuals could be clearly distinguished from each other (fig 4).
Expression levels of the lactase-phlorizin hydrolase gene between hypolactasic and heterozygous persistent individuals could be distinguished from each other—for example, exon 1 (allelic ratio on log scale versus genotype).
DISCUSSION
In the present study, all individuals with genotype CC−13910 and GG−22018 had both low lactase activity and a low L/S ratio whereas all those either heterozygous for CT−13910 and GA−22018 or homozygous for T−13910 and A−22018 had lactase activities >13 U/g and L/S ratios >0.35 U/g. Furthermore, significant correlations between the three different genotypes and their corresponding L/S ratios were observed. These results further confirm the association of these SNPs with the lactase persistent trait.3
Quantitation of relative mRNA levels showed a clear difference between patients with hypolactasia and persistent genotypes. Patients with the CC−13910 GG−22018 genotype expressed both alleles equally well whereas subjects heterozygous for the CT−13910 GA−22018 genotype had a mean 11.5-fold higher expression of the persistent allele with concomitant downregulation of the non-persistent allele. The patient with the homozygous persistent genotype TT−13910 AA−22018 equally expressed both alleles. These findings provide the first evidence that the SNPs C/T−13910 and G/A−22018, cosegregating with adult-type hypolactasia, are associated with transcriptional regulation of the LPH gene. Our findings are in agreement with previous observations that lactase persistence/non-persistence is controlled by a cis acting element.8,9 Furthermore, based on quantitation of individual nucleotides in the LPH cDNA, their different expression levels can be distinguished from each other. For example, in G/A+593 in exon 1, G+593 nucleotide shows lower expression than A+593, thus being the allele that is downregulated in hypolactasia (fig 4).
In several studies, regulation of LPH gene expression has been shown to operate at the level of transcription10,11 and/or mRNA stability.8,9 However, both transcriptional and post-transcriptional control of expression of the LPH gene has been suggested.12–14 In the present study, we used an accurate method which operates at the molecular level to quantify mRNA levels. The equal allele expression ratios obtained from patients with homozygous CC−13910 GG–22018 alleles strongly indicate that the stability of the mRNA was not affected. By measuring relative mRNA levels, one can avoid most of the technical variation often seen in this type of study. This method has previously been applied to tumour classification15 and to study of the functional consequences of disease mutations.16,17 In this study, both polymorphisms, C/T−13910 and G/A−22018, completely cosegregated with the lactase persistent trait. Thus it remains unclear whether one or both are needed for downregulation of the LPH enzyme.
SNPs associated with hypolactasia/lactase persistence reside at a reasonable distance from the LPH gene. The first associated variant, C/T–13910, is located 13910 bp 5′ from the initiation codon of the LPH gene within a 100 bp fragment showing homology to a LINE 2 repeat element in intron 13 of the MCM6 gene. The second associated variant, G/A 22018, is located at a position 22018 bp from the first ATG codon of the LPH gene within an ALU repeat element in intron 9 of the MCM6 gene.
Similarly, strong distal regulatory elements have previously been found—for example, apoE,18 β-globin,19–21 myoD,22 PIT1/GHF1,23 and PU.124 genes. The MCM6 gene has been shown to function as a replication factor in rat intestinal cells.25 However, RT-PCR experiments have shown that unlike LPH, expression of MCM6 is not restricted in mucosa and there is no individual variation in adult intestine.26
In conclusion, RT-PCR followed by solid phase minisequencing, allowing accurate determination of relative mRNA levels of LPH transcripts, appeared to find an order of magnitude higher expression of the persistent allele in subjects heterozygous for both the CT−13910 and GA−22018 persistent genotypes. The effect of the T−13910, A−22018 allele was also observed as elevation of the L/S ratio. These findings provide a basis for further studies to explore the molecular mechanism underlying lactase persistence in humans.
Acknowledgments
We are grateful to the patients who participated in the study. This study was supported by Helsinki University Research Funding and the Sigrid Juselius Foundation, Helsinki, Finland.
REFERENCES
Linked Articles
- Commentary