Article Text

Abstract
Background and aims: The intestinal bacterial microflora plays an important role in the aetiology of inflammatory bowel disease (IBD). As most of the colonic bacteria cannot be identified by culture techniques, genomic technology can be used for analysis of the composition of the microflora.
Patients and methods: The mucosa associated colonic microflora of 57 patients with active inflammatory bowel disease and 46 controls was investigated using 16S rDNA based single strand conformation polymorphism (SSCP) fingerprint, cloning experiments, and real time polymerase chain reaction (PCR).
Results: Full length sequencing of 1019 clones from 16S rDNA libraries (n = 3) revealed an overall bacterial diversity of 83 non-redundant sequences—among them, only 49 known bacterial species. Molecular epidemiology of the composition of the colonic microflora was investigated by SSCP. Diversity of the microflora in Crohn’s disease was reduced to 50% compared with controls (21.7 v 50.4; p<0.0001) and to 30% in ulcerative colitis (17.2 v 50.4; p<0.0001). The reduction in diversity in inflammatory bowel disease was due to loss of normal anaerobic bacteria such as Bacteroides species, Eubacterium species, and Lactobacillus species, as revealed by direct sequencing of variable bands and confirmed by real time PCR. Bacterial diversity in the Crohn’s group showed no association with CARD15/NOD2 status.
Conclusions: Mucosal inflammation in inflammatory bowel disease is associated with loss of normal anaerobic bacteria. This effect is independent of NOD2/CARD15 status of patients.
- inflammation
- Crohn’s disease
- ulcerative colitis
- mucosa
- bacterial microflora
- inflammatory bowel disease
- CAI, clinical activity index
- CD, Crohn’s disease
- CDAI, Crohn’s disease activity index
- IBD, inflammatory bowel disease
- OTU, operational taxonomic unit
- SNP, single nucleotide polymorphism
- SSCP, single strand conformation polymorphism
- ssDNA, single stranded DNA
- UC, ulcerative colitis
- UPGMA, unweighted pair group method with arithmetic mean
Statistics from Altmetric.com
- CAI, clinical activity index
- CD, Crohn’s disease
- CDAI, Crohn’s disease activity index
- IBD, inflammatory bowel disease
- OTU, operational taxonomic unit
- SNP, single nucleotide polymorphism
- SSCP, single strand conformation polymorphism
- ssDNA, single stranded DNA
- UC, ulcerative colitis
- UPGMA, unweighted pair group method with arithmetic mean
Animal models of inflammatory bowel disease (IBD) suggest that manifestation of intestinal inflammation is critically dependent on the presence of the intestinal microflora as an important trigger. Alterations of the composition of the intestinal microflora can significantly alter host immunity and the course of mucosal inflammation.1–3 Genetic susceptibility has been clearly documented in both Crohn’s disease (CD) and ulcerative colitis (UC).4–6 Analysis of the composition of the intestinal microflora in genetically susceptible individuals appears therefore important.7–10 The exact role of the intestinal microflora in IBD has not yet been defined. Due to the similarities in the features of IBD and classic infectious enteritis and Johne’s disease, a variety of microbial agents have been proposed as aetiological factors in IBD in the past decades.11–17 However, no specific pathogen has been consistently identified and independently confirmed.
Most of the colonic bacteria, such as Escherichia coli or some Bacteroides species, are commensals and not pathogens. For example, the detrimental effects of Bacteroides vulgatus in animal models of IBD seem to be dependent on the underlying model.18–22 Experimental data and clinical observations suggest an important role of the complex intestinal microflora in the development of mucosal inflammation.23 For example, diversion of the faecal stream is associated with distal improvement in patients with CD, and relapse consistently occurs on restoration of the faecal stream.24 UC patients who undergo ileal pouch-anal anastomosis surgery may develop mucosal inflammation after recolonisation of the ileal pouch by colonic bacteria through faecal stasis.25 Certain probiotic microorganisms of the normal intestinal microflora such as Lactobacillus, Bifidobacterium, and Saccharomyces have been shown to be effective in remission maintenance of UC, thereby suggesting anti-inflammatory effects.26–31
The composition of the normal intestinal microflora was investigated using classical bacterial culture of faecal samples in a comprehensive study more than 15 years ago.32 However, culture based methods identify only 10–40% of bacteria of a complex bacterial community such as the faecal microflora,33–38 therefore new attempts using current DNA based methodologies are warranted. Analysis of variability in the 16S rDNA provides a culture independent approach to bacterial taxonomy.39–41 16S rDNA has been targeted previously to analyse bacterial communities of the intestine34,42–48 and to investigate the dominant taxa using oligonucleotide hybridisation, real time polymerase chain reaction (PCR), and fluorescent in situ hybridisation.49–51 Single strand conformation polymorphism (SSCP) analysis and other genetic fingerprint techniques using universal primers have been shown to be powerful tools in determining microbial diversity in complex samples.52–55 Because IBD is a disorder of mucosal inflammation, the mucosa associated microflora seems of peculiar relevance to the disease process.44,51 The composition of the mucosal and mid stream/faecal microflora has been shown to be significantly different.45,56 For a better understanding of IBD, characterisation of the mucosa associated bacterial microflora is therefore required.
The aim of this study was to compare the bacterial composition and to identify differences in bacteria of the mucosa associated intestinal microflora of patients with active IBD and controls using cloning experiments, SSCP fingerprinting, and real time PCR in biopsy samples. We showed that bacterial diversity in active IBD was reduced in comparison with controls. Species lacking in disease were members of the normal anaerobic microflora.
MATERIALS AND METHODS
Patients
Twenty six patients with CD, 31 patients with active ulcerative colitis UC, and 46 controls were studied. Diagnosis of IBD was made in accordance with established criteria.57,58 Disease activity was assessed by the CD activity index (CDAI) for CD and the clinical activity index (CAI) for UC. All patients with IBD were in an active phase of disease (CDAI >150 in the CD group and CAI >4 in the UC group, respectively). Ten untreated patients with active Crohn’s disease (CDAI >150) from the placebo group of a clinical IBD trial were also included. These patients were followed up after six weeks, showing no significant clinical or endoscopic improvement of disease activity. A non-inflammatory control group included healthy individuals (no suspicious macroscopic or histological findings, n = 20), patients with diverticulosis (n = 7), and patients with polyps (n = 4). To rule out the effects of diarrhoea or general inflammation on bacterial diversity, a second control group was investigated comprising patients with other forms of intestinal mucosal inflammation and diarrhoea (undetermined colitis n = 2, unclear diarrhoea n = 5, infectious colitis n = 7, and radiation colitis n = 1). In all groups, biopsies were taken from different segments of the colon. Patient characteristics are shown in table 1. The probands received no antibiotic therapy at the time of investigation and in the last six month. Biopsies from IBD patients were taken from sites of macroscopic inflammation. The study was approved by the institutional review board. All patients gave written informed consent prior to colonoscopy.
Characteristics of patients investigated in this study
Treatment of biopsies and DNA extraction
Biopsy specimens were immediately snap frozen in liquid nitrogen. Biopsies were incubated with 200 μl TL-buffer and 25 μl proteinase K at 55°C for two hours (PeqLab, Erlangen, Germany). DNA was extracted with the FastDNA SPIN Kit for Soil after mechanical homogenisation (FastPrep FP120 instrument) according to the manufacturer’s instructions (both BIO101; Carlsbad, California, USA). DNA concentrations were determined using PicoGreen (dsDNA Quantification Kit; Molecular Probes, Leiden, the Netherlands).
Clone libraries
Clone libraries from three patients, a healthy control, a patient with CD, and a patient with UC were generated. A single biopsy from the sigma of each patient was used for this experiment and DNA was extracted separately. The full length 16S rDNA was amplified with generic primers covering most intestinal bacterial species (table 2). The reaction mixture contained 10× PCR buffer, 15 mM MgCl2 (Qiagen, Hilden, Germany), a 0.2 μM concentration of each primer (Eurogentec, Seraing, Belgium), a 0.2 μM concentration of each deoxynucleoside triphosphate (Qiagen), 1 U DNA Taq polymerase (Qiagen, Hildesheim, Germany), and 100ng of sample DNA using the following PCR protocol: 95°C for five minutes, 25 cycles of 95°C for 30 seconds, 60°C for one minute, and 72°C for three minutes.
Polymerase chain reaction (PCR) and sequencing primers used in this study
DNA was cloned into competent Escherichia coli cells using the pCR 2.1 TOPO TA Cloning Kit (Invitrogen, Karlsruhe, Germany). Plasmid DNA from overnight cultures was prepared with the QIAprep 96 Turbo Miniprep Kit (Qiagen). Sequencing of the inserts was performed on an ABI PRISM 3700 DNA analyser in a final volume of 10 μl using 1 μl ABI PRISM BigDye (both Applied Biosystems, Foster City, California, USA), a 1.6 μM concentration of each primer using the following protocol: 90°C for three minutes, 25 cycles of 95°C for 40 seconds, 55°C for 40 seconds, and 60° for four minutes. Primer characteristics are indicated in table 2. Alignment and assembly of partial sequences were performed using the Phred/Phrap/Consed software package (Genome Software Development, University of Washington at Seattle, Washington, USA). Specific bacteria were identified by NCBI BLAST analysis using search results of at least 97% similarity (NCBI BLAST, http://www.ncbi.nlm.nih.gov/BLAST/).
SSCP analysis
SSCP analysis was performed for all patients included in this study. For initial PCR, the two conserved primers Com-1 and Com2-Ph were used (table 2). The reverse primer Com2-Ph contained a 5′-terminal phosphate group. The fragment size of the amplified V4 and V5 region of the 16S rDNA was 390 bp. Initial PCR, preparation of single strand DNA, and silver staining of SSCP gels were performed according to Schwieger and Tebbe.52 The amount of single stranded DNA (ssDNA) was measured with laser induced fluorescence (OliGreen Quantitation Kit; Molecular Probes) on a fluorescence microplate reader (SpectraFluorPlus, Tecan, Crailsheim, Germany) according to the manufacturer’s instructions. The amount of ssDNA was adjusted to 200 ng per lane prior to SSCP analysis. To identify the bacteria correlated to the bands, selected bands from the polyacrylamide gel after silver staining were excised with sterile scalpels and processed as described elsewhere.52,59 The sequencing reaction was performed on an ABI PRISM 3700 DNA analyser using 2 μl of digested PCR product, as described above. The sequences were analysed and aligned using the Sequencher software package (Gene Codes Corp., Ann Arbor, Michigan, USA). Fragments were identified by NCBI blast search (BLAST, http://www.ncbi.nlm.nih.gov/BLAST/).
Gel analysis
For image analysis, GelCompare II software was used (Applied Maths, Kortrijk, Belgium). Bacterial diversity was calculated as number of bands according to Seksik and colleagues46 and as weighted diversity scores according to Shannon and Weaver.60,61 Cluster analysis and calculation of similarity scores between the different banding patterns were performed using Pearson’s correlation and the unweighted pair group method with arithmetic mean (UPGMA) dendrogram type.62
Real time PCR standard curves
For standardisation of real time PCR, different bacterial strains were cultivated (including Enterobacter cloacae and Bacteroides fragilis for specific standard curves). After adjusting bacterial concentration (Neubauer chambers), bacterial cells were centrifuged (8000 g, 10 minutes at room temperature) and pellets frozen at −20°C. DNA was isolated from bacterial species as described above. Serial dilutions of bacterial DNA over several log ranks were performed to generate a standard curve for real time PCR. The total number of cells was interpolated from the averaged standard curve, as described elsewhere.63
Real time PCR
Amplification and detection were carried out on an ABI PRISM 7700 Sequence Detector with TaqMan Universal PCR 2× Master Mix (Applied Biosystems), using primer (0.4 μM), probe (0.2 μM), and 1 ng/100 ng of sample DNA (universal/specific probe) in a final volume of 20 μl per reaction using an initial hold of 50°C for two minutes to activate No Amp Erase UNG, a hold of 95°C for 10 minutes to activate AmpliTaq Gold Polymerase, followed by 50 cycles for 30 seconds, 60°C for one minute, and 72°C for three minutes. (For probe characteristics see table 3.) The conserved primers TPU1 and RTU8 used for real time PCR are indicated in table 2.
Characteristics of probes used for real time polymerase chain reaction
CARD15/NOD2 genotyping
We used 3 ng in each reaction. DNA for the genotyping experiment was extracted from mucosal biopsies, as described above, or from EDTA blood, as previously described.4 Mutations were assayed with Taqman (Applied Biosystems), as described previously.4,64 We investigated the three major functional variants of CARD15/NOD2—SNP8, SNP12, and SNP13. The primers and probes used for genotyping and the single nucleotide polymorphisms (SNPs) are described elsewhere.65,66
Data analysis
All data are expressed as means (SEM). Comparisons were made using the Student’s t test for variables with a normal distribution, and otherwise using Wilcoxon’s test. A p value of <0.05 was considered statistically significant.
RESULTS
Clone libraries of full length 16S rDNA
Three full length 16S rDNA libraries from mucosal biopsies from CD, UC, and a normal control were established. A total of 1019 clones were fully sequenced to investigate the overall diversity of the intestinal microflora (controls 324 clones; CD 344 clones; UC 351 clones). The identified operational taxonomic units (OTUs) from all three samples are listed in table 4. Among the 83 non-redundant clones, 49 sequences could be assigned to known bacterial species. Approximately 30% of all OTUs were bacteria that are not further characterised in nucleotide databases or represent potentially new species. Most of the other OTUs were of a previously described intestinal origin but a relevant part derives from the oral mucosa, such as some Streptococcus species, Dialister species, and Actinomyces species. The main bacterial groups were Streptococcus species (34%), Ruminococcus species (22%), Escherichia (12.8%), and Clostridium species (6.5%). Only small proportions of Eubacterium species (0.1%), Fusobacterium species (1.1%), Peptostreptococcus species (0.2%), and Enterobacter species (1.1%) were detected.
Bacterial operational taxonomic units (OTUs) derived from clone libraries
Bacterial profiles as assessed by SSCP analysis
A dendrogram of a randomly assigned subset of controls (n = 10), CD patients (n = 10), and UC patients (n = 10) is shown in fig 1. Patients with IBD clustered separately from normal controls using Pearson’s correlation and the UPGMA algorithm. Interestingly, 16S rDNA based bacterial profiles of CD and UC patients did not differ significantly as both groups of samples showed mixed clusters (fig 1). To assess the effect of disease independent variables on clustering, separate analysis for localisation (for example, the anatomical site of sampling), age, and medication were performed. No significant association of these factors with the composition of the intestinal microflora was observed (data not shown).

Dendrogram and normalised single strand conformation polymorphism profiles obtained from a cluster analysis of 10 randomly assigned profiles from controls, Crohn’s disease (CD), and ulcerative colitis (UC) patients. Patients are marked with bars in different grey scales, as indicated in the legend. Separation of controls and disease groups is clearly visible, while CD and UC patients show mixed clusters. For cluster analysis, Pearson’s correlation and the unweighted pair group method with arithmetic mean algorithm were applied.
Bacterial diversity and composition of bacterial microflora
Formal analysis of biodiversity in the three patient cohorts was conducted (fig 2). The mean diversity of the non-inflammatory control group, indicated as number of bands (according to Seksik and colleagues46) of the SSCP profiles, was 50.4 (SD 14.7) compared with 21.7 (10.4) in the CD group (p<0.0001) and 17.2 (4.4) in the UC group (p<0.0001) (fig 2). Thus the mean biodiversity of healthy controls is twofold that of CD patients and threefold that of UC patients. The cohort with inflammatory controls was analysed separately and showed a complex microflora with a total number of bands of 45.4 (SD 7.73), similar to that of non-inflammatory controls (p<0.001 compared with CD and UC). Furthermore, weighted diversity indices were calculated according to Shannon and Weaver, considering not only number of bands but also their intensity.60,61 The corresponding weighted diversity values showed the same tendency. For the non-inflammatory control group, a mean diversity score of 1.44 (SD 0.16) compared with 1.2 (SD 0.23) in the CD and 1.16 (SD 0.14) in the UC group was calculated. The differences were also statistically significant (p<0.0001). The diversity index for the inflammatory control group (1.51, SD 0.075) was higher compared with non-inflammatory controls but was not significant (p<0.001 compared with CD and UC). No association of biopsy localisation and age with bacterial diversity was observed (data not shown). A comparison of bacterial diversity with medication in the IBD group showed no significant differences (fig 3).

Band numbers and bacterial diversity obtained from single strand conformation polymorphism profiles of inflammatory bowel disease patients (Crohn’s disease (CD) and ulcerative colitis (UC)), non-inflammatory controls (controls−), and inflammatory controls (controls+). For each group, the mean numbers of bands (SD) are shown. Diversity of the controls was significantly higher compared with the disease groups. The weighted diversity scores (SD) according to Shannon and Weaver60 showed the same pattern. Results for comparison of both non-inflammatory and inflammatory controls and CD/UC were statistically significant: ****p<0.0001.

Bacterial diversity, indicated as number of bands versus medication. Four groups were compared: no medication, medication all (including single patients with combined medication), 5-aminosalicyclic acid (5-ASA), and corticosteroids. For each group, the mean (SD) numbers of bands are shown. Differences were not statistically significant.
Comparison between CD and UC patients showed no significant differences but 20 bands were found to be significantly more frequent in the control group compared with IBD patients. Thirteen of 20 bands gave a reproducible signal in the sequencing analysis. Representatives of the mucosa associated microflora, as obtained from the full length (1.6 kb) library sequencing (table 4), were compared with SSCP sequences (390 bp). Bacteria characteristics for normal controls were put into the context of selected members of the total intestinal microflora, as obtained from the library sequencing through phylogenetic tree analysis (fig 4). Three distinct clusters are evident: the first cluster includes OTUs of the Bacteroidales/Prevotella group that belong to the abundant anaerobic intestinal microflora. The second cluster shows OTUs that belong to the Firmicutes phylum found to be frequent members of the normal enteric microflora. One of the OTUs was assigned to the Enterobacteriaceae cluster which contains different gut related genera such as Escherichia, Enterobacter, and Serratia. Sequences of the uncultured or unidentified bacteria showed phylogenetic relationships to one of the clusters.

Phylogenetic tree of the operational taxonomic units (OTUs) identified in the single strand conformation polymorphism (SSCP) profiles by the Band Matching algorithm. Fragments were identified by NCBI blast search (BLAST, http://www.ncbi.nlm.nih.gov/). The corresponding representative OTUs from the clone libraries (highlighted in grey) were inserted as benchmarks for phylogenetic orientation. The phylogenetic tree was built from sequence data of the SSCP profiles and the corresponding region (V4 and V5) of the sequences of the clone libraries with the ARB software package (http://www.arb-home.de/), using the parsimony algorithm and the Jukes-Cantor correction.37,77 Three clusters are defined by phylogenetic relationships: Bacteroides/Prevotella group (cluster 1), Firmicutes phylum (cluster 2), and Enterobacteriaceae family (cluster 3).
Quantification of total bacteria and of two major groups of anaerobic bacteria
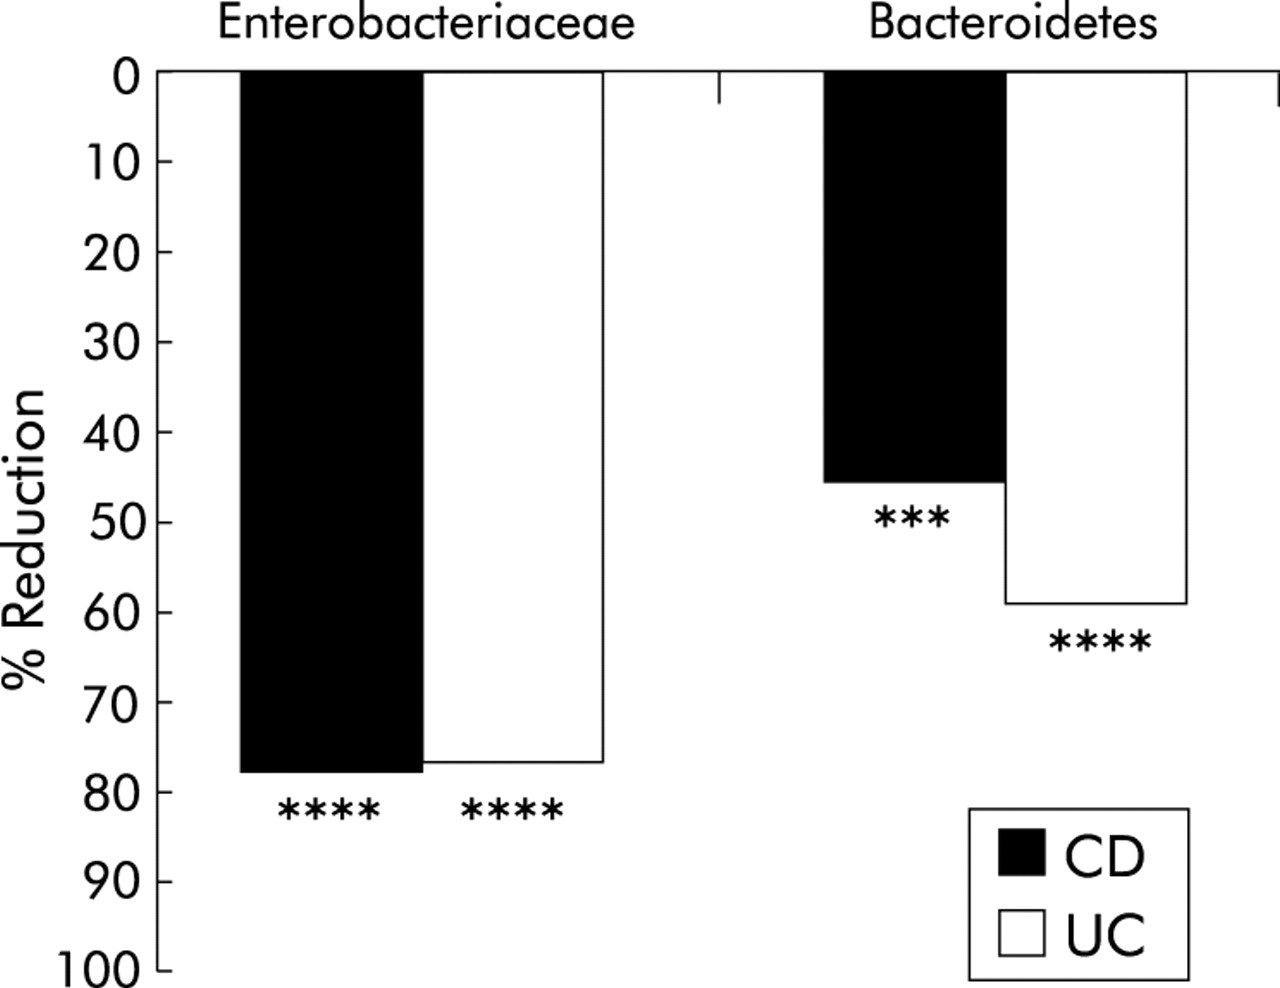
To verify the results of the SSCP approach, a 16S based quantitative real time PCR was performed quantifying total bacteria and two major groups of anaerobic bacteria. For the total number of bacterial cells, as detected with the universal probe, no significant differences between controls and CD/UC patients were determined (data not shown). Quantification of Enterobacteriaceae and Bacteroidetes (including Bacteroides sp, Prevotella sp, and Porphyromonas sp) showed a significant reduction in cell numbers in CD/UC patients compared with controls (fig 5). For Bacteroidetes, reductions of 78.12% (p<0.0001) in the CD and 76.99% (p<0.0001) in the UC group were detected. Enterobacteriaceae sp were decreased by 45.88% in CD (p<0.003) and by 59.31% (p<0.0001) in UC patients. Cell numbers were normalised to the total amount of extracted DNA.

Reduction of Bacteroidetes and Enterobacteriaceae, as determined by real time polymerase chain reaction in patients with Crohn’s disease (CD) and ulcerative colitis (UC). All results were statistically significant (***p = 0.003, ****<p<0.0001).
Intraindividual variability of intestinal microflora in active CD
Ten patients in the CD group were re-examined at six weeks after the first examination. Disease was still active in all of them, and biopsies were taken from the same location. Medication had not been changed during the six week period. Diversity after six weeks was lower compared with basal values (21.5 v 15.7) but not statistically significant (p = 0.1255). Weighted diversity scores showed a similar pattern (fig 6).
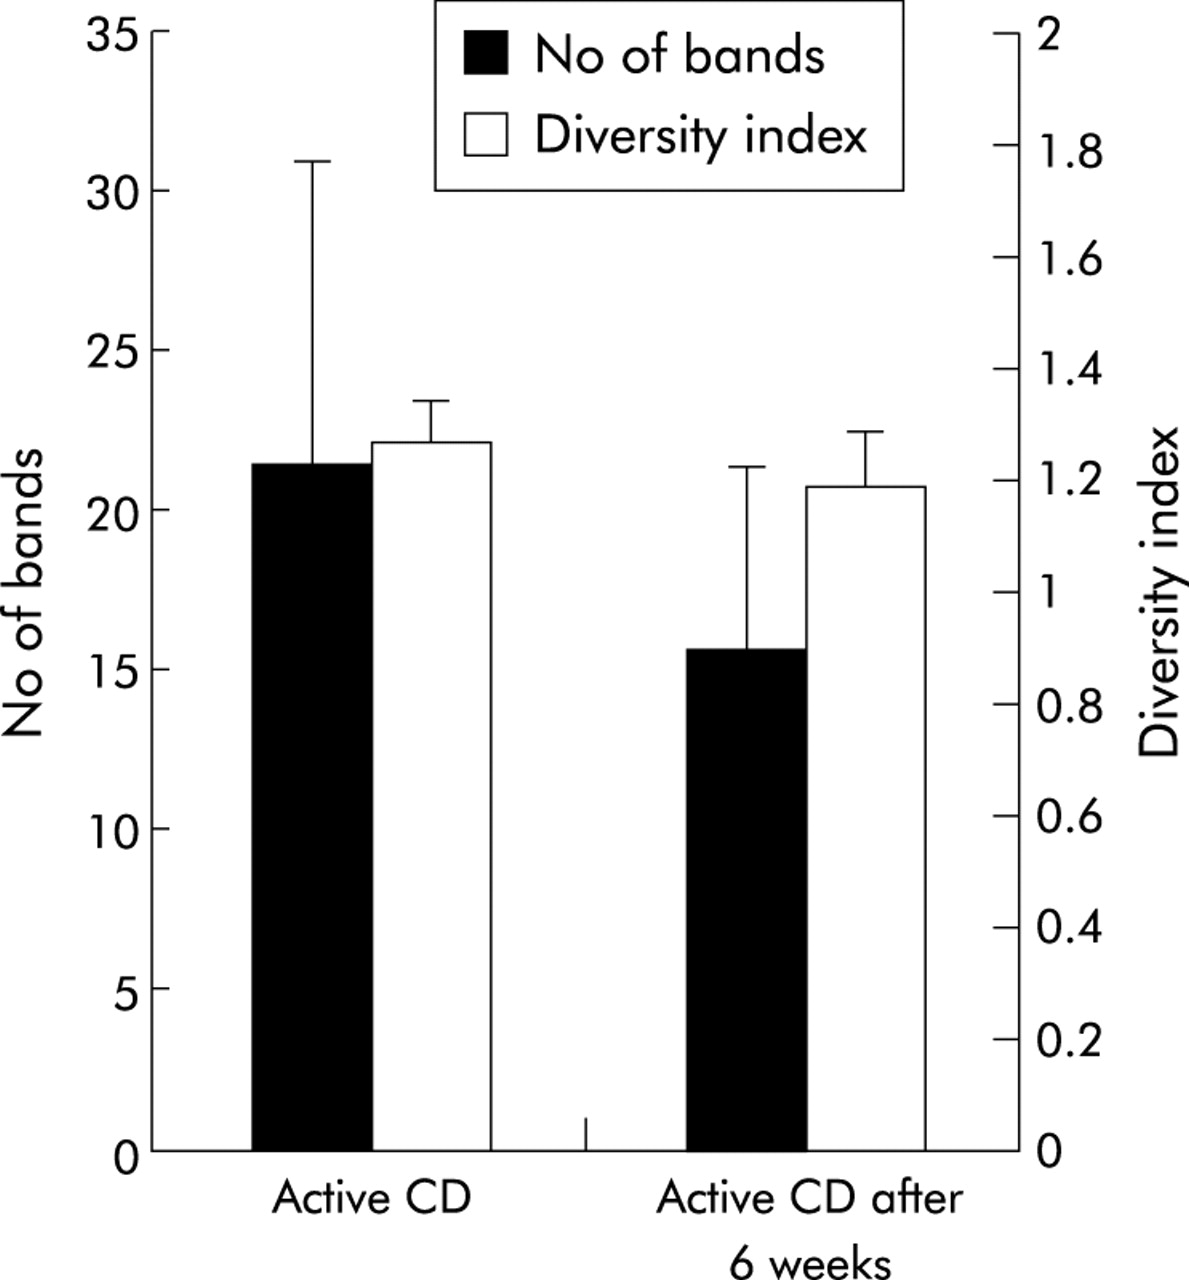
Comparison of the bacterial profiles of 10 patients with active Crohn’s disease (CD) before and after a six week follow up. Bacterial diversity is indicated as number of bands (SD) and as diversity score (SD). Biodiversity was lower after six weeks but the results were not significant (p = 0.054).
Bacterial diversity and CARD15/NOD2 status of patients with Crohn’s disease
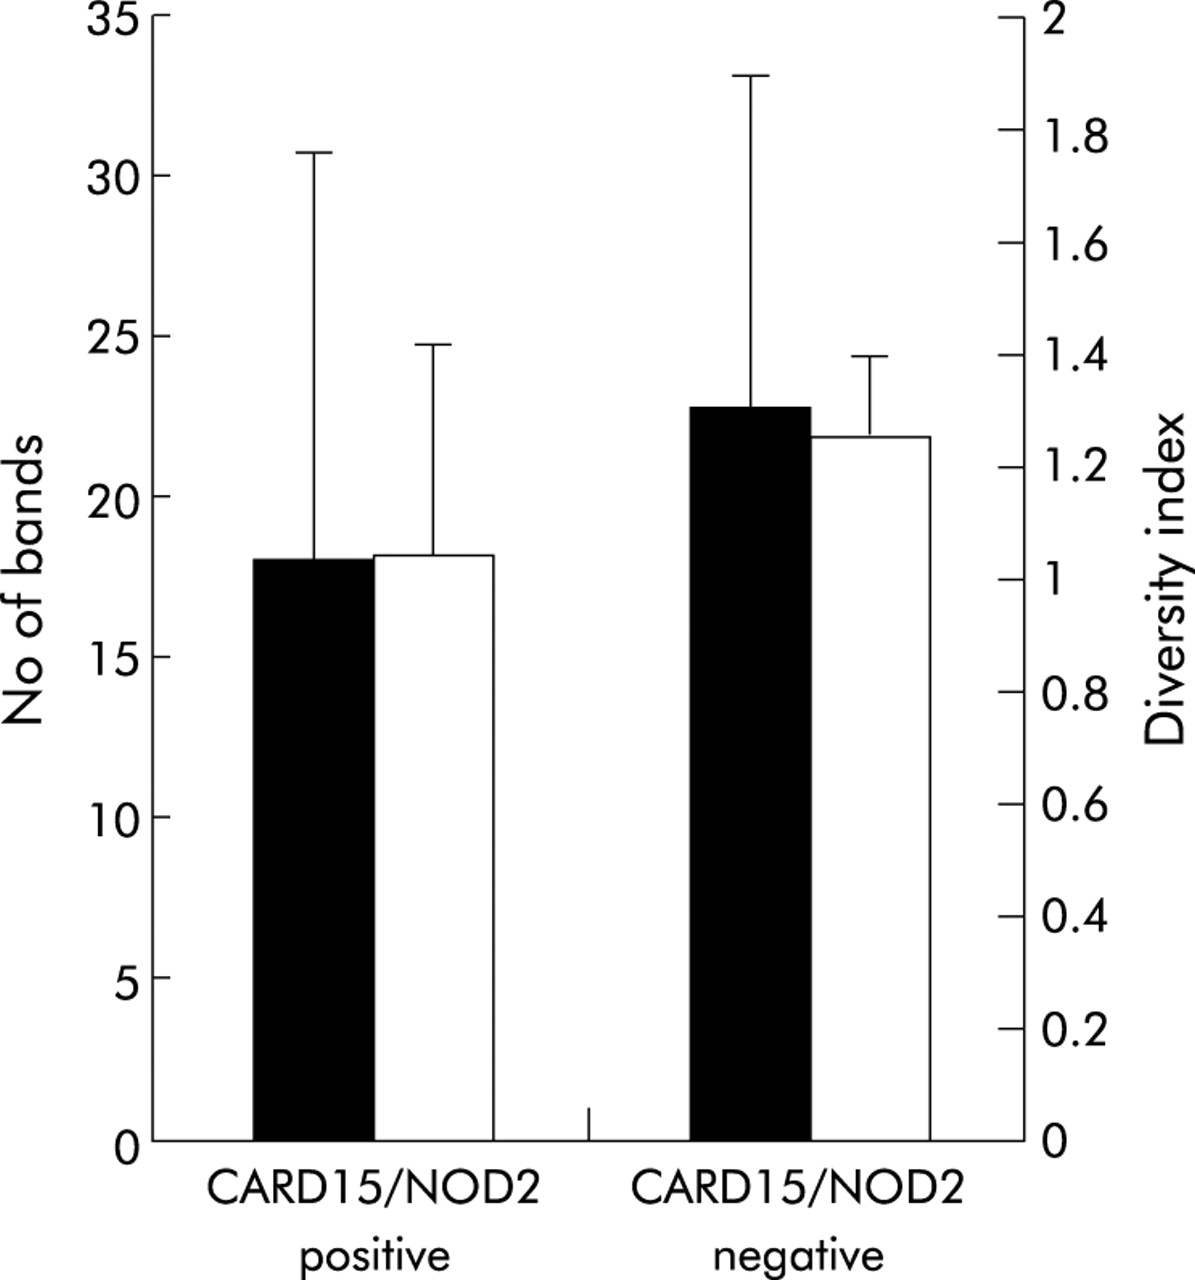
Six of the 26 patients with CD (30%) carried at least one of the three major SNPs. Bacterial diversity in CARD15/NOD2 positive patients (n = 6) was lower compared with non-affected patients (n = 20) but the results were not statistically significant (fig 7). Both indicators of bacterial diversity, number of bands (18 v 22.85; p = 0.06) and diversity index (1.036 v 1.25; p = 0.11), showed the same tendency.
Correlation of bacterial diversity and CARD15/NOD2 status of patients with Crohn’s disease (CD). Six of the 26 patients (30%) tested CARD15/NOD2 positive (detection of at least one of the three major single nucleotide polymorphisms—SNP8, SNP12, and SNP13). Diversity, indicated as number of bands and as weighted diversity score, was not significantly different in the CARD15/NOD2 positive group compared with wild-type patients (p = 0.063 and p = 0.11, respectively).
DISCUSSION
The global composition of the intestinal bacterial microflora rather than the presence of single pathogens appears to be relevant for IBD pathogenesis and aetiology. Analysis of bacterial 16S rRNA genes, amplified directly from complex communities, provides an efficient strategy to explore the bacterial diversity of complex microflora.39–41 In contrast with previous studies, we examined biopsy samples to determine the mucosa associated bacteria directly interacting with the host.
To obtain an overall assessment of bacterial diversity, we generated full length 16S rDNA libraries of three sigma biopsies. Analysis of clone libraries (table 4) highlights the enormous diversity of bacterial species in the mucosal flora. It should be noted however that the number of patients used for construction of the clone libraries and the technique itself are not appropriate for a comparison between groups and should serve only as a qualitative guide for the genetic fingerprinting experiments. In contrast with previous studies, bacterial diversity of the mucosa associated intestinal microflora was based on full length 16S rDNA sequences. The majority of the 83 clones belonged to the normal anaerobic microflora of the human gut. Interestingly, more than 30% of the signals represented novel or incompletely annotated species. Approximately 95% of the OTUs found in stool samples could be assigned to three phylogenetic groups:67 the Bacteroides group, the Clostridium coccoides group, and the Clostridium leptum group. Interestingly, we detected no members of the Bacteroides group which usually account for 50–90% of the anaerobic faecal microflora. This is in line with findings of other studies suggesting that the mucosa associated microflora contains only small numbers of bacteria of the Bacteroides/Prevotella group.44,51 Detection of these species in the larger SSCP experiment microflora represents the interindividual variability of the bacterial microflora of a high number of patients compared with the cloning experiment.
Generation of clone libraries is very laborious and expensive, and thus SSCP analysis was performed as a simple and reliable molecular technique to examine the molecular epidemiology of the microbial composition in a larger number of patients.52,53 Cluster analysis of the bacterial profiles revealed distinct clustering of non-inflammatory controls that separated from a mixed cluster of patients with CD and UC (fig 1). Diversity in IBD was reduced in comparison with controls, with a trend towards greater reduction of diversity in UC (not statistically significant in comparison with CD). Patients with inflammatory diseases and diarrhoea showed a complex pattern with high interindividual variability. Bacterial diversity was comparable with that of non-inflammatory controls and significantly higher than that of CD and UC patients, suggesting that reduced bacterial diversity in IBD is a disease specific feature. The phenomenon of decreased bacterial diversity of the intestinal microflora obtained from stool samples in IBD patients has been discussed previously, based on culture dependent microbiological techniques.9 A recent study compared the faecal microflora of healthy controls and CD patients using a similar approach.46 The authors found no differences in bacterial diversity between controls and CD patients. This lack of significance may be due to differences in the mucosal and faecal microflora.45,56 The faecal microflora is reported to be host specific and stable over time.43 To rule out the fact that alterations of the mucosa associated microflora demonstrated in this study are attributed to transient factors, the bacterial profiles of 10 patients with active CD were investigated after a period of six weeks. Biopsies were taken from the same location, and treatment had not been changed during that period. Comparison of the bacterial profiles revealed a low diversity of the mucosa associated microflora; thus the observed effects seem to be stable over time.
Most of the bacterial species found to be different between non-inflammatory controls and IBD patients belonged to the normal anaerobic intestinal microflora. Quantitative real time analysis confirmed a significant reduction of two major groups of anaerobic bacteria. Bacteroides species are part of the indigenous intestinal microflora. In faecal samples, up to 1010 cells/g stool relate to different Bacteroides bacteria, thus accounting for approximately 30% of the total number of cells. In contrast, Bacteroides were found only sporadically in mucosal biopsies.44,51 Some members of the Bacteroides/Prevotella group, in particular Bacteroides vulgatus, were previously reported to have proinflammatory effects in several animal models of IBD.18–20,68 However, in a model of IL-10 deficient mice, Bacteroides vulgatus could not induce colitis.21,22 Some culture studies have shown a possible increase in faecal Bacteroides, especially Bacteroides fragilis, in CD,69,70 while a recent study observed a decrease in the relative proportions of the Bacteroides group.46Lactobacillus and Eubacterium species belong to the Firmicutes bacteria and have been shown to be frequent and stable members of both the normal faecal and mucosa associated bacterial community.45,47,71,72 Furthermore, animal models and clinical studies attribute beneficial effects to orally administered Lactobacillus bacteria in maintenance of remission in UC and CD.26–31 One of the species excised from the SSCP gel showed a close phylogenetic relationship to the Enterobacteriaceae group. Enterobacteriaceae compose a homogenous group of closely related intestinal bacteria. Most of the species in this group are representatives of the normal intestinal microflora, such as Escherichia coli and Enterobacter. Other members of this group are pathogens inducing severe infectious diarrhoea, such as Shigella, Salmonella, and Yersinia species. Some strains of Escherichia coli have been suspected to play a role in the aetiology of IBD.73
CARD15/NOD2 is a member of the NOD gene family, and has a role in mediation of inflammatory responses to bacterial antigens. CARD15/NOD2 expression is upregulated by proinflammatory cytokines such as tumour necrosis factor α, as demonstrated for inflammatory bowel disease.74,75 A recent study showed that CARD15/NOD2 functions as a defensive factor against intracellular bacteria in intraepithelial cells.76 To compare the bacterial microflora between CARD15/NOD2 positive and non-affected patients, all CD patients were checked for CARD15/NOD2 mutations by SNP genotyping. We found no significant differences in bacterial diversity or bands between the two groups. CARD15/NOD2 expression is assumed to have a key function in the recognition of bacterial antigens but this effect appears to play a role in the early phase of the innate immune response to single intraepithelial pathogens. We hypothesise that alteration of the bacterial microflora in mucosal inflammation reflects a metabolic imbalance of the complex microbial ecosystem with severe consequences for the mucosal barrier rather than disrupted defence to single microorganisms.
In this study, we demonstrated that mucosal inflammation in IBD was associated with loss of normal anaerobic bacteria and identified a number of specific taxa. These findings provide additional evidence for a role of luminal bacteria in the pathogenesis of IBD. Further studies are needed to determine to what extent these changes are primary or secondary to an altered mucosal microenvironment. Longitudinal studies may help to explain the aetiological mechanisms of alterations of the bacterial microflora and to assess the impact of external factors.
Acknowledgments
This work was supported by grants from the German National Genome Research Network (NGFN), the German Human Genome Project (DHGP), the Competence Network Inflammatory Bowel Disease (all funded by the BMBF), the DFG (SFB415), the Crohn’s and Colitis Foundation of America (CCFA), and the EU (EU QLG2-CT-2001-02161). We thank Friedrich von Wintzingerode for his contributions to the cloning experiments. We gratefully acknowledge Meike Barche, Nadine Teepe, Theresa Nahmuth, Annette Krüger, and Agnes Waliczek for their technical assistance.
REFERENCES
Footnotes
-
↵* S J Ott and M Musfeldt contributed equally to this study