Article Text

Abstract
Objective Gut microbiota could influence gut, as well as hepatic and biliary immune responses. We therefore thoroughly characterised the gut microbiota in primary sclerosing cholangitis (PSC) compared with healthy controls (HC) and patients with ulcerative colitis without liver disease.
Design We prospectively collected 543 stool samples. After a stringent exclusion process, bacterial DNA was submitted for 16S rRNA gene sequencing. PSC and HC were randomised to an exploration panel or a validation panel, and only significant results (p<0.05, QFDR<0.20) in both panels were reported, followed by a combined comparison of all samples against UC.
Results Patients with PSC (N=85) had markedly reduced bacterial diversity compared with HC (N=263, p<0.0001), and a different global microbial composition compared with both HC (p<0.001) and UC (N=36, p<0.01). The microbiota of patients with PSC with and without IBD was similar. Twelve genera separated PSC and HC, out of which 11 were reduced in PSC. However, the Veillonella genus showed a marked increase in PSC compared with both HC (p<0.0001) and UC (p<0.02). Using receiver operating characteristic analysis, Veillonella abundance yielded an area under the curve (AUC) of 0.64 to discriminate PSC from HC, while a combination of PSC-associated genera yielded an AUC of 0.78.
Conclusions Patients with PSC exhibited a gut microbial signature distinct from both HC and UC without liver disease, but similar in PSC with and without IBD. The Veillonella genus, which is also associated with other chronic inflammatory and fibrotic conditions, was enriched in PSC.
- PRIMARY SCLEROSING CHOLANGITIS
- HEPATOBILIARY DISEASE
Statistics from Altmetric.com
Significance of this study
What is already known on this subject?
The environmental factors influencing the risk of primary sclerosing cholangitis (PSC) are mostly unknown.
PSC has a striking association with IBD, with up to 80% of patients being affected.
Several studies have found a distinct gut microbiota in inflammatory and immune-mediated diseases.
One small study of the ileocaecal mucosal microbiota exists in PSC, showing a slightly altered gut microbiota.
What are the new findings?
Patients with PSC showed a distinct gut microbial profile, separate from healthy controls (HC) and patients with UC without liver disease, with marked enrichment of the Veillonella genus.
The intraindividual bacterial diversity of patients with PSC was markedly reduced compared with HC.
The gut microbiota was similar in PSC with and without IBD.
Ursodeoxycholic acid treatment was not associated with an altered gut microbiota in PSC.
How might it impact on clinical practice in the foreseeable future?
Our findings provide a rationale for studies of the gut microbiota as a biomarker of disease and as a new treatment target in PSC, which could have clinical relevance.
Introduction
Primary sclerosing cholangitis (PSC) is a chronic, cholestatic liver disease of unknown aetiology, characterised by inflammation and fibrosis of the biliary tree.1 Up to 80% of patients with PSC have concomitant IBD, most often categorised as UC.1 Multiple genetic risk factors have been identified in PSC2; however, established risk genes in PSC collectively explain only a small fraction of the disease liability,2 suggesting that environmental factors are important in PSC development. The known environmental risk factors are limited to smoking and coffee, both protective against PSC,3 ,4 highlighting the need for further research.
Early treatment trials in PSC engaged antibiotics,5 and more recently both metronidazole (in combination with ursodeoxycholic acid) and vancomycin have been shown to reduce alkaline phosphatase in patients with PSC.6 ,7 So far no studies have shown a long-term benefit of antibiotics on hard endpoints like liver transplantation or death,8 but collectively, the data suggest that manipulation of the gut microbes could potentially influence the disease process. In addition, several observations suggest that the microbial contents of the gut, that is, the gut microbiota, could be directly involved in the pathogenesis of PSC. Evidence for this includes animal models of small bowel bacterial overgrowth that show PSC-like changes in the liver, which can be counteracted by antibiotics,9 and cultured cholangiocytes from patients with PSC that seem hypersensitive to pathogen-associated molecular patterns such as lipopolysaccharide (LPS).10 LPS also seems to accumulate in cholangiocytes from patients with PSC11 and cross-reactivity between the most common autoantibodies in PSC (anti-neutrophil antibodies) and bacterial proteins has previously been reported.12
The gut microbiota represents a metabolically highly active human ‘organ’.13 Changes in the diversity and structure of the gut microbiota have lately been implicated in the pathogenesis of several metabolic and inflammatory conditions, including gastrointestinal disorders like IBD, but also systemic disorders like diabetes, obesity and atherosclerosis.13–18 In IBD, gut microbial profiles have been reported in both UC and Crohn’s disease (CD) as being distinctly different from healthy controls (HC).17 ,19 However, although PSC is strongly associated with IBD, our knowledge of the gut microbiota in PSC is limited.20
We therefore hypothesised that the faecal gut microbiota of PSC differs from that of HC and patients with UC without liver disease, and sought to investigate this by conducting a cross-sectional cohort study, surveying the gut microbiota using high-throughput sequencing in a robust two-stage design.
Materials and methods
Participants
We performed a cross-sectional collection of stool samples from non-transplanted patients with PSC at the Norwegian PSC Research Center (NoPSC) Biobank at Oslo University Hospital Rikshospitalet, a tertiary care centre. The diagnosis of PSC was made according to clinical guidelines and typical findings on cholangiography or liver biopsy, and all patients with PSC had undergone screening for IBD.21 IBD diagnosis was based on findings at colonoscopy and histology and accepted criteria.22 Routine biochemical parameters were retrieved from hospital databases, including platelets, creatinine, total bilirubin, albumin, international normalised ratio, aspartate aminotransferase, alanine aminotransferase, alkaline phosphatase, gamma-glutaryltransferase, together with perinuclear anti-neutrophil cytoplasmic antibody (P-ANCA) status. Mayo risk scores were calculated using the algorithm for the revised Mayo risk score.23 Patients with UC without a medical history of liver disease, and in clinical remission, were recruited in an outpatient setting from Oslo University Hospital Ullevål (Oslo, Norway), a secondary care centre. HC were randomly selected from donors registered in the national Norwegian Bone Marrow Donor Registry (Oslo, Norway).
Ethics
The study was performed in accordance with the Declaration of Helsinki. Written informed consent was obtained from all study participants.
Sample collection, exclusion criteria and DNA extraction
Demographic data, medical history, diet and medication were assessed from a questionnaire (see online supplementary information). For PSC and UC, this was supplemented with and controlled against patient records.
Stool samples were collected using Stool Collection Tubes with Stool DNA Stabilizer (Stratec Molecular GmbH, Berlin, Germany), and a standardised collection device was used by all participants after voiding.24 Samples were then sent by mail to the study centre and frozen at minimum −20°C on arrival according to the recommendation of the manufacturer.
Samples with >72 h from collection to freezer were excluded (time limit according to the manufacturer). All participants exposed to antibiotics the preceding 4 weeks and participants with previous bowel resection, gastrointestinal stoma or on specific diets (eg, vegan, vegetarian, gluten-free and milk-free diets) were also excluded (see online supplementary table S1).
DNA was extracted using the PSP Spin Stool DNA Kit (Stratec Molecular GmbH), according to the manufacturer's instructions.
Library preparation and sequencing
Library preparations were performed in accordance with a well-established protocol.25 In short, libraries were constructed from PCR amplicons of the V3–V4 region of the 16S rRNA gene generated using unique dual-index primers for each sample and Accuprime Pfx SuperMix (Thermo Fisher Scientific, Waltham, Massachusetts, USA). Amplicons were then cleaned and normalised using the SequalPrep Normalization Plate Kit (Life Technologies, Carlsbad, California, USA). Subsequent quality control was performed on a Bioanalyzer (Agilent Technologies, Santa Clara, California, USA) using the Agilent High Sensitive DNA Kit (Agilent Technologies). In addition, the libraries were quantified using the KAPA Library Quantification Kit (Kapa Biosystems, London, UK). Libraries were submitted to the Norwegian Sequencing Centre (Oslo, Norway) for Illumina MiSeq sequencing using the v3 Kit (San Diego, California, USA).
Sequence processing and data quality control
Paired-end reads were overlapped and merged using FLASH (V.1.2.10).26 Quality control, trimming and closed reference operational taxonomic unit (OTU) mapping to the Greengenes database (V.13.8, OTUs with 97% sequence similarity) were performed using the Quantitative Insights Into Microbial Ecology (QIIME) platform (V.1.8.0).27 ,28 OTUs with a number of sequences <0.005% of the total number of sequences were discarded as recommended.29 Samples with <8000 reads were also discarded.
Statistical analysis
Comparison of categorical variables was performed using the χ2 test or Fisher's exact test where appropriate. Mann–Whitney U test was applied for continuous variables. For correlation analyses, Spearman's rank correlation test was used. False-discovery rate (FDR) was calculated according to Benjamini–Hochberg, FDR-corrected p values were denoted as QFDR and was used when performing all untargeted screening analyses of different taxa. Calculations of rarefied alpha diversity (Chao1 bacterial richness estimate (Chao1), Shannon diversity index and phylogenetic diversity) and beta diversity (unweighted UniFrac) were performed in QIIME. Fold change in relative abundance was calculated by dividing the mean relative abundance in each category.
All regression analyses of relative taxa abundances and area under the receiver operating characteristics curve (AUROC) analyses were performed in the statistical programming language R (V.3.1.2). Analogous to previous studies,30 the relative abundances were arcsine square root transformed before regression analyses. Area under the curves (AUCs) were calculated to evaluate the performance of the fitted logistic regression models. The AUCs were based on the predicted probability of PSC for each individual, using the multivariate logistic regression coefficient estimates together with the individual’s transformed relative abundances for each bacterial taxa included in the analysis. Differences between AUCs were compared according to the method of DeLong. Linear regression analyses of alpha diversity were performed in SPSS (V.22; IBM, New York, USA). The linear discriminant analysis effect size tool (LEfSe, V.1.0) and Multivariate Association with Linear Models framework (MaAsLin, V.1.0.1, revision 13:4033a2ee4558) were accessed online from http://huttenhower.sph.harvard.edu/galaxy/ (The Huttenhower Lab, Department of Biostatistics, Harvard School of Public Health, Massachusetts, USA) using standard parameters.31 ,32 For MaAsLin, age, sex, smoking status, body mass index (BMI) and the number of prescriptions for antibiotics in the last 12 months before inclusion were used as covariates. Unless otherwise specified, all other calculations were performed in SPSS.
Before post-sequencing data quality control, PSC and HC were randomly assigned to either an exploration panel or a validation panel. During the statistical analyses, only significant findings in the exploration panel (p<0.05, QFDR<0.20) were repeated in the validation panel. Finally, all samples were joined in a combined panel for comparison against UC (figure 1). When doing AUROC analyses in the two-stage design, we used coefficients based on the exploration panel when calculating AUC for the validation panel, thus avoiding overoptimistic AUCs due to overfitting.

Study design. After a rigorous exclusion process, samples were submitted to sequencing. Before post-sequencing quality control, PSC and healthy controls were randomly assigned to either an exploration panel or a validation panel. Samples that failed sequencing or producing <8000 reads were discarded. During the statistical analyses, only significant findings in the exploration panel (p<0.05 and QFDR<0.20) were repeated in the verification panel. Lastly, all samples were joined in a combined panel for comparison with UC. PSC, primary sclerosing cholangitis; QC, quality control.
Results
In total, we collected samples from 144 patients with PSC, 51 patients with UC and 348 HC, of which 85 PSC, 36 UC and 263 HC samples were included in the final analyses after exclusions and data quality control (figure 1 and see online supplementary table S1). Fifty-five of the patients with PSC (64.7%) had concomitant IBD (44 (51.8%) with UC and 11 (12.9%) with CD, see online supplementary table S2) and 23 (27.1%) had concomitant autoimmune disease. As shown in table 1, PSC and HC were comparable in both the exploration panel and the validation panel, except a higher proportion of men in PSC in the validation panel and lower frequency of smokers in PSC in the exploration panel. PSC in the validation panel also had a slight increase in platelet count, compared with PSC in the exploration panel.
Demographics for the exploration panel and the validation panel
Reduced intraindividual bacterial diversity in PSC
The gut microbiota in PSC was significantly less diverse compared with HC in the exploration panel, as measured by Shannon diversity index (figure 2A). This was also the case for the other diversity measurements (Chao1: 385 vs 472, p<0.0001 and phylogenetic diversity: 21.6 vs 25.5, p<0.0001, see online supplementary figure S1). These findings were all confirmed in the validation panel (p<0.0001, figure 2B and see online supplementary figure S1). In the combined panel, PSC and UC showed similar reduced diversity compared with HC (figure 2C and see online supplementary figure S1).

(A and B) Alpha diversity, here illustrated by the Shannon diversity index, was consistently reduced in patients with PSC compared with HC across all panels, (C) and were similar in patients with PSC and patients with UC in the combined panel. (D) Patients with PSC without IBD showed similar bacterial diversity as PSC with IBD (PSC+IBD), (E) and all IBD subgroups in PSC had reduced diversity compared with HC. CD, Crohn’s disease; HC, healthy controls; PSC, primary sclerosing cholangitis. Data are shown as IQR+min, max. *p<0.05, ****p<0.0001.
All findings were still significant after adjusting for age, sex, smoking status, BMI and the number of prescriptions for antibiotics in the last 12 months before inclusion (combined panel, see online supplementary table S3). In HC, the use of antibiotics in the last 12 months (N=44, 16.7%) was associated with reduced alpha diversity; Shannon diversity index: 6.0 versus 6.2; Chao1: 418 versus 472 and phylogenetic diversity: 23.5 versus 25.6, all p<0.02, while there was no effect on diversity by antibiotic use in PSC (see online supplementary figure S2A) or UC. The 74 patients with PSC (87.1%) without antibiotics use in the last 12 months showed a reduction in diversity also when compared only with the subgroup of HC who had used antibiotics in the last year, and similar diversity compared with other patients with PSC (see online supplementary figure S2A).
The Veillonella genus is increased in PSC
In total, we identified 160 different taxa in the included samples. At the genus level, 18 taxa were different when comparing PSC and HC in the exploration panel (p<0.05 and QFDR<0.20), and we were able to replicate 12 of these in the validation panel (figure 3). Eleven of these genera were reduced in PSC compared with HC. However, the last genus, Veillonella showed a 4.8-fold increase in PSC compared with HC (p<0.0001) and a 7.8-fold increase compared with UC (p<0.01) in the combined panel. Eleven of the 12 genera separating PSC and HC (including Veillonella) were still significantly different after adjusting for age, sex, smoking status, BMI and the number of prescriptions for antibiotics in the last 12 months before inclusion (see online supplementary table S4). We were further able to trace 93% of the sequences in the Veillonella genus to two distinct species, Veillonella dispar (82%) and Veillonella parvula (11%), both increased in PSC compared with HC and UC (p<0.0001 and p<0.01, respectively, in the combined panel).
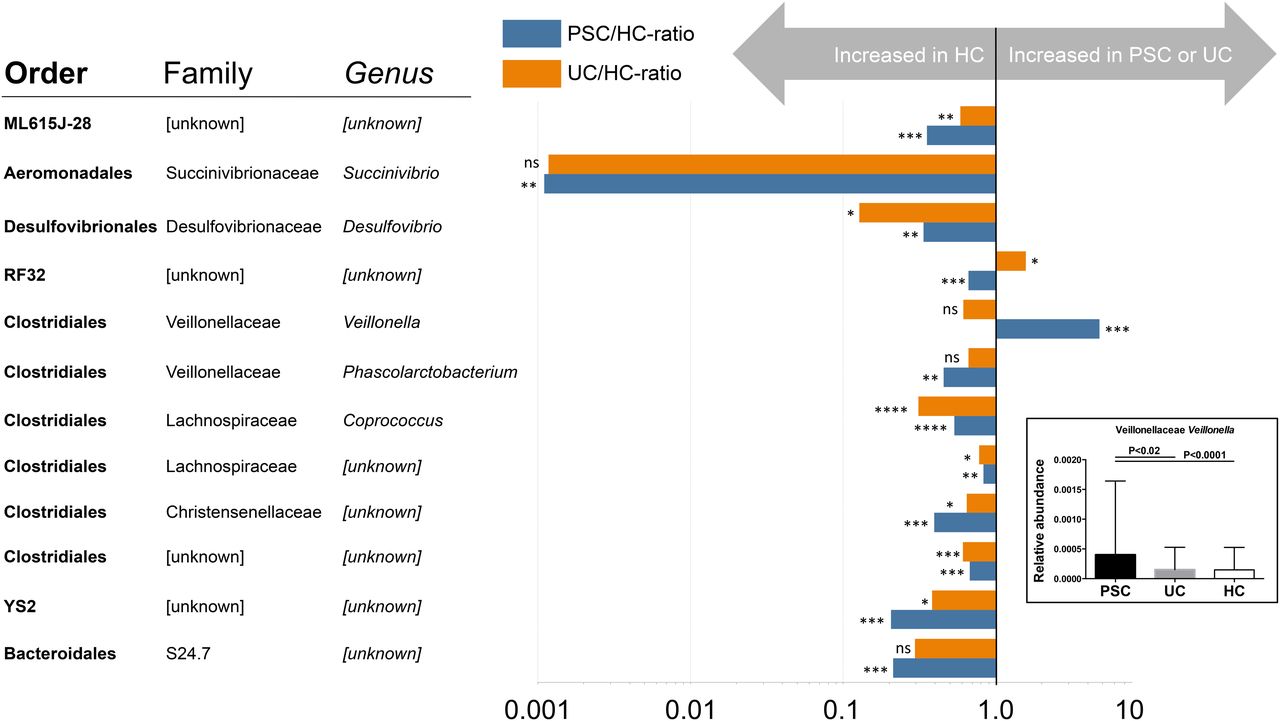
The 12 genera confirmed in the validation panel, differing between PSC and HC, illustrated by the ratio between PSC and HC on a logarithmic scale. The ratio between UC and HC is included for comparison. One genus, Veillonella, showed a significant increase in PSC compared with both HC and UC (framed box). The ML615J-28, RF32 and YS2 orders are part of the Tenericutes, Proteobacteria and Cyanobacteria phyla, respectively. All data in the chart are based on the combined panel. The ratios were calculated by dividing the mean relative abundance in the patients with PSC/patients with UC by the mean relative abundance in HC. Data in the framed box are shown as median and IQR. HC, healthy controls; PSC, primary sclerosing cholangitis. *QFDR<0.05, **QFDR<0.01, ***QFDR<0.001, ****QFDR<0.0001.
In addition to the Veillonella, when performing an exploratory comparison of all taxa between PSC and UC, six other genera had different abundances in these phenotypes in the combined panel; Akkermansia, Clostridium and an unidentified genus in the Ruminococcaceae family were enriched in PSC, while Dorea, Oscillospira and Citrobacter were enriched in UC (all: p<0.05 and QFDR<0.20).
To further validate our analytical strategy, we applied the standard microbiota analysis tools LEfSe and MaAsLin on the combined data set. Together they confirmed nine of the 12 genera differing between PSC and HC in the initial analyses, including enrichment of Veillonella in PSC compared with both HC and UC (see online supplementary table S4). MaAsLin also reported a negative association between BMI and the relative abundance of the Christensenellaceae family (coefficient: −0.001, p<0.01, q value<0.02).
Global microbiota composition in PSC differs from HC and UC
The overall microbial composition of patients with PSC showed a clear shift compared with HC in both panels when analysing measures of beta diversity (see online supplementary figure S3A,B). In concordance, this was also the case in the combined panel as shown in figure 4A (unweighted UniFrac, PERMANOVA: pseudo-F statistic: 12.2, p<0.001). We were able to identify alpha diversity as one of the factors driving the differences along principal component 1 (figure 4B). Patients with PSC also showed global differences compared with UC (unweighted UniFrac, PERMANOVA: pseudo-F statistic: 2.6, p<0.01).

(A) Beta diversity plot from the combined panel showing a clear separation of PSC from HC (unweighted UniFrac, PERMANOVA: pseudo-F statistic: 12.2, p<0.001) and a more subtle separation of PSC and UC samples (unweighted UniFrac, PERMANOVA: pseudo-F statistic: 2.6, p<0.01). (B) Same plot as in (A), but samples are coloured according to their Shannon diversity indices, showing diversity as an important factor along principal component 1 (PC1). HC, healthy controls; PC, principal component; PSC, primary sclerosing cholangitis.
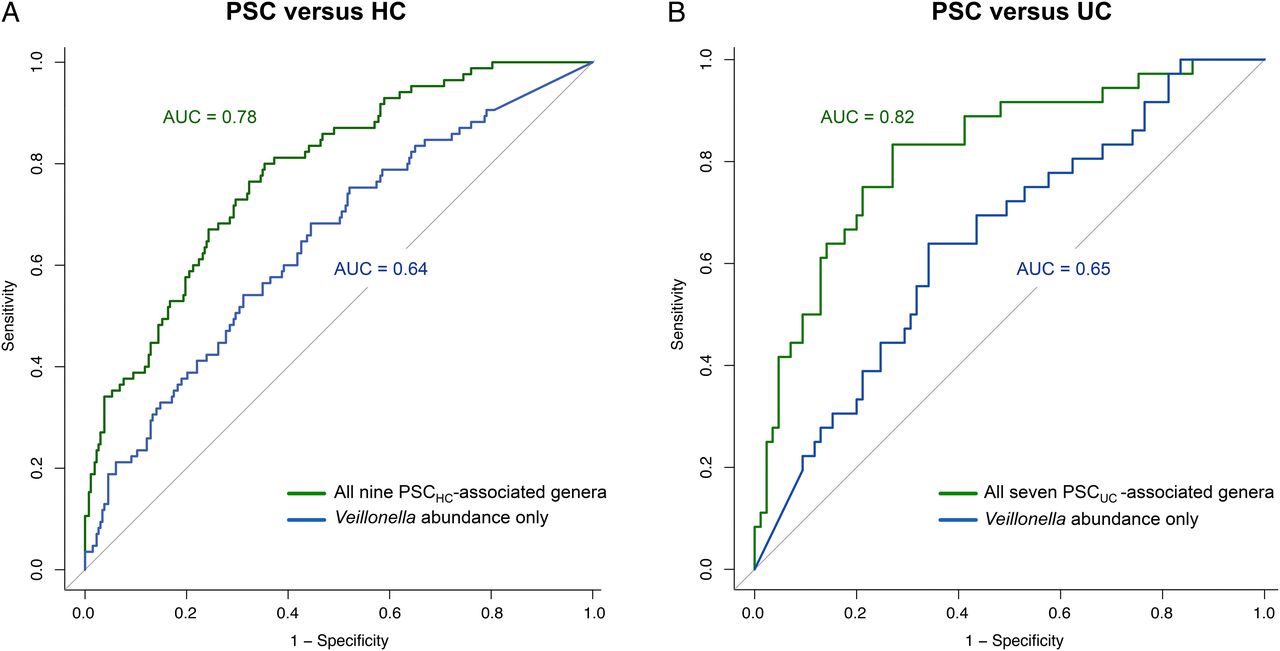
To evaluate the potential of using gut microbiota profiles to separate clinical phenotypes, we first performed AUROC analysis using the relative abundance of the Veillonella genus to distinguish PSC from HC, giving an AUC of 0.61 (95% CI 0.51 to 0.72, p<0.05) in the exploration panel, an AUC of 0.67 (0.58 to 0.76, p<0.001) in the validation panel and an AUC of 0.64 (0.58 to 0.71, p<0.0001) in the combined panel, as shown in figure 5A. Using only the nine genera that were significantly different between HC and PSC and that were confirmed by all validation methods (linear regression, LEfSe and MaAsLin, see online supplementary table S4) increased the AUC to 0.78 in all panels (95% CI 0.70 to 0.87, 0.72 to 0.87 and 0.73 to 0.84 in the exploration, validation and combined panels, respectively, all p<0.0001 (figure 5A and see online supplementary figure S4A)). When performing 1000 permutations that randomly assigned samples to an exploration panel or a validation panel, we found similar results as in the two cohorts separately (see online supplementary figure S4B). Using the same strategy comparing PSC and UC, the Veillonella genus alone gave an AUC of 0.65 (0.54 to 0.75, p<0.05, figure 5B), and the seven genera that differed between PSC and UC in the explorative analyses gave an AUC of 0.82 (CI 0.73 to 0.90, p<0.0001, figure 5B).

(A) Gut microbiota-based PSC classification using AUROC analysis (in the combined panel) using the relative abundance of the Veillonella genus (AUC=0.64, 95% CI 0.58 to 0.71, p<0.0001). When using each individual’s arcsine square root transformed abundance of the nine genera differing between PSC and HC (and validated by all secondary analyses, denoted as PSCHC), together with the coefficients from multivariate logistic regression, the AUC increased to 0.78 (0.73 to 0.84, p<0.0001). (B) The same analysis was repeated for PSC and UC. The Veillonella genus alone gave an AUC of 0.65 (0.54 to 0.75, p<0.05), and the seven genera differing between PSC and UC (denoted as PSCUC) gave an AUC of 0.82 (0.73 to 0.90, p<0.0001). AUC, area under the curve; AUROC, area under the receiver operating characteristics curve; HC, healthy controls; PSC, primary sclerosing cholangitis.
The effect of disease severity, IBD status and drugs on the gut microbiota in PSC
We then analysed all included patients with PSC separately (N=85) to explore subphenotypes. Only three of the patients with PSC (3.5%) in the cohort were classified as small duct PSC and these did not deviate significantly from large duct PSC for any of the parameters studied (see online supplementary table S5). Also, excluding small duct PSC from the data set did not change any of the results in the study in a way affecting the interpretation. There were no differences between patients with PSC with and without IBD with regard to alpha diversity (figure 2D and see online supplementary table S5) or beta diversity (see online supplementary figure S3C). Adjusting for age, sex, smoking status, BMI, the number of prescriptions for antibiotics in the last 12 months before inclusion, the duration of PSC and the duration of IBD did not alter the results (see online supplementary table S3). All alpha diversity measurements were also similar in patients with PSC with IBD irrespective of subtype (UC or CD, figure 2E and see online supplementary table S5), and IBD subtypes were also similar with regard to beta diversity (unweighted UniFrac). Men and women with PSC showed no difference with regard to alpha or beta diversity (see online supplementary figure S2B,C). We were also unable to identify any taxa that differed between PSC with and without IBD, PSC with and without concomitant autoimmune disease or men and women with PSC. We found no associations between alpha diversity and the duration of PSC disease, age at diagnosis, liver biochemistry, P-ANCA status or Mayo risk score, but identified a negative correlation between a cluster of unknown genera in the Clostridiaceae family and the duration of PSC disease (r: −0.41, QFDR<0.05). There was a positive correlation between the Veillonella genus and Mayo risk score (r: 0.25, uncorrected p<0.05). Six of the patients with PSC (7.0%) had undergone liver transplantation after inclusion in the study, and these patients had higher abundance of Veillonella compared with other patients with PSC (uncorrected p<0.02, see online supplementary figure S2D). Patients with PSC without any medication (N=12) had similar alpha diversity compared with other patients with PSC (see online supplementary table S5), decreased alpha diversity compared with HC (all measurements: p<0.01) and they did not separate from other patients with PSC in the beta diversity plot (see online supplementary figure S3D). None of the individual medications registered in the PSC group, including ursodeoxycholic acid, had a significant impact on alpha diversity (see online supplementary tables S3 and S5).
Discussion
In this cross-sectional cohort, we have identified large differences in the gut microbiota of patients with PSC compared with controls, with reduced alpha diversity and different abundances of several bacterial taxa. PSC and UC without liver disease were more similar, but still significantly different when measuring global overlap, and one bacterial genus, Veillonella, was highly enriched in PSC compared with both HC and UC. In addition, the presence of IBD did not influence the gut microbiota in PSC, suggesting that the associations are primarily accounting for the liver and bile duct affections.
The most striking feature of the PSC gut microbiota compared with HC was the reduced intraindividual bacterial diversity, and importantly, this was not related to the use of antibiotics during the last 12 months. Reduced bacterial diversity in stool has been observed in several other inflammatory and metabolic conditions, like IBD, type 1 diabetes, arthritis and obesity.13 ,15 ,16 ,33 Our data are in line with reduced diversity observed in a Dutch study of the microbiota of gut mucosal biopsies in 12 patients with PSC.20 Besides often being associated with the healthy state, high diversity has been described as a driving force for evolution of the immune system, allowing the host to accommodate environmental antigens and possibly self-antigens;34 however, reduced bacterial diversity does not seem to be the case for liver disease in general, for example, non-alcoholic steatohepatitis or cirrhosis,35 ,36 suggesting that the observed differences are related to the characteristics of PSC. The concept that PSC is associated with a certain gut microbiota profile is further supported by the results that a combination of the most robust associated bacterial taxa gave an AUC of 0.78 when separating PSC and HC, and an AUC of 0.82 when separating PSC and UC. This is in line with findings in treatment-naïve CD with an AUC of 0.66–0.85,19 and an AUC of 0.71–0.83 in type 2 diabetes.37 ,38
Altered abundances of several genera contributed to the unique gut microbial signature found in PSC in our study, the most prominent being the marked enrichment of the Veillonella genus, an obligate anaerobic, gram-negative coccus, sensitive to metronidazole, but not vancomycin.39 It has been associated with other inflammatory and progressive fibrotic conditions like in pulmonary cystic fibrosis and idiopathic pulmonary fibrosis (lung microbiota) and the recurrence of disease in patients with CD undergoing ileocaecal resection (mucosal biopsies).40–42 While suggesting that Veillonella has a role in the aetiology of PSC would be speculative, the robust association with PSC and links to fibrosis in other phenotypes warrant further study.
Although limited information is available regarding the effects on the microbiota of cholestasis and cholangiopathies in humans, in experimental cholestasis in animals (using bile duct ligation), increased bacterial translocation and systemic endotoxin levels have been observed, but with a minor contribution of the microbiota.43 The multidrug resistance 2 knockout (mdr2−/−) mouse model of PSC, on the other hand, showed a marked exacerbation of their hepatobiliary disease when raised in a germ-free environment.44 In vitro data suggested that this in part could be explained by the absence of commensal microbial metabolites,44 for example, secondary bile acids. Secondary bile acids have anti-inflammatory properties in vitro,45 and decreased levels of these secondary bile acids compared with HC have been reported in patients with PSC and in patients with IBD (both UC and CD) during disease flares.44–46 On the other hand, secondary bile acids are not reduced in primary biliary cirrhosis, another human cholestatic disease.46 Together this highlights the need for future studies to assess the involvement of the gut microbiota in cholestasis.
While the gut microbiota of patients with UC without PSC was different from HC in our study, as in other studies,17 it was highly similar in PSC irrespective of IBD status. This could suggest that the dysbiosis in patients with PSC is related to the liver disease, and not IBD. This is supported by the observation that IBD subtype in patients with PSC did not influence the gut microbial profile, which contrasts the differences between UC and CD in patients without PSC.16 It is also possible that very subtle IBD phenotypes in patients with PSC not discovered by endoscopy screening could be present and influence the gut microbiota, or the gut microbiota profile in PSC may influence the accompanying IBD. In this regard, it should be noted that IBD in PSC has several characteristics that differ from those of patients with IBD without liver disease.1 ,47–50
A crucial question, which can only be speculated upon, is whether disease or its treatment is causing changes in the microbiota; do the microbiota alterations represent an actual link between the gut and the liver in PSC, or are they secondary to advanced liver disease? There were no correlations between PSC duration or biochemical parameters and diversity in the present study, speaking against the latter, although a link between particularly high prevalence of Veillonella and more severe liver disease cannot be excluded. Data on preclinical microbiota profile in inflammatory diseases are scarce, but data from type 1 diabetes and CD suggest that gut microbiota changes could precede at least the clinical onset of disease.15 ,19 Overall, it is therefore possible that the observed microbiota alterations in PSC are involved in disease development.
Our knowledge of the effects of pharmacological agents on the microbiota is limited. We were unable to detect any effect of medication on the gut microbiota of our patients with PSC, including the use of ursodeoxycholic acid. 5-Aminosalicylic acid (5-ASA) was used by 41% of the patients with PSC in our study, and it has previously been shown to cause a decrease in microbial diversity in IBS,51 but did not show any effect on diversity in our patients with PSC. Neither was there any association between antibiotics the previous year and decreased diversity in the PSC group, contrasting our findings in the HC group. This could suggest that antibiotics, to a lesser extent than the disease in itself, are affecting the microbial diversity; however, long-lasting effects of antibiotics in the PSC group may be present.52 ,53
The major strengths of this study are the inclusion of a large number of patients with PSC and controls, the use of a standardised collection procedure and state-of-the art library preparation and sequencing methods. Power calculations for gut microbiota studies are challenging and not well developed, in part because little is known about the effect sizes to be expected and a large number of different bacterial taxa present. The number of available samples therefore determined the study size. It will be important to increase statistical power in further studies to explore the role of the gut microbiota in subphenotypes in PSC.
To reduce the risk of false-positive results, we applied a conservative two-stage design in our analysis when comparing PSC and HC, performed multivariate linear regressions and validated the analyses by applying other published tools. With regard to validation of data quality, we were able to reproduce key features of the UC gut microbiota (reduced diversity and depletion of the Akkermansia genus)54 ,55 and the association between the abundance of Christensenellaceae and BMI.56 A question to be resolved is the importance of missing detailed dietary history in this and other microbiota studies, but no standardised method for adjusting microbiota data using diet exists.57 In the present study, this was handled by removing all individuals reporting to have structured adjustments in their diet, for example, vegetarians and gluten free, but it cannot be excluded that subtle, undetected dietary factors could have influenced our results.
In conclusion, patients with PSC showed a distinct gut microbial signature, clearly separate from both HC and UC without liver disease, but similar in PSC with and without IBD. The Veillonella genus, which is also associated with other chronic inflammatory and fibrotic conditions, was highly enriched in PSC. Overall, this study provides a basis and rationale for further studies of the microbiota both related to pathophysiology and clinical utility in PSC, with the potential to improve patient care.
Acknowledgments
The authors would like to thank Turid Bua, study nurse at the Department of Gastroenterology, Oslo University Hospital Ullevål, for help with recruiting the UC controls, Kristian Alfsnes, Eva Kristin Schjelderup and Mette Nyberg for contributing to DNA extractions, Hege Dahlen Sollid, Mona Bjørnstad and Liv Wenche Torbjørnsen for help at the Norwegian PSC Research Center, Fredrik Bäckhed for helpful discussions and the Norwegian Sequencing Centre for help with sequencing. Benedicte A. Lie and the Norwegian Bone Marrow Donor Registry are acknowledged for providing access to HC.
References
Supplementary materials
Supplementary Data
This web only file has been produced by the BMJ Publishing Group from an electronic file supplied by the author(s) and has not been edited for content.
- Data supplement 1 - Online figures
- Data supplement 2 - Online tables
Footnotes
Contributors MK, JAA, THK and JRH planned the study. MK, JAA, MV, MLH, ES, BM and JRH contributed to collection of samples and clinical data. MK and JAA performed presequencing laboratory preparations. KH performed the post-sequencing data processing. MK, SN, HR and JRH planned the statistical analyses. MK, SN and HR performed the statistical analyses and MK, SN, MT, H-UM, HR, PA, THK and JRH interpreted the data. MK wrote the first draft and PA, THK and JRH contributed to the writing of the manuscript. All authors read, critically revised for important intellectual content and approved the final manuscript.
Funding THK was supported by a grant from Western Norway Regional Health Authority (grant number 911802). JRH is funded by the Norwegian PSC Research Center and the Norwegian Research Council (project number 240787/F20). An Illumina MiSeq was covered by a grant from Fougner-Hartmann's Family Fund.
Competing interests JRH reports grants from Norwegian Research Council; THK reports grants from Western Norway Regional Health Authority during the conduct of the study.
Ethics approval Regional Committee for Medical and Health Research Ethics in South-Eastern Norway (reference number 2012/286b).
Provenance and peer review Not commissioned; externally peer reviewed.