Article Text

Abstract
Objective Colorectal cancer (CRC) has a substantial heritable component. Common genetic variation has been shown to contribute to CRC risk. A study was conducted in a large multi-population study to assess the feasibility of CRC risk prediction using common genetic variant data combined with other risk factors. A risk prediction model was built and applied to the Scottish population using available data.
Design Nine populations of European descent were studied to develop and validate CRC risk prediction models. Binary logistic regression was used to assess the combined effect of age, gender, family history (FH) and genotypes at 10 susceptibility loci that individually only modestly influence CRC risk. Risk models were generated from case-control data incorporating genotypes alone (n=39 266) and in combination with gender, age and FH (n=11 324). Model discriminatory performance was assessed using 10-fold internal cross-validation and externally using 4187 independent samples. The 10-year absolute risk was estimated by modelling genotype and FH with age- and gender-specific population risks.
Results The median number of risk alleles was greater in cases than controls (10 vs 9, p<2.2×10⁻¹⁶), confirmed in external validation sets (Sweden p=1.2×10⁻⁶, Finland p=2×10⁻⁵). The mean per-allele increase in risk was 9% (OR 1.09; 95% CI 1.05 to 1.13). Discriminative performance was poor across the risk spectrum (area under curve for genotypes alone 0.57; area under curve for genotype/age/gender/FH 0.59). However, modelling genotype data, FH, age and gender with Scottish population data shows the practicalities of identifying a subgroup with >5% predicted 10-year absolute risk.
Conclusion Genotype data provide additional information that complements age, gender and FH as risk factors, but individualised genetic risk prediction is not currently feasible. Nonetheless, the modelling exercise suggests public health potential since it is possible to stratify the population into CRC risk categories, thereby informing targeted prevention and surveillance.
- Genetic
- risk
- prediction
- colorectal cancer
- cancer genetics
- molecular genetics
- cancer susceptibility
- surgery for IBD
- colorectal cancer screening
- genetics
- colorectal cancer genes
- family cancer
- cancer epidemiology
- genotype
- IBD—genetics
- gallstones
- gallstone disease
- gallstone disease
- fatty liver
- epidemiology
- colon carcinogenesis
- molecular biology
- cancer epidemiology
- cancer prevention
- cancer epidemiology
- cancer
- cell biology
- endocrine tumours
- gastrointestinal neoplasia
- gene mutation
- colorectal neoplasia
- pancreatic cancer
Statistics from Altmetric.com
- Genetic
- risk
- prediction
- colorectal cancer
- cancer genetics
- molecular genetics
- cancer susceptibility
- surgery for IBD
- colorectal cancer screening
- genetics
- colorectal cancer genes
- family cancer
- cancer epidemiology
- genotype
- IBD—genetics
- gallstones
- gallstone disease
- gallstone disease
- fatty liver
- epidemiology
- colon carcinogenesis
- molecular biology
- cancer epidemiology
- cancer prevention
- cancer epidemiology
- cancer
- cell biology
- endocrine tumours
- gastrointestinal neoplasia
- gene mutation
- colorectal neoplasia
- pancreatic cancer
Significance of this study
What is already known on this subject?
-
Colorectal cancer has a heritable component to its aetiology.
-
Common genetic variation contributes to risk.
-
A number of common genetic variants associated with colorectal cancer risk have been identified.
What are the new findings?
-
There is a highly significant difference in risk allele distribution between cases and controls.
-
Genotype data from common genetic variants provide risk information over and above family history, gender and age.
-
Genotype data, family history, gender and age can be incorporated into risk models.
-
Individualised risk prediction is not yet feasible.
-
A modelling exercise suggests that it is possible to identify a population subgroup with sufficiently high colorectal cancer risk to be relevant clinically and for public health strategy.
How might it impact on clinical practice in the foreseeable future?
-
Applying the risk prediction model could help to identify high-risk groups for intensive surveillance as part of public health measures to control colorectal cancer.
-
The estimated number of people who could be offered genetic testing for common genetic risk factors is both logistically and financially feasible.
-
Identification of additional genetic risk factors is likely to further improve colorectal cancer risk prediction.
Introduction
Colorectal cancer (CRC) is common in Western countries, with the global annual incidence exceeding 1 million and accounting for ∼9% of all cancers.1 The variation in worldwide incidence is narrowing rapidly due to increasing exposure to ‘westernised’ lifestyle risk factors in populations that had historically low rates. Population-based registry data indicate that CRC remains a common cause of cancer death (overall survival approximately 50%2). Screening of average risk populations using faecal occult blood testing (FOBT) has been introduced in many countries following demonstration of mortality reductions in several large trials.3 Furthermore, invasive screening using flexible sigmoidoscopy has already been trialled with promising results for a specific population risk category defined only by age.4 Incidence reduction may also be feasible, both in the general population5 ,6 and in genetically-defined high-risk groups.7 ,8 Thus, stratifying the average risk population into risk categories offers the potential of tailoring the intensity of surveillance, or preventive approach, to the predicted level of risk. Hence, those at highest risk could be offered more frequent or more sensitive FOBT screening. Endoscopic surveillance by colonoscopy or flexible sigmoidoscopy might also be instigated in those at highest risk.
The heritable component of CRC variance is around 35%,9 but only about 5% of cases are attributable to highly penetrant mutations. Recent genome-wide association studies (GWAS) have identified a number of common genetic risk loci for CRC.10–17 Risk associated with each locus is individually modest, but risk alleles are carried by a large proportion of the population because of the high allele frequencies.10–17 Thus, high absolute risks, exceeding thresholds triggering clinical intervention, could be apparent in population subgroups carrying multiple risk alleles. Colonoscopic surveillance is already offered to people with a modestly elevated risk due to a personal or family history (FH) of CRC.6 More intensive surveillance is offered to high-risk individuals from families with Lynch syndrome.18–20 Similarly, genotype data from common variants offer the possibility of partitioning risk within the average risk population according to the population frequency and risk of multilocus genotypes. More intensive surveillance could be offered to those at highest risk, while the remainder could remain on average risk screening protocols, as proposed for breast cancer.21
We set out to develop and validate CRC risk prediction models and to assess model performance in profiling individual genetic risk of CRC. We developed models incorporating age, gender, FH and genotype data from 10 common genetic risk variants in over 40 000 individuals from multiple populations, mainly of north European descent. To gauge the broader future potential of genetic risk modelling, we assessed the utility in categorising risk subgroups within the population by applying the risk models to available Scottish population data on CRC risk by age and gender.
Methods
Study subjects
To generate the risk models, we studied a total of 44 389 subjects (24 395 CRC cases, 19 994 cancer-free controls) from seven geographically distinct populations, predominantly of European origin (table 1). Inclusion criteria for recruitment to some studies with a primary focus on gene discovery required Caucasian ancestry. In other studies, subjects were sampled from the (mainly) Caucasian local population but non-whites were not excluded. Overall, there was of a strong preponderance of white subjects, but we did not formally test ancestry by genetic means in order to exclude genotypes from non-Caucasian subjects in the risk modelling. Age, gender, demographic and clinical data were collected, along with blood samples. Samples were genotyped for the 10 risk single nucleotide polymorphisms (SNPs), as were the external validation case–control sets (1563 Swedish cases and 1504 controls; 702 Finnish cases and 418 controls). In risk model analyses we only incorporated samples for which we generated genotypes for all 10 risk SNPs (ie, no missing values). Table 1 shows sample numbers from each population along with the nature and origin of case and control subjects. FH information was available for a subset. A minority of studies used FH to select cases and/or controls. All research subjects were recruited with fully informed consent under ethics approvals relevant to each centre and in accordance with the tenets of the Declaration of Helsinki. All studies were approved by the respective Institutional Review Boards or relevant research governance bodies.
Sample sets used to generate the models comprised UK (COGS and SOCCS studies); UK (CORGI and NSCCG studies); UK VICTOR study; UK, East Anglia (SEARCH); Canada, Ontario (ARCTIC); Spain (EPICOLON1 and EPICOLON2); Melbourne and Seattle (Colon CFR); Germany, Heidelberg and Kiel (DACHS and POPGEN)
Genotyping
DNA purification and quality control procedures are described elsewhere.15 ,17 Genotyping was performed using various platforms in use at each of the contributing sites. The 10 common CRC risk SNPs previously identified through GWAS studies and shown to tag independent loci were: rs6983267,10–12 ,17 rs4779584,14 rs4939827,13 ,15 rs3802842,15 ,16 rs10795668,15 ,16 rs16892766,15 ,16 rs4444235,17 rs9929218,17 rs10411210,17 rs961253.17
Statistical analysis
Allele frequencies for each of the 10 CRC SNPs were calculated in cases and controls for each population. The effects of SNP genotype, gender and FH were assessed using binary logistic regression. The total number of risk alleles for each population and for all samples from the model generation set together was then assessed and a two-sided t test applied to compare the number of risk alleles between cases and controls. In the logistic regression assessing the effect of FH, we only incorporated data from population-based studies where there was no (Scotland, DACHS) or limited (OFCR) prior selection on FH criteria (table 2)
Study populations with available family history data and where there was no (or limited) selection bias on the basis of family history
Risk modelling
Generation and internal validation of the risk models was based on the 39 266 subjects without any missing values, including genotype data for all 10 SNPs. The model was considered to be additive on the log risk scale. The probability that a person carrying a given number of common risk alleles develops CRC by age x was estimated using a Bayesian approach. Probability of disease by age x is expressed as P(Dx). We defined carriers as subjects with a given number of risk alleles (Z), where Z varied between 11 and 13. Thus, if Z≥13, then subjects with ≥13 alleles were classified as carriers (G=1) and subjects with <13 alleles were non-carriers (G=0). To estimate the probability that carriers of ≥Z alleles (G=1) develop CRC by age x, then
The probability that a non-carrier (G=0) develops CRC by age x is:
We assume that P(G=1|Dx) and P(G=0|Dx) are different from each other but are constant over all ages (x) and call these P(G=1|D) and P(G=0|D), respectively. This seems reasonable since each allele exerts a constant effect on risk over the observed lifetime.15 ,17 P(G=1|D) and P(G=0|D) can be estimated as the proportion of study cases with ≥Z or <Z risk alleles, respectively. P(G=1) and P(G=0) were estimated from control data to gauge ‘carrier’ frequency of a given number of risk alleles in the general population. All controls were cancer-free at the time of sampling. Some control sets were enriched by selection for absence of a CRC FH and so P(G=1) may be marginally underestimated in the general population.
Multivariate analysis using binary logistic regression was conducted to test the effect of each covariate. Tested models included, variously, genotype data for the 10 SNPs; FH status; age (continuous variable); gender. Genotype for each SNP was assumed to be additive on the log risk scale and genotypes were scored as −1, 0 or 1 in the logistic regression analysis.
Assessment of risk model performance
Risk model performance was assessed by both internal and external validation using the statistical package ROCR.23 Internal validation comprised 10-fold cross-validation to estimate receiver operator characteristic (ROC) curves by randomly assigning study subjects and all associated data for that individual into 10 complementary datasets. One dataset at a time was used as the validation set and the remaining nine datasets as the training set. Separate ROC curves were generated for models incorporating: (1) age, gender, FH and genotypes at all 10 loci for the population-based non-FH-selected study populations (table 2); and (2) 10 locus genotypes for all datasets. External validation using the two independent case–control sets (Sweden, Finland) was conducted by separately fitting the model in the analysis using all 10 SNP genotypes for 1563 Swedish cases and 1504 controls and 702 Finnish cases and 418 controls. Again, model performance was evaluated using ROC analysis. Probability of a subject being a case or control was determined by estimating the proportion of true and false positives at different cut-off points.
Estimating the potential public health impact by applying risk prediction models to available Scottish population data
We used Scottish population and Cancer Registry data as a reference for estimating the probability of developing CRC. We consider the use of Scottish population data to be valid because there is comprehensive population coverage and high levels of data completeness,24 the incidence of CRC is broadly representative of northern European and North American populations2 and available systematic FH data from our current and past studies. The age-specific CRC rate was calculated from 2006 cancer registration data and from age-specific estimates of the Scottish population.25 The cumulative CRC rate for any given age was calculated separately for men and women as the sum of the age-specific rates up to that age. The cumulative probability of developing CRC in the general population by various ages, FH status and risk allele ‘load’ is shown in table 3 along with absolute risks in the general population.
Scottish population data and incidence rates along with cumulative probability of developing colorectal cancer (CRC) by age and gender
Results
Assessment of risk prediction models
Risk allele frequencies are shown in figure 1. ORs are grouped for subjects carrying ≤4 risk alleles and ≥14 alleles because of very small numbers of subjects at these extremes. Figure 2 shows risk allele frequency comparisons by population as a box plot. The frequency of carriage of ≥12, ≥13 and ≥14 alleles (equating to P(G=1|D)=1-P(G=0|D)) in the combined case sets was 0.205, 0.091 and 0.032, respectively. Corresponding control subject allele frequencies (representative of the general population) were 0.141, 0.055 and 0.017 for ≥12, ≥13 and ≥14 alleles, respectively (equating to P(G=1)).
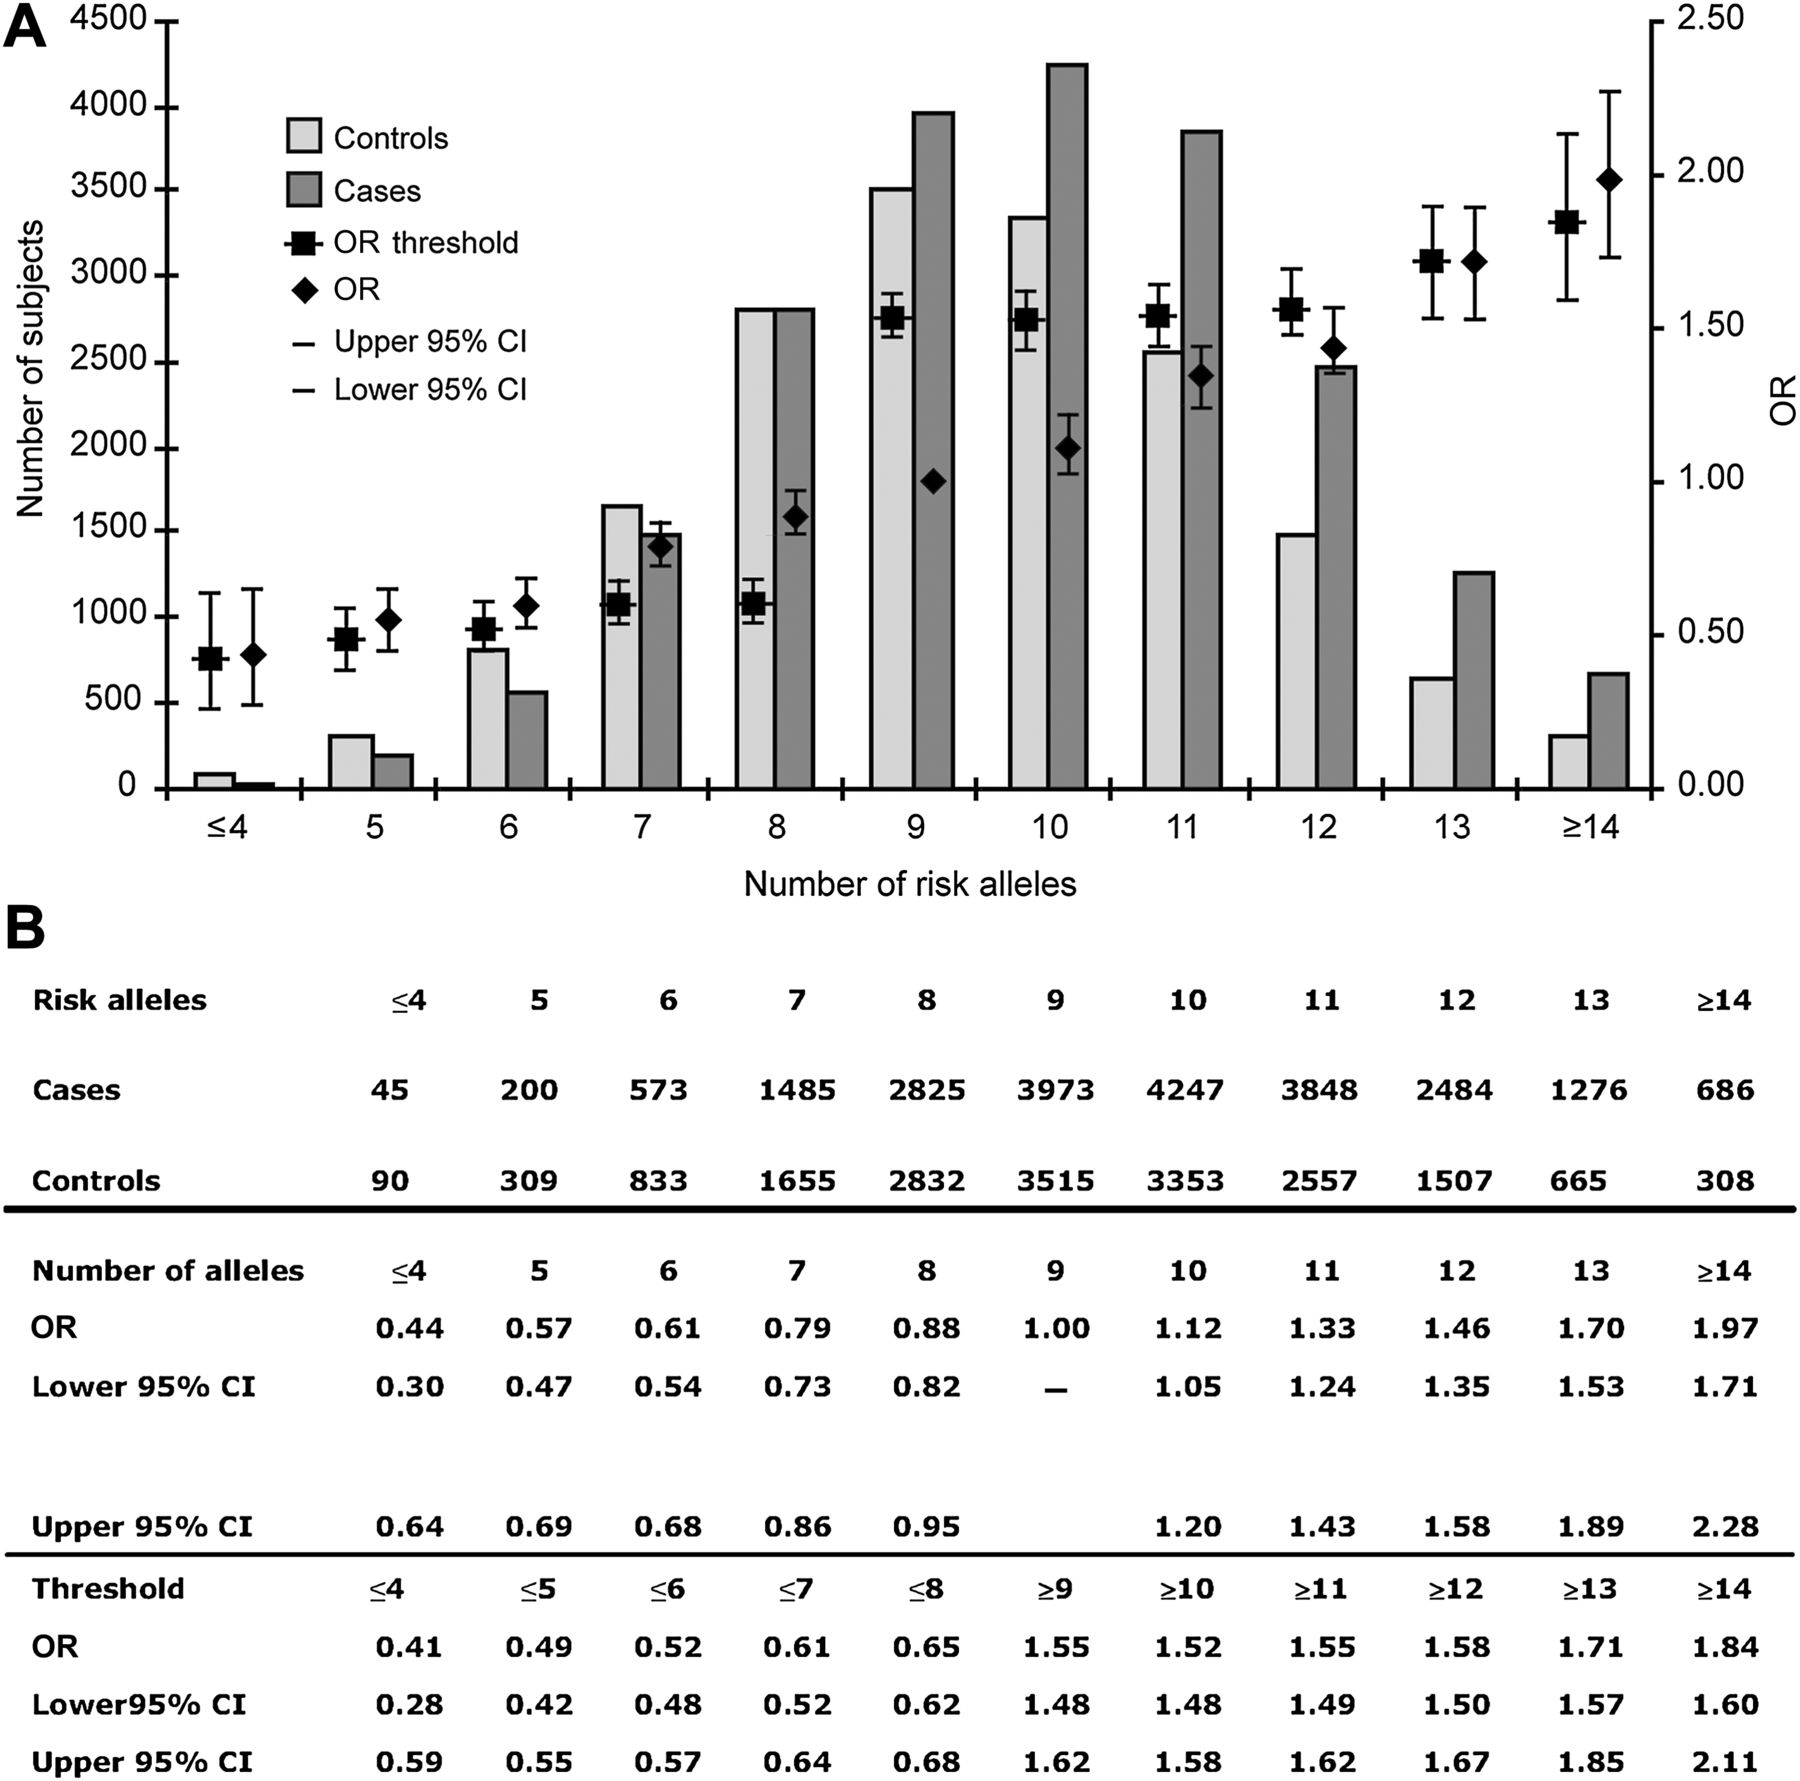
Distribution of risk by allele number. (A) ORs (95% CI) for each specific number of risk alleles are shown by diamonds using nine alleles as the reference. ORs (95% CI) for thresholds of risk alleles are indicated by squares (thus risk associated with carrying ≥10 alleles is compared ≤9 alleles, and so on). Allele frequency distribution in cases and controls from all populations used in generating the models is shown in columns. (B) Data are shown in tabular form for ORs for number of risk alleles and partitioned by various thresholds of risk alleles.
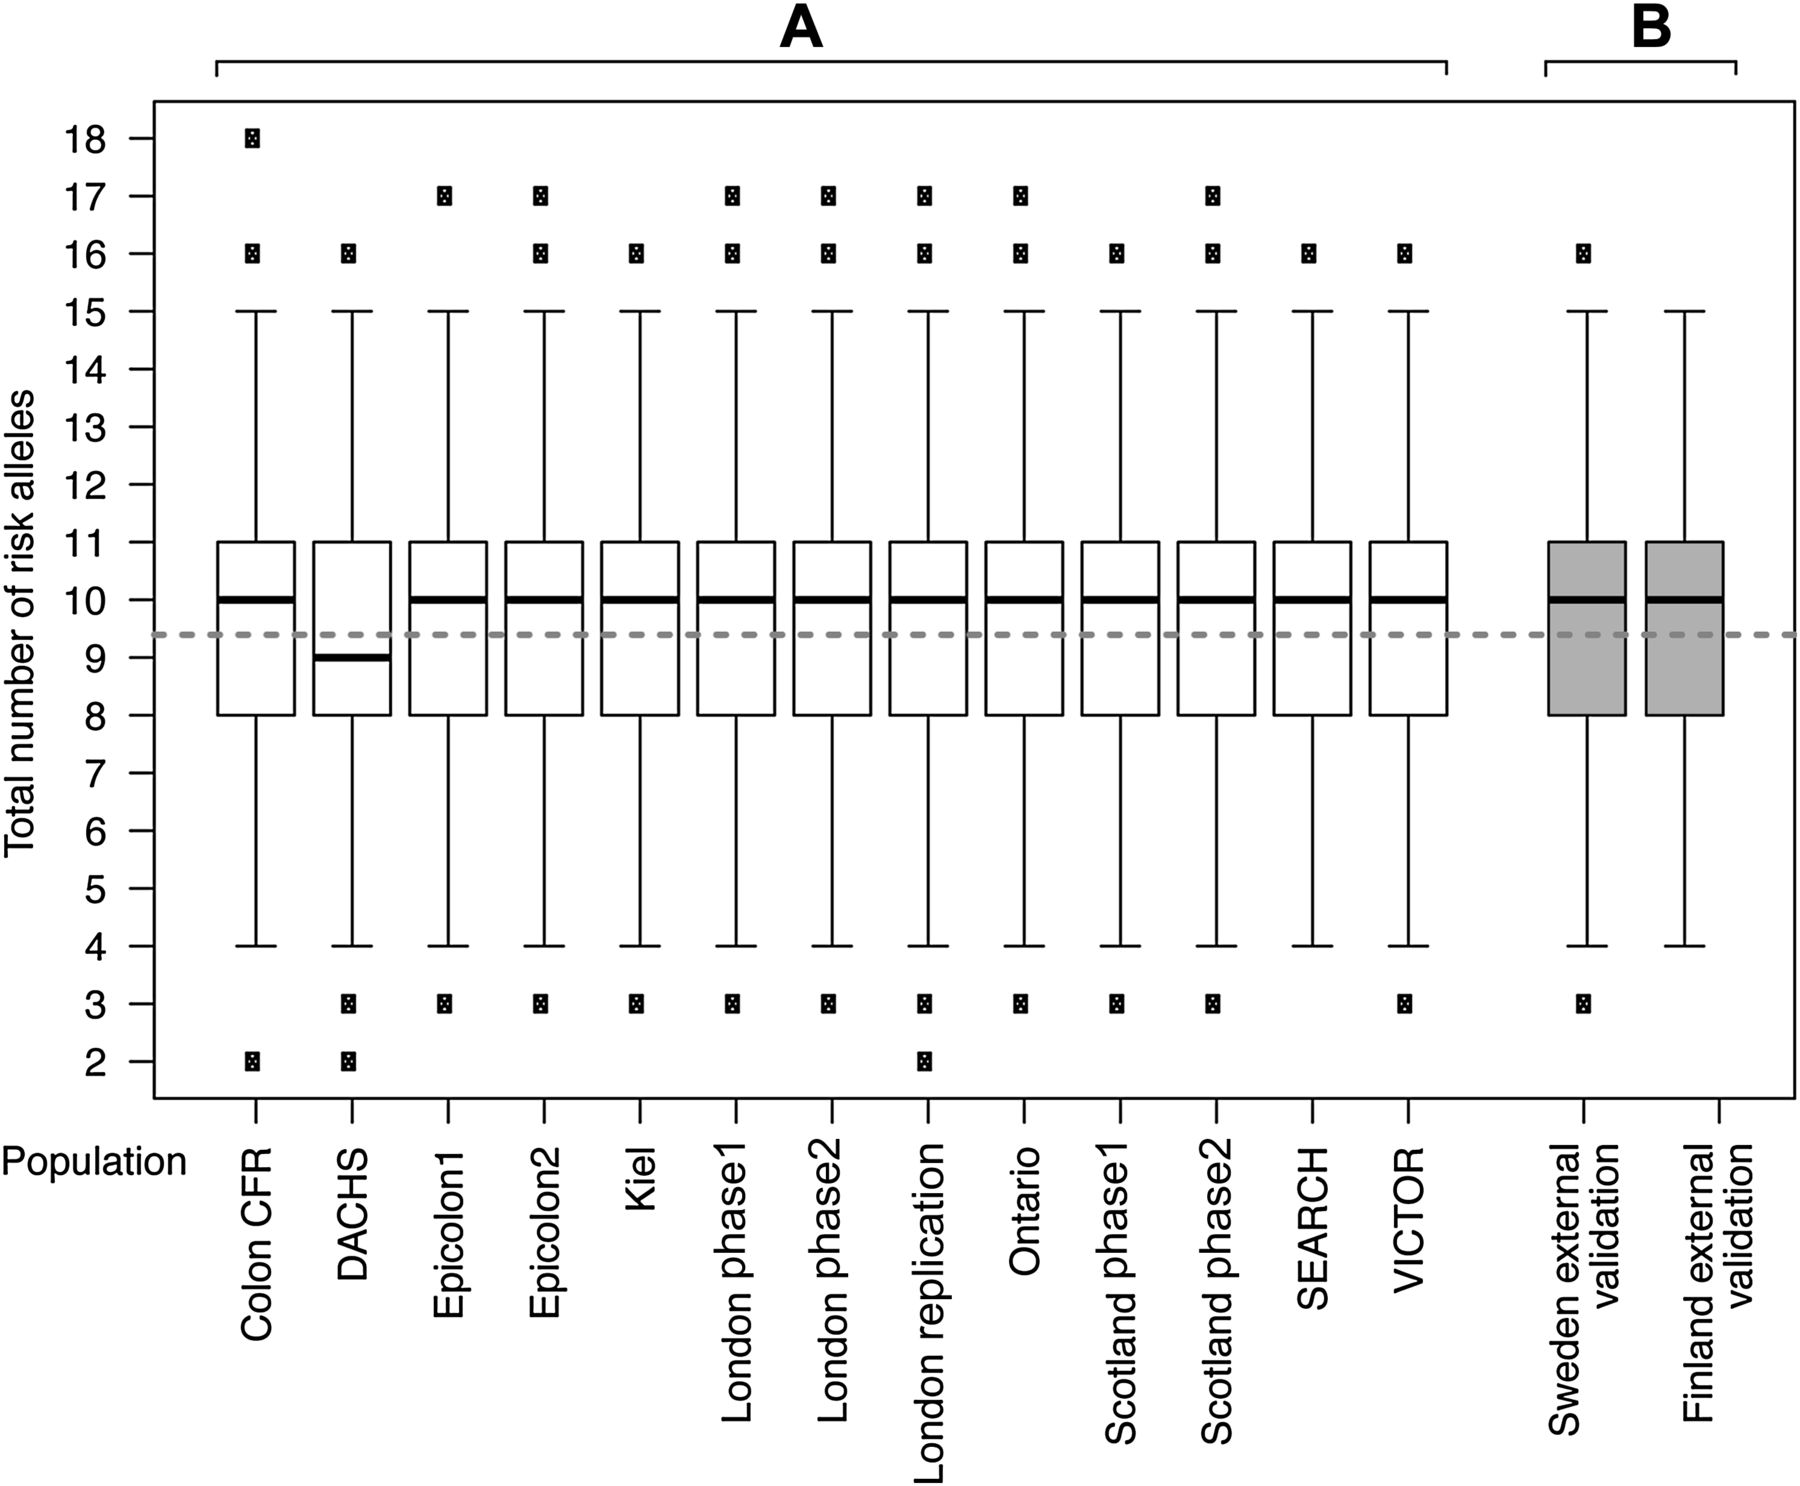
Box plot of risk alleles in cases and control subjects by study. Box plot of number of risk alleles in cases and control subjects for each study population used in the generation and internal validation of the risk models (A) and in the external validation sets from Sweden and Finland (B). Median number of risk alleles for cases and controls combined is indicated by a heavy black line. Mean number of alleles is indicated by a fine solid grey line in cases and a broken grey line for controls. There was a marginal difference in the median number of risk alleles (9 vs 10) in the DACHS dataset compared with other populations, but the difference in mean number of alleles between cases and controls was similar to that in all other populations.
Although there was only a small difference in the mean number of risk alleles in cases compared with controls (9.93 in cases vs 9.39 in controls; difference—0.53 alleles), this was highly significant (95% CI 0.57 to 0.49, p<2.2×10⁻¹⁶, two-sided t test) because of the very large sample size. The median number of alleles in cases was also significantly different from that in controls (10 for cases, nine for controls, p<2.2×10⁻¹⁶, Mann–Whitney test; figure 2). Consistent with each locus having an independent effect on CRC risk, there was no statistically significant interactive effect between any of the 10 loci (p>0.05 for interaction, testing each locus against all others). Table 4 shows the effects of age, gender, FH and genotype for SNPs tagging each risk locus with the relative weight contributed by each variable in the logistic regression. The genotype provided additional information on CRC risk that is complementary to FH.
Results of logistic regression to assess the effect of genotype at each of the 10 risk loci for samples with genotypes at all 10 single nucleotide polymorphisms and the effect of genotype, age, gender and family history (FH) for study populations where study design did not involve case or control selection on the basis of FH criteria (see table 2)
The discriminative ability was assessed by ROC incorporating SNP genotypes at all 10 loci alone or in combination with gender, age and FH data (figure 3). The average area under the curve (AUC) for 10 iterations in the cross-validation analysis was 0.57 for the model incorporating SNP genotypes alone (39 266 subjects) and 0.59 when incorporating genotype, age, gender and FH status (11 324 subjects). Values for each of the 10 iterations of cross-validation are shown in table 5. The relationship and variability between estimated risk and increasing number of risk alleles is shown in figure 3. The association between risk and total number of alleles (the SCORE) was also highly significant in the external validation sets (p=1.2×10⁻⁶ for Swedish population, p=2.6×10⁻⁵ Finnish population). On average, each allele increased the risk of CRC by 9% (OR 1.09, 95% CI 1.05 to 1.13) for Swedish samples and by 3% (OR 1.03, 95% CI 1.02 to 1.04) for Finnish samples. Fitting Swedish and Finnish genotype data (3067 and 1120 subjects) generated AUC of 0.56 and 0.57, respectively (figure 4). Thus, ROC analyses show that risk models have limited individual predictive performance across the observed risk spectrum and allele distributions. This is consistent with our previous estimate of an overall accuracy of prediction of the genetic component of risk of 26%, given that we previously estimated that all 10 of these SNPs explained about 6% of the excess familial risk and about 1.26% of the overall variation of liability to CRC.26 It should be noted that these estimates do not take into account the environmental component of risk, nor the effects of age and gender on risk.

Variation in predicted probability of colorectal cancer (n=39 266) for a given number of risk alleles in the logistic regression model incorporating genotype data.
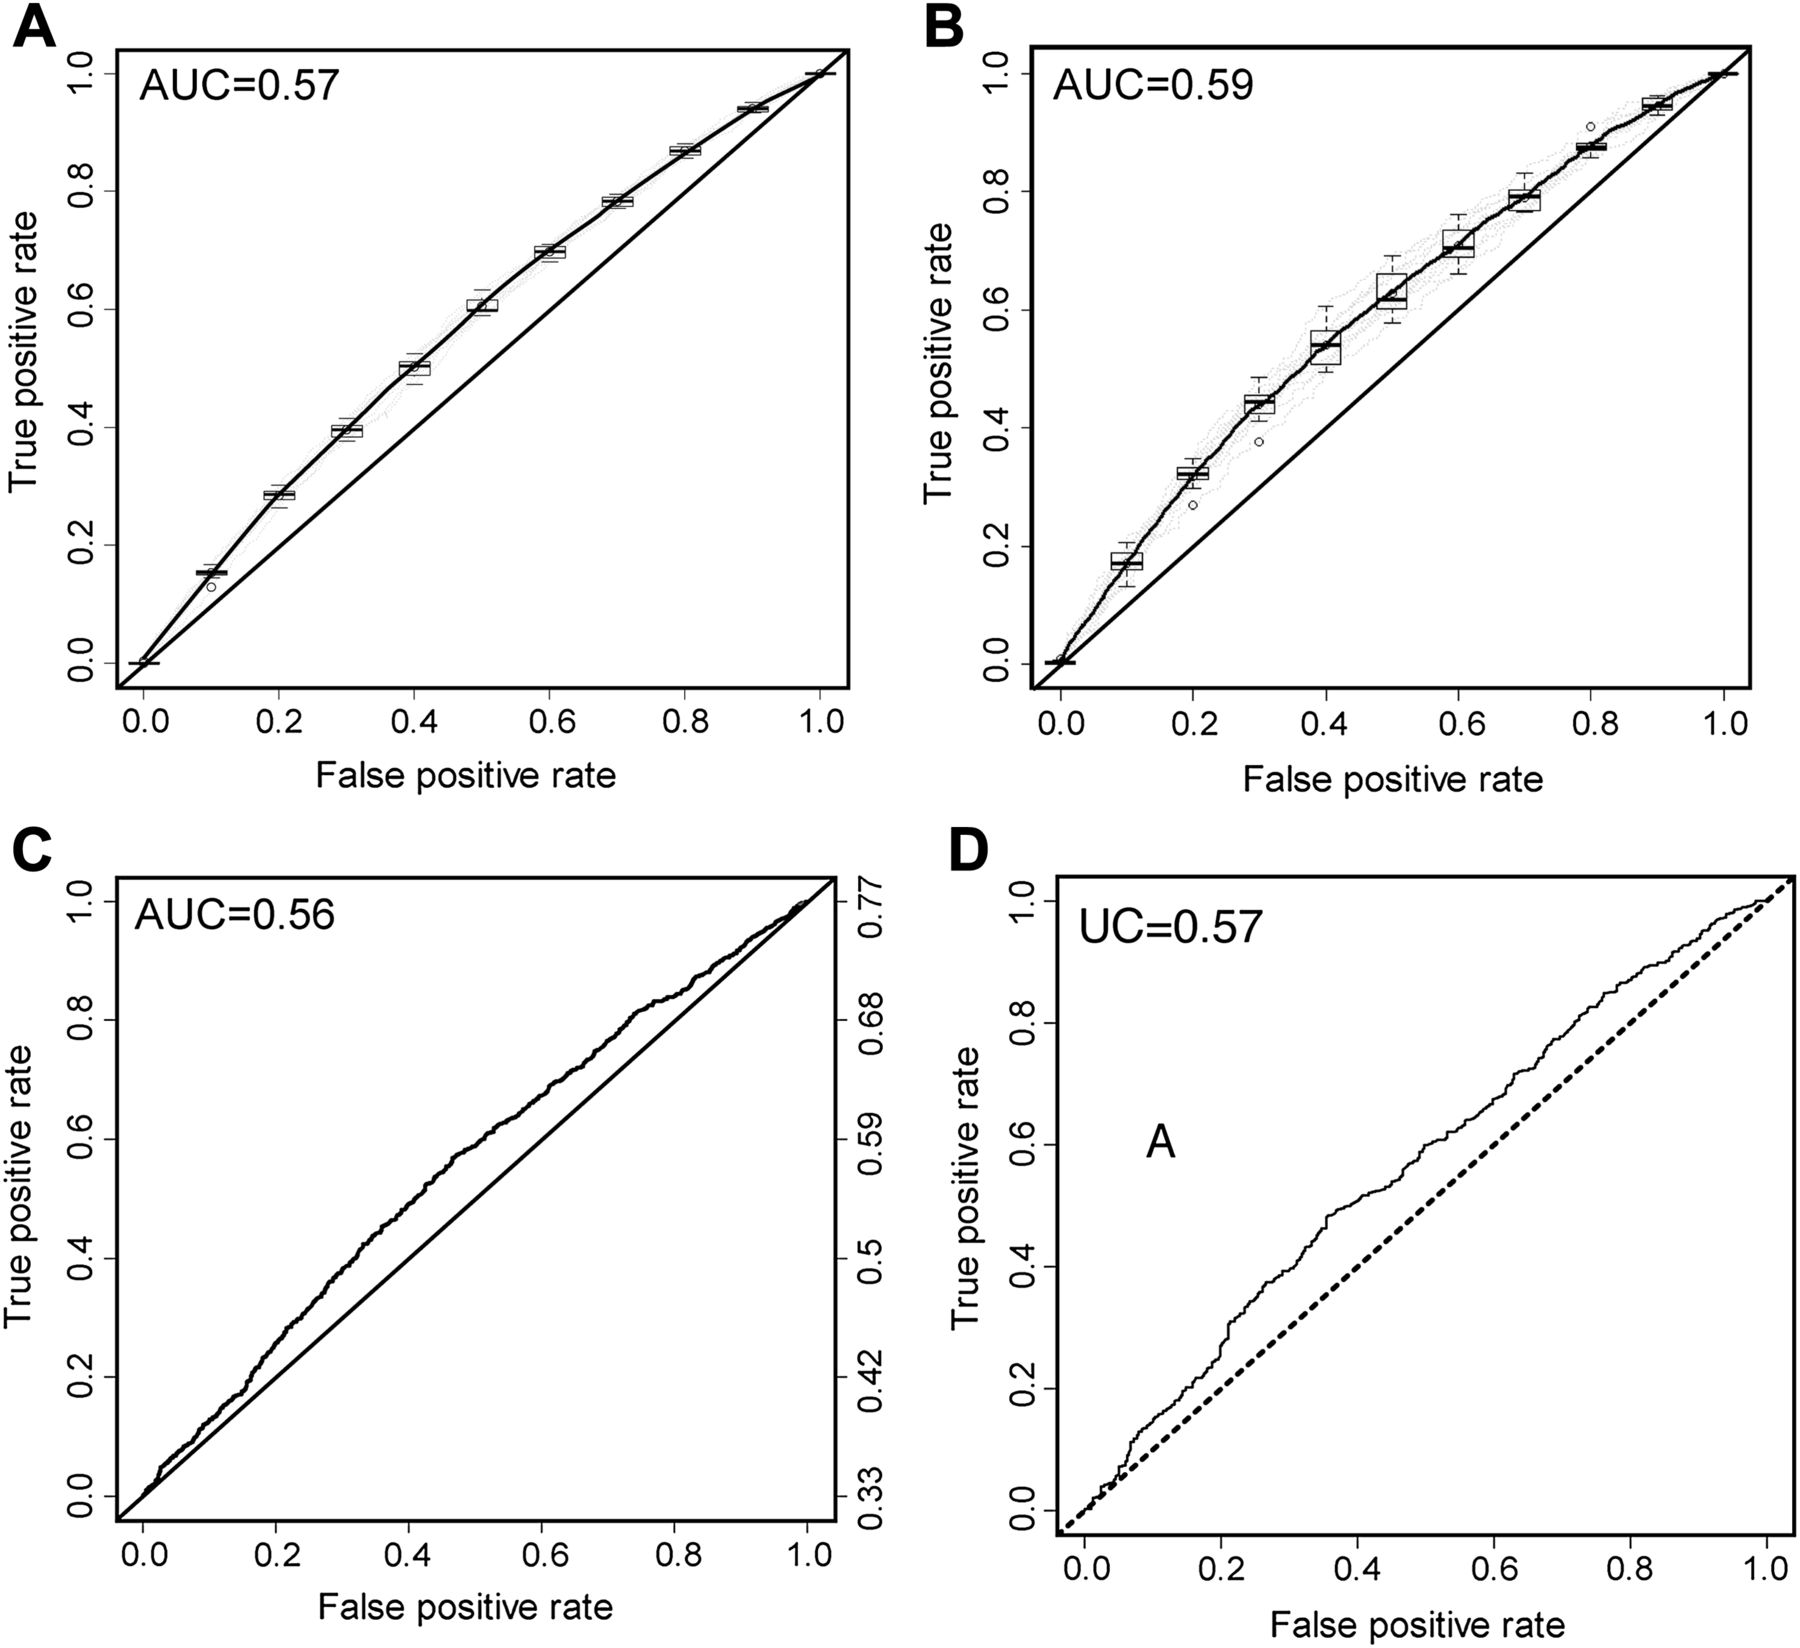
ROC curves assessing the discriminative ability of (A) the logistic regression model incorporating only genotype data for the 10 risk single nucleotide polymorphisms (SNPs) (39 266 subjects) and (B) a model incorporating genotype data for the 10 SNPs along with age, family history status and gender (11 324 subjects). Mean ROC curve is plotted and the spread of the estimates shown as a box plot along the ROC curve is shown for (A) and (B). External validation comprised analysis of genotype data from 3067 Swedish subjects (C) and 1120 Finnish subjects (D).
Results of 10 successive iterations of validation of the logistic regression model in subjects with age, sex and genotype data who were not selected in any way by family history (FH) criteria and in subjects with genotype data alone at every single nucleotide polymorphism
Estimating the proportion of the population in high-risk categories
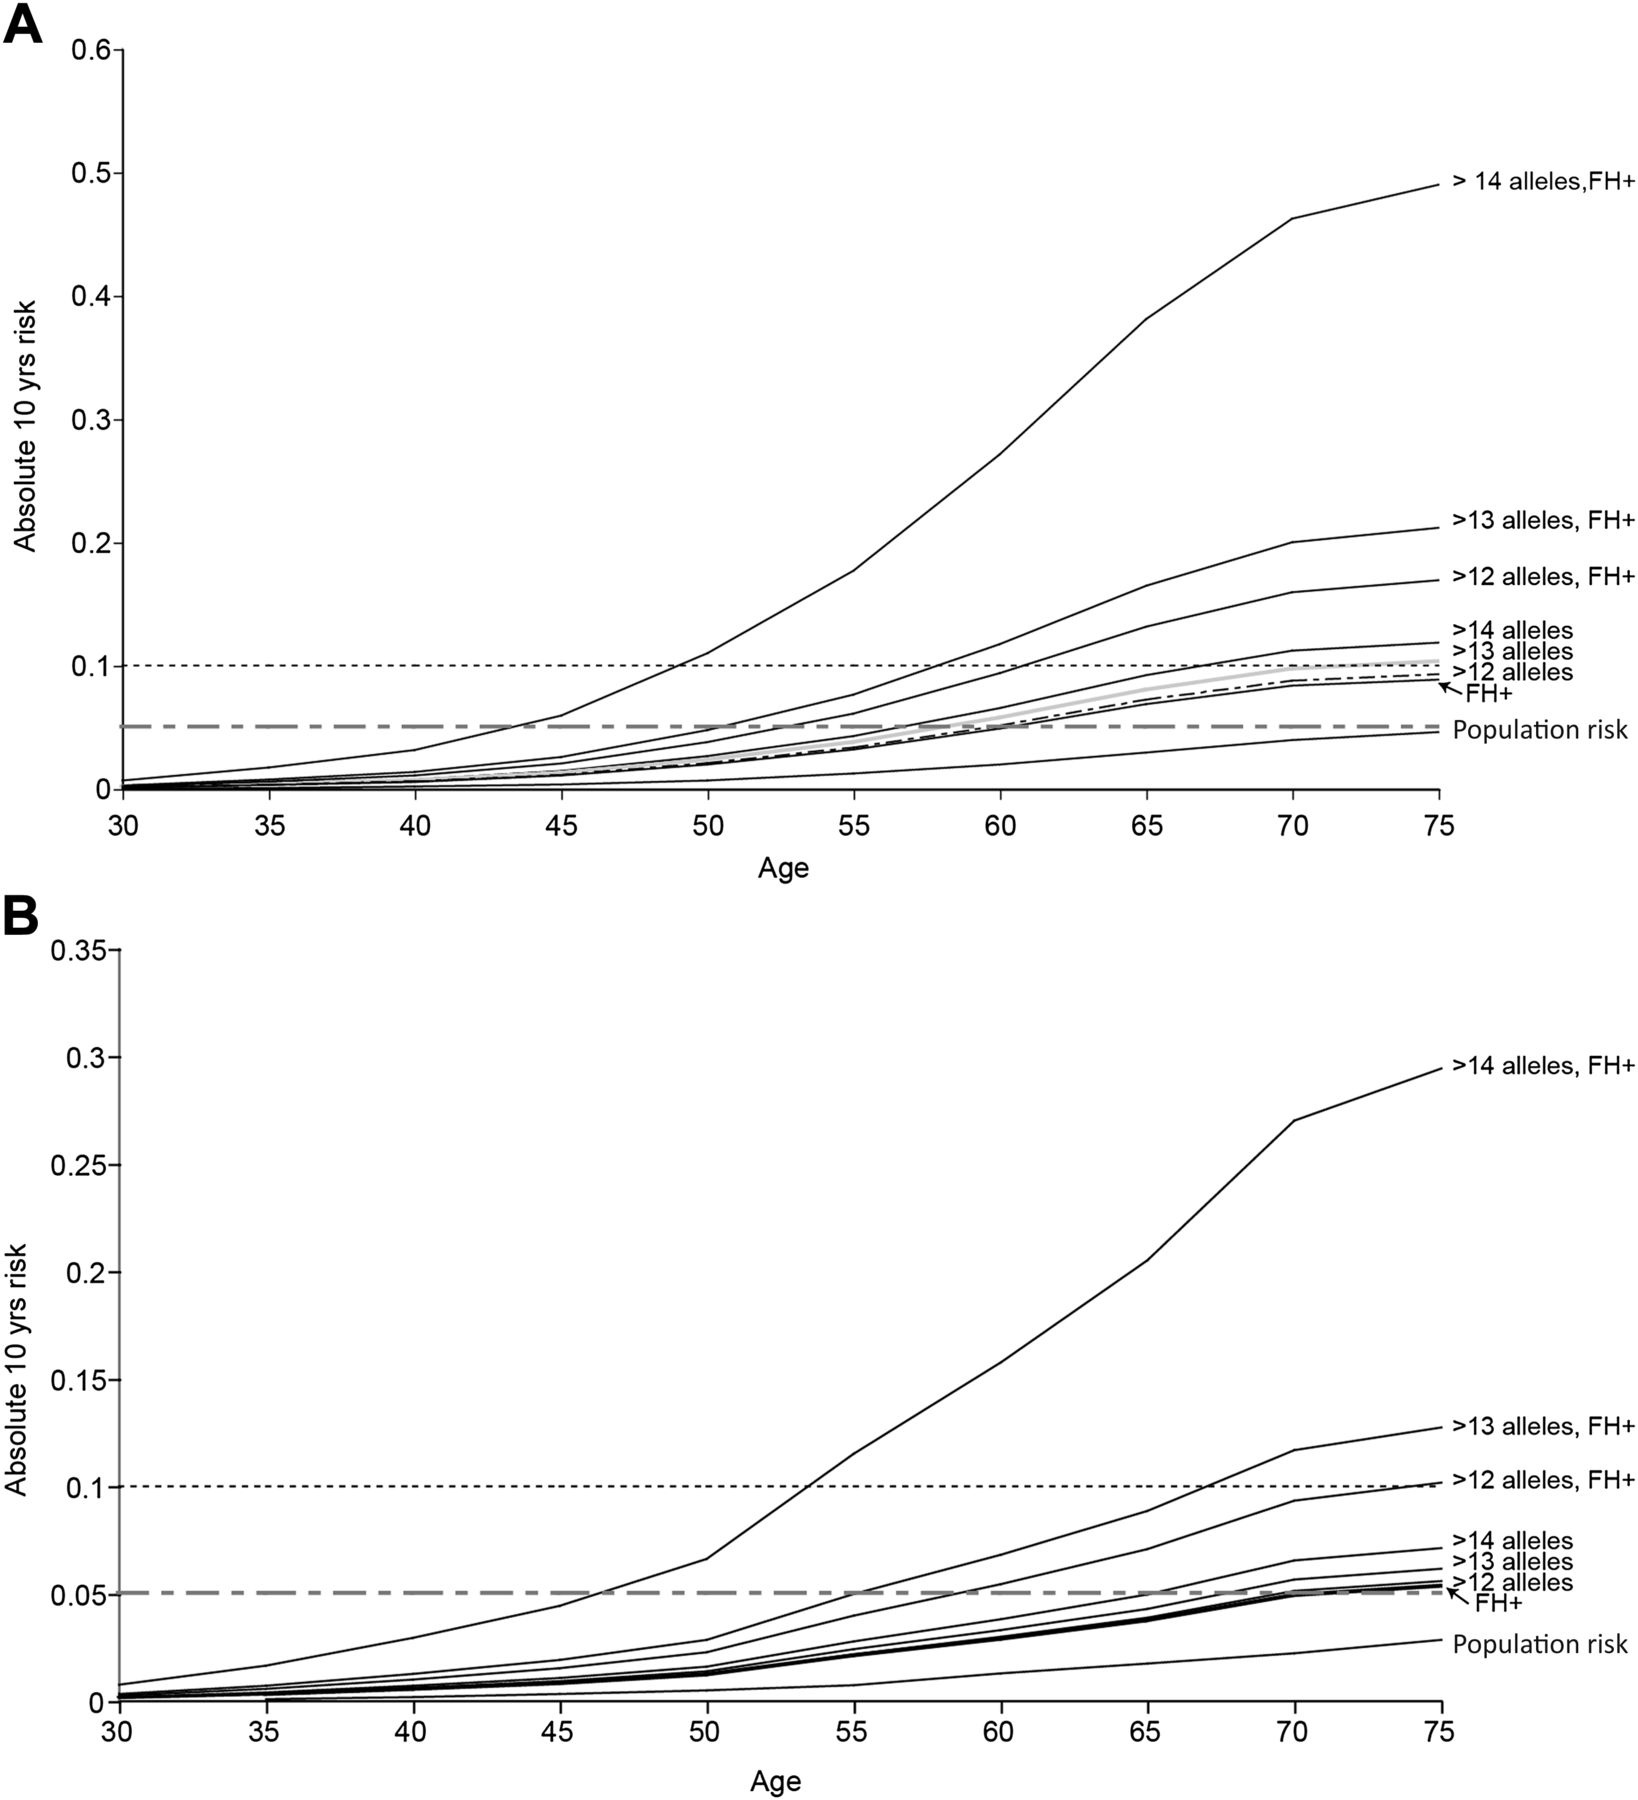
Having shown that risk prediction at the individual level is not feasible, using the Bayesian modelling approach described above we set out to gauge the potential public health impact of applying such risk models to the general population. We estimated the proportion of people in the general population that might be included within a high-risk category sufficient to merit more intensive large bowel surveillance or intervention. Taking account of allele frequency and effect size of various risk allele combinations, we incorporated SNP genotype, FH, age, gender and Scottish population data on the incidence of CRC by age and gender. We estimated the 10-year absolute CRC risk by age for men and women (separately) carrying >12, >13 or >14 risk alleles (figure 5). The risk associated with a positive FH that we observed in the Scottish dataset (OR 1.75, 95% CI 1.48 to 2.06) was similar to (though marginally lower than) that estimated in a recent meta-analysis.27 The frequency of control subjects reporting at least one affected first-degree relative (0.09) in the current population is very similar to that observed in a previous Scottish population-based series aged 30–70 years (0.094, 95% CI 5.8 to 14.9).28 We considered <5%, ≥5% and ≥10% predicted absolute risk subgroups. The 10-year absolute risk in the Scottish population approaches 5% only for men after the age of 75 years (figure 5, table 3). As expected, a positive FH is associated with increased risk, reaching the 5% threshold around age 70 years in women and 60 years in men. The estimated absolute risk for >12 risk alleles is very similar to that imparted by a positive FH (figure 5A,B). It should be noted that genotype for the 10 common variants provides information for risk prediction additional to that from FH alone (tables 3 and 4, figure 5). In FH+ individuals with >12 alleles, the age at which the 10-year risk surpasses the 5% and 10% thresholds is substantially lower than for FH+ alone (5% threshold: 52 vs 60 years in men, 58 vs 68 years in women; 10% threshold: 62 vs 75 years in men, 75 vs >80 years (not assessable) in women).
Estimated absolute 10-year risk of colorectal cancer. 10-year absolute risk for (A) cancer-free men and (B) cancer-free women within the general population carrying >12, >13 and >14 risk alleles using 2006 Scottish population estimates (1 310 552 men, 1 441 245 women aged ≥35 years) using a Bayesian risk modelling approach. The rationale for assessing risk associated with carriage of various numbers of alleles is based on population frequency of that number of alleles and the associated risk (see figure 1). Ten years is taken as the predicted risk period because it is reasonable to expect colonoscopy to influence stage of colorectal caner, mortality and/or incidence over that timescale. Cumulative probability is estimated from 1-exp(-cumulative rate) and the absolute risk in the next 10 years obtained by subtraction of the estimated cumulative risk up to the current age from the estimated cumulative risk for 10 years older than the current age. Risk is shown for men and women in each age group in the average risk population, subgroups with a positive family history and by genotype groups (note scale difference in plotting risks for men and women).
Available evidence suggests benefit for advancing the age of initial FOBT screening for people with a FH.29 Thus, offering genotyping for common variants in the general population subgroup with an affected relative (9%) could refine empirical FH guidance. Given the impact of age and gender on prior risk, it is important to take these risk factors into account when considering age at which to offer genetic testing. To gauge the practical and financial issues around population genetic testing, we extrapolate from figure 5. If genotyping for risk SNPs was targeted to men in the Scottish population aged ≥55 years with a positive FH, then only approximately 59 000 tests would be necessary. This would identify the estimated 6.7% of men (about 4000) with >12 risk alleles who have a 10-year absolute risk of CRC of >5%, and all of whom have a 10-year risk of CRC of >10% from age 60 years. Similarly, restricting genotyping to women aged ≥60 years with a positive FH would involve approximately 57 000 tests and this would identify an estimated 3800 women with a 10-year absolute risk of CRC of >5% (figure 5). In all, this approach would identify seven people per 100 of the tested population with a 10-year absolute CRC risk of ≥5%. It should be emphasised that this is a modelling exercise applied to population data, however robust the population data and genotyped sample sets. However, testing these models in practice will likely remain logistically and scientifically challenging for the foreseeable future. Nevertheless, this provides useful estimates to provide an insight into the number of people who might be offered genetic testing for SNP markers and who might be identified to be at sufficiently high risk to merit intensive screening.
Discussion
In this study we assessed the utility of CRC genetic risk profiling using a panel of 10 common genetic variants shown incontrovertibly to be associated with CRC susceptibility and combined this information with age, gender and FH information (as a proxy for genetic susceptibility factors yet to be discovered) in populations of predominantly northern European ancestry. We show clearly that genotype at common risk variants provides information over and above that of FH alone (table 4, figure 5). There is a small but highly statistically significant difference (p<2.2×10⁻¹⁶) in risk allele distribution between cases and controls. The level of statistical significance was due to the very large study size rather than the magnitude of the difference.
ROC analysis of models including genotype data alone or in combination age, gender and FH showed very modest discriminative performance across the risk spectrum (AUC ∼0.59 and 0.57 (internal validation) or 0.56 and 0.57 (external validation sets)). The overall positive predictive value was between 0.51 and 0.71 for cut-off points of 0.4 and 0.7, respectively, with negative predictive values for the same cut-offs of 0.62 and 0.51, respectively. This modest level of test performance was consistent across study populations, suggesting that risk assessment algorithms based on common genetic variants are likely to have similar performance characteristics in Caucasian populations and are unlikely to be confounded by linkage disequilibrium structure differences. Because of the populations we have tested, it should be noted that the observed AUC and lack of discriminative performance may not apply to other populations. However, we consider it unlikely that predictive performance would be appreciably better in populations of predominantly African or Asian ancestry.
The poor performance in individualised CRC risk profiling is consistent with risk prediction studies in other diseases.30–32 Typical AUCs range from 0.55 to 0.60 in type 2 diabetes,33–36 with slightly higher values for age-related macular degeneration, Crohn's disease, coronary heart disease and cardiovascular diseases.37–39 The best predictive performances have been obtained by combining genetic, demographic and environmental variables.40 The great majority of true susceptibility loci are not included in these analyses because they have yet to be discovered. Improved predictive performance (AUC >0.8) could probably be achieved by including SNPs from a much larger number of susceptibility loci.39 Consistent with this, we previously estimated that a model with about 100 of the estimated 172 SNPs accounting for the genetic variance for CRC could provide 80% accuracy of prediction of the genetic component of risk and explain about 17% of the phenotypic variance in the liability scale.26
AUC generated by ROC analysis represents the probability that cases have a higher score than controls. While this is important for a diagnostic test, it only gives a limited assessment of the potential value of a predictive test where the main aim is categorisation into clinically meaningful risk strata.32 AUC does not address absolute levels of risk or whether the model stratifies correctly into high/low categories of absolute risk that are of clinical importance (such as 10-year risk of CRC). We maintain that, in the context of this study, prediction of actual risk is a more important model function than sensitivity/specificity on which ROC curve and AUC estimates are based.41
Additional common CRC genetic risk variants identified through ongoing research efforts are likely to have effect sizes even smaller and/or allele frequencies lower than those identified to date.10–12 ,17 Nonetheless, predictive utility of testing for common genetic variants is likely to improve with new discoveries and individualised CRC genetic risk profiling may become feasible. The combined performance of genetic variants and other established (non-genetic) risk may vary depending on the nature of the genetic variants incorporated into the model.32 These may have a greater impact on risk prediction if they involve novel disease pathways independent of the causal mechanisms through which the other risk factors operate,31 as is likely in this study since a number of the variants involve the transforming growth factor β signalling pathway.26
Application of the predictive model developed here using observed genotype and other risk factor data allows estimation of the likely effect in a population setting. It also provides some insight into the feasibility and likely outcomes of applying such a model in practice. The modelling suggests that it may be possible to identify population subgroups with substantially elevated 10-year absolute risk of CRC. The approach could identify the approximately 7% of the tested population with sufficiently high risk as to warrant additional screening, such as regular colonoscopic surveillance and/or age advancement of recruitment to population screening programmes.29 So et al 42 also recently developed a statistical framework incorporating genotype, FH and other risk factor data for prediction of breast and prostate cancer. Their findings support the notion that such modelling can stratify the population into risk categories, opening up the potential for targeted prevention and screening. Models incorporating genotype data from common variants will not identify rare high penetrance alleles (eg, those responsible for Lynch syndrome); validated risk prediction models have been developed to identify such individuals.43
Genotyping the population with a FH of CRC is an attractive approach. A 5% threshold of absolute 10-year CRC risk has clinical and public health validity since it exceeds the highest risk at any age in the general population and is tenfold greater than the risk for a 50-year-old person (table 3) entering population-based FOBT screening programmes. It should be noted that these findings are focused on identifying population subgroups with excess risk that merit additional screening. We have not addressed the issue of a reduction in screening for those predicted to be at lower risk. In this study we have explored risk model performance across a range of European populations in order to reduce potential bias due to limited representativeness. Although we validated these findings in an external validation set, model performance should be tested in a large long-term cohort study in which the genetic variants can be studied together with classical risk factors to give reassurance that model performance is not inflated due to selection, information or survival biases.
These findings have implications for current FOBT screening programmes. Brenner argues that risk associated with a FH logically dictates that individuals with a positive FH should enter screening programmes approximately 10 years earlier than those without.29 While there are a number of issues that need to be addressed to translate any genetic test into clinical and public health practice, the results of the modelling presented here suggest that it is possible to identify population subgroups with substantially increased CRC risk. Indeed, the risk is sufficiently high as to merit changes to screening policy for the groups in that risk category. Furthermore, amendments to criteria for age of entry to FH-focused surveillance programmes6 ,44 merit evaluation. This study provides the first tangible indication that data from genome-wide studies of CRC have public health importance.
References
Footnotes
-
MGD and AT are joint first authors. HC, IT and RSH are joint last authors.
-
Funding Edinburgh: Work was supported by grants from Cancer Research UK (C348/A12076 and the Bobby Moore Fund), Scottish Government Chief Scientist Office (K/OPR/2/2/D333, CZB/4/94), Medical Research Council (G0000657-53203), Centre Grant from CORE as part of the Digestive Cancer Campaign (http://www.corecharity.org.uk). Cambridge: SEARCH is funded by a program grant from Cancer Research UK. TK was funded by the Foundation Dr Henri Dubois-Ferriere Dinu Lipatti. Kiel/Greifswald: Supported by the German National Genome Research Network (NGFN) through the PopGen biobank (BmBF 01GR0468) and the National Genotyping Platform. Further support through the MediGrid and services@medigrid projects (01AK803G, 01IG07015B). SHIP is part of the Community Medicine Research net (CMR) of the University of Greifswald, Germany, which is funded by the Federal Ministry of Education and Research (ZZ9603), the Ministry of Cultural Affairs as well as the Social Ministry of the Federal State of Mecklenburg-West Pomerania. Heidelberg: Support from German Research Council (Deutsche Forschungsgemeinschaft) (BR 1704/6-1, BR 1704/6-3, CH 117/1-1) and the German Federal Ministry for Education and Research (01 KH 0404). Sweden: Financial support was provided through the regional agreement on medical training and clinical research (ALF) between Stockholm County Council and the Karolinska Institute, The Swedish Cancer Society, The Stockholm Cancer Foundation and The Swedish Research Council. Colon-CFR: Grant support NIH/NCI U01CA122839. Spain: Supported by grants from Fondo de Investigación Sanitaria/FEDER (06/1384, 06/1712, 08/0024, 08/1276), Xunta de Galicia (PGIDIT07PXIB9101209PR), Fundación de Investigación Médica Mutua Madrileña (CRP and SCB), Ministerio de Educación y Ciencia (SAF 07-64873), Asociación Española contra el Cáncer (Fundación Científica and Junta de Barcelona), Fundación Olga Torres (SCB) and Acción Transversal de Cáncer (Instituto de Salud Carlos III). CIBERER and CIBEREHD are funded by the Instituto de Salud Carlos III. SCB is supported by a contract from the Fondo de Investigación Sanitaria (CP 03-0070). We acknowledge the Santiago de Compostela and Barcelona branches of the Spanish National Genotyping Centre (CeGen) for genotyping. Finland: Grant support from Academy of Finland (Finnish Centre of Excellence Program 2006-2011), the Finnish Cancer Society, the Sigrid Juselius Foundation and the European Commission (9LSHG-CT-2004-512142). Canada: Cancer Care Ontario (host organisation to the ARCTIC Genome Project) acknowledges project funding by Genome Canada through the Ontario Genomics Institute, by Génome Québec, the Ministere du Dévelopement Économique et Régional et de la Recherche du Québec and the Ontario Institute for Cancer Research. Additional funding from National Cancer Institute of Canada (NCIC) through the Cancer Risk Assessment (CaRE) Program Project Grant. The work was supported through collaboration and cooperative agreements with the Colon Cancer Family Registry and PIs, supported by the National Cancer Institute, National Institutes of Health under RFA CA-95-011, including the Ontario Registry for Studies of Familial CRC (U01 CA076783). TJH and BWZ hold Senior Investigator Awards from the Ontario Institute for Cancer Research through generous support from the Ontario Ministry of Research and Innovation. Oxford: The work was supported by Cancer Research UK and the Bobby Moore Fund (C1298/A8362). Additional funding provided by the European Union (CPRB LSHC-CT-2004-503465), and CORE (http://www.corecharity.org.uk). IT is supported by the Oxford Biomedical Research Centre. The work was also supported by the Oxford Biomedical Research Centre and funded by the Medical Research Council. ICR, London: Grant support from Bobby Moore Cancer Cancer Research UK (C1298/A8362), CORE and the European Commission (QLG2-CT-2001-01861). SL was in receipt of a PhD studentship from Cancer Research UK and IC a Clinical Training Fellowship from St. George's Hospital.
-
Competing interests All authors, and the corresponding author on their behalf, declare that they have no competing interests and the corresponding author acts as guarantor for all authors.
-
Ethics approval Ethics approval was provided by all relevant ethics research committees and IRBs.
-
Provenance and peer review Not commissioned; internally peer reviewed.
-
Data sharing statement Summary data will be made available on request. Individual level data may be shared on a collaborative basis but measures will be taken to protect research subject identity over and above conventional anonymisation.