Article Text

Abstract
Objectives The postinfectious irritable bowel syndrome (PI-IBS) suggests that impaired resolution of inflammation could cause IBS symptoms. The authors hypothesised that polymorphisms in genes whose expression were altered by gastroenteritis might be linked to IBS with diarrhoea (IBS-D) which closely resembles PI-IBS.
Design Part 1: 25 healthy volunteers (HVs), 21 patients 6 months after Campylobacter jejuni infection, 37 IBS-D and 19 IBS with constipation (IBS-C) underwent rectal biopsy for gene expression analysis and peripheral blood mononuclear cell cytokine production assessment. Part 2: Polymorphisms in genes whose expression was altered in Part 1 were assessed in 179 HV, 179 IBS-D, 122 IBS-C and 41 PI-IBS.
Results Part 1: Mucosal expression of seven genes was altered in IBS: CCL11, CCL13, Calpain 8 and TNFSF15 increased while NR1D1, GPR161 and GABRE decreased with similar patterns after infection with C jejuni. Part 2: The authors assessed 21 known single nucleotide polymorphisms (SNPs) in these seven genes and one SNP in each of the TNFα and IL-10 genes. Three out of five TNFSF15 SNPs (rs6478108, rs6478109 and rs7848647) showed reduced minor allele frequency (MAF) (0.28, 0.27 and 0.27) in subjects with IBS-D compared with HV (0.38, 0.36 and 0.37; p=0.007, 0.015 and 0.007, respectively) confirming others recent findings. The authors also replicated the previously reported association of the TNFα SNP rs1800629 with PI-IBS which showed an increase in the MAF at 0.30 versus 0.19 for HV (p=0.04).
Conclusion IBS-D and PI-IBS patients are associated with TNFSF15 and TNFα genetic polymorphisms which also predispose to Crohn's disease suggesting possible common underlying pathogenesis.
- Inflammatory bowel syndrome
- genetics
- gluten
- coeliac disease
- functional bowel disorder
- diverticular disease
- serotonin
- gastrointestinal motility
- neurogastroenterology
Statistics from Altmetric.com
- Inflammatory bowel syndrome
- genetics
- gluten
- coeliac disease
- functional bowel disorder
- diverticular disease
- serotonin
- gastrointestinal motility
- neurogastroenterology
Significance of this study
What is already known on this subject?
-
Irritable bowel syndrome (IBS) shows a familial tendency.
-
One in five of IBS begins with an acute gastroenteritis.
-
Most genetic studies have been inconclusive but TNFSF15 polymorphisms have recently been associated with IBS.
What are the new findings?
-
Mucosal expression of CCL11, CCL13, TNFSF15 and Calpain 8 was increased while NR1D1, GPR161 and GABRE was decreased in irritable bowel syndrome (IBS).
-
Similar patterns were seen after infection with Campylobacter jejuni.
-
Polymorphisms in TNFSF15, previously linked to Crohn's disease, were associated with IBS with diarrhoea.
-
Polymorphisms in TNFα were also associated with postinfective IBS.
How might it impact on clinical practice in the foreseeable future?
-
This confirms a genetic tendency to a pro-inflammatory state in irritable bowel syndrome and encourages the search for biomarkers to direct the use of anti-inflammatory treatments.
Background
Substantial advances in our understanding of the genetic component of complex diseases such as Crohn's and rheumatoid arthritis have been made recently through genome-wide association studies. These studies, which use many thousands of subjects, have indicated that complex disorders are due to an interaction between environmental factors and genetic polymorphisms, with each individual polymorphism contributing a small effect.1 A recent publication showed more than 30 distinct susceptibility loci for Crohn's disease2 with ORs ranging from 1.08 to 3.99, with a median of 1.2. When compared with Crohn's disease, irritable bowel syndrome (IBS) is less well defined, making genetic analysis more difficult. While Crohn's disease is diagnosed on the basis of imaging, histology and blood tests, IBS at present is diagnosed on symptoms and negative tests excluding other diseases. IBS is heterogeneous, being subtyped according to the predominant bowel habit3 (diarrhoea, constipation or mixed) of which IBS with diarrhoea (IBS-D) accounts for about a third. Like Crohn's disease, IBS does show a degree of heritability4 and clustering of IBS has been documented in families.4–6 Twin studies have yielded variable results, but suggest that a proportion of the variation in IBS is due to genetic factors, though social learning is probably at least as important.6
Several earlier studies from the Mayo clinic have examined gene expression in IBS colonic biopsies. A study focusing on serotonin transporter and receptors using RT-PCR had shown increased expression of p11, also known as S100A10, which is a calcium binding protein involved in neural signal transduction.7 A subsequent study using a microarray has shown a molecular signature which was stable over time and distinguished IBS from healthy controls. The genes which were differentially expressed suggested changes in the host mucosal immune response to microbial pathogens.8 The most recent study from this group showed a link between genetic tendency to inflammation and colonic transit suggesting that these genetic polymorphisms do have a functional effect.9
It seems highly likely therefore that IBS develops in a genetically susceptible individual reared in a particular environment who is subsequently exposed to an environmental stressor. We have been particularly interested in one set of environmental stressors, namely, infectious gastroenteritis, which is followed by the development of IBS in up to one in 10 individuals.10
Given the similarity between postinfectious IBS (PI-IBS) and IBS-D,11 our hypothesis was that IBS-D would be characterised by a genetic tendency to overreact to infectious or inflammatory insults and to show persistent immune activation as demonstrated by numerous recent studies.12–15
We therefore performed a study in two parts. Part 1 which included 102 subjects assessed gene expression in the rectal mucosa both 6 months after Campylobacter jejuni infection and in chronic IBS compared with healthy volunteers (HVs). We also examined in these 102 subjects relevant cytokine production by peripheral blood mononuclear cells (PBMCs) which others have shown to be increased in IBS.16–18 Part 2 was a study of genetic polymorphisms of the genes identified in Part 1 controlling mucosa factors and PBMC cytokine production which had been shown to be abnormal after infectious gastroenteritis and in IBS. This involved recruiting a total of 342 IBS patients and 179 HVs, 102 from Part 1. We were able to assess the functional effect of these polymorphisms by linking them to rectal biopsy mRNA.
Subjects and methods
Part 1: identification of candidate genes
There were four subject groups: (1) 25 HVs without significant gastrointestinal complaints as judged by their response to the bowel symptom questionnaire;19 (2) 21 subjects who had had C jejuni infection 6 months previously; (3) 37 patients meeting Rome II criteria for IBS-D; and (4) 19 patients meeting Rome II criteria for IBS with constipation (IBS-C). Those agreeing to take part completed a Talley IBS symptom questionnaire19 modified to include bowel frequency and days with pain, days with loose and days with hard stool. IBS was diagnosed according to the Rome II criteria. All taking part completed the Hospital Anxiety and Depression Scale20 and the Patient Health Questionnaire 12 Somatic Symptom Scale (PHQ12SSS).21 Those with IBS also completed the IBS Symptom Severity Score Questionnaire and the IBS quality of life questionnaire.22 Subjects also underwent rectal biopsy and gave blood samples for assessment of PBMC cytokine production.
Recruitment
Group 1 (HV)
HVs were recruited via posters within the University campus and hospital.
Group 2 post-C jejuni infection
All patients submitting a stool sample to the Public Health Laboratory which grew C jejuni were sent a questionnaire giving details of the episode of gastroenteritis and their previous bowel habit. Six months later, they were sent a further bowel questionnaire to establish whether they had persistent bowel dysfunction or had recovered fully.
Group 3 (IBS-D) and Group 4 (IBS-C)
The majority of patients with IBS-D and IBS-C had already completed a full negative evaluation for other diseases in the Nottingham University Hospital NHS Trust gastroenterology outpatient clinic. The evaluation included a detailed history, examination, sigmoidoscopy and biopsy, full blood count, haematinics, electrolytes, antiendomysial antibody, thyroid function, calcium, liver function tests and where relevant colonoscopy, barium follow-through, bile salt retention testing (Selenium75 Homocholic Acid Taurine) and duodenal biopsy. Patients with a positive lactose tolerance test whose symptoms responded to a lactose-free diet were excluded. All patients provided written and informed consent and patient studies were approved by the Nottingham University Hospitals NHS Trust Research Ethics Committee and the HV studies by the University of Nottingham Medical School Research Ethics Committee.
Inclusion/exclusion criteria
All subjects, regardless of source, underwent a screening medical examination including a general physical examination and a screening full blood count, serum calcium, endomysial antibodies and C reactive protein to exclude underlying disease, particularly coeliac disease. In the course of the study, two patients with unidentified coeliac disease and one with microscopic colitis were identified and excluded. Other exclusion criteria were pregnancy, significant concomitant illness, bleeding or clotting disorders, gastrointestinal surgery (other than appendectomy or cholecystectomy), history of alcohol or drug dependence, and any medication that might alter gastrointestinal motility or permeability (especially aspirin and non-steroidal anti-inflammatory drugs). We also excluded HVs who had IBS symptoms or who had gastroenteritis within the previous 6 months. All patients were required to be of Caucasian origin to simplify subsequent genetic analysis.
Rectal biopsy
Subjects underwent sigmoidoscopy without bowel preparation. Biopsies were obtained using endoscopic biopsy forceps (FB-13K-1, Olympus, Japan). One was positioned on filter paper, fixed in formalin and then embedded in paraffin wax with orientation optimised using a dissecting microscope to ensure sections were perpendicular to the mucosa. A single expert pathologist (AZ) undertook a conventional histological assessment on H&E sections using standard published criteria.23 Two biopsies were immersed in RNALater to inactivate degrading enzymes and mRNA extracted for analysis of gene expression using RT-PCR. Details of RNA extraction and microarray processing and TaqMan real-time PCR are provided in supplementary file 1.
Intestinal permeability and urine collection
After an overnight fast, subjects emptied their bladders and consumed 1.8MBq of 51Cr-EDTA (Amersham International, Amersham, UK) in 50 ml of water followed by 200 ml (150 kcal) of a nutritional supplement (Fortisip, Nutricia, Liverpool, UK). Eating or drinking was not allowed for the next 3 h. Food was permissible after 5 h. Urine was collected in three containers with 0.5 ml 20% chlorhexidine for time periods 0–3 h, 3–6 h and 6–24 h. The time periods approximate to permeability within the upper small intestine, lower small intestine and large intestine. Alcohol and non-steroidal anti-inflammatory drugs were prohibited 1 week prior to and during the test. Volumes of urine were recorded and 1 ml aliquots were counted for radioactivity by a γ scintillation counter (LKB Wallac 1282 Compugamma universal γ counter, Virginia, USA). Results were expressed as the per cent urinary excretion of the orally administered dose of 51Cr-EDTA. There was negligible background radiation, as measured by radiation in the absence of 51Cr-EDTA. Our normal range is 0–6 h 0.3%±0.1 mean±SD (ULN=0.51%), 1.2±0.3 0–24 h (ULN=1.8%). Reproducibility of repeated measures is 7.5%.
PBMC isolation and incubation
PBMCs were prepared using Histopaque®-1077 (Sigma, Poole, UK) density gradient centrifugation and diluted to obtain a cell density of 1×10⁶ cells per ml. Cell suspensions were incubated in RPMI medium (Gibco, UK) and incubated at 37°C in 5% CO2 for 24 h and then stored at −80°C.
PBMC cytokine assay
Cytokine production by PBMC was analysed in supernatants of cells cultured for 24 h at 37°C, 5% CO2 using Cytometric Bead Array (CBA, BD Biosciences, San Diego, California, USA). Tumour necrosis factor (TNF)α and interleukin (IL)-10 were detected using Human Th1/Th2 Cytokine CBA Kit, and IL-1β was detected using the Human Inflammation CBA Kit. Tests were performed according to the manufacturer's instructions. Briefly, 50 μl of supernatants were mixed with 50 μl of PE-conjugated cytokine capture beads. After 3 h of incubation, samples were rinsed, fixed with 1% paraformaldehyde and analysed by flow cytometry (FACScalibur, BD CBA Analysis Software; BD Biosciences). The results were expressed as picogram/millilitre (pg/ml). The limits of detection were as follows: 2.8 pg/ml IL-10 and TNFα, 7.2 pg/ml IL-1β, 2.5 pg/ml.
Microarray analysis
Two microarray studies investigated the gene expression changes in rectal biopsies from donors with IBS compared with HVs (microarray study 1) and how IBS relates to bacterial infection (microarray study 2). Microarray study 1: 18 IBS-C subjects and 27 IBS-D subjects were compared with 21 HV. Microarray study 2: 21 C jejuni infection (PIBD + PINIBS) subjects were compared with 19 HVs. Eighteen genes were prioritised from the microarray analysis whose expression differed significantly between the various patient and control groups (fold difference >1.2 and p<0.002) were followed up by TaqMan real-time PCR analysis. These were in alphabetical order AGTR1, ARHGEF7, CAPN8, CCL11, CCL13, GABRE, GOLGA8A, GPR161, HLA-DQA1, HLA-DQB1, HLF, NR1D1, S100A10, SFXN2, SLC9A3, SST, TEF, TNFSF15 (for technical details see supplementary file).
TaqMan real-time PCR data analysis
The geometric mean of calculated abundance levels were calculated for replicate biopsies thus giving one abundance measure per subject. These data have been normalised using all housekeeper genes to correct for loading; some of these housekeepers were chosen as invariant genes from microarray analysis (ACTB, ARPC2, BTG2, CCT4, GAPDH, PPIA, SCARB2, ZDHHC14) (primer sequences in table 1 in supplementary file).
Part 2: testing the association of IBS with candidate gene polymorphisms
We recruited an additional 142 IBS-D, 103 IBS-C and 154 HVs to give a total of 179 IBS-D and 179 HVs together with 122 (IBS-C) and 41 patients with a history of PI-IBS. Recruitment was as for Part 1. All patients met the Rome II criteria for IBS and all completed the Talley IBS symptom questionnaire modified to include bowel frequency, days with pain and days with both loose and hard stool. Patients underwent venepuncture to provide blood samples for DNA analysis and whole blood mRNA, which was preserved in specifically designed PAXgene Blood RNA System tubes and measured as previously described.24
The candidate genes were derived from those we found to be overexpressed in IBS or postinfection in Part 1 and also chosen from existing literature on cytokine polymorphisms which have been linked to IBS including TNFα and IL-10.25 ,26 The single nucleotide polymorphisms (SNPs) used for the genes chosen from Part 1 were chosen with a cut-off of minor allele frequency (MAF) >10%. Most of the SNPs were chosen in areas 5′ to the genes, as this was thought more likely to tag potential regulatory regions. Using the SNP tagger program within Haploview 4.2 in a region ±10 kb of the gene, we selected SNPs which tagged the haplotype blocks of interest. Some were chosen on the basis of known functional effects or associations with disease. The SNPs in TNFSF15 were chosen because of previous links to IBD27–29 and/or known functional effects.30 The SNPs in CCL11 were chosen because of their known links to asthma and atopic dermatitis,31 while those in CCL13 were chosen because of links to multiple sclerosis.32 Little is known of the functional effects of NRDI SNPs but rs12939700 has been linked to thyroid disease33 while rs2071427 is linked to response to lithium.34 There is one non-synonymous SNP in GABRE but with no known functional effect while GPR161 is a gene of unknown function. Likewise, there are no data on SNPs in the Calpain 8 gene in the NCBI SNP database and so we did not examine any SNPs in these last three genes.
DNA was extracted from 200 μl of each blood sample using the QIAamp DNA Blood Mini Kit (Qiagen Cat. No. 51106) and then genotyped by KBiosciences (Hoddesdon, UK) using Taqman methodology for allelic discrimination. All genotyping was performed blinded to clinical status. The genotyping call rate was over 98% for all 21 polymorphisms. Two were highly significantly not in Hardy Weinberg equilibrium and thus excluded from further analyses. Genetic associations were assessed both with the genotype and the number of minor alleles at each locus using statistical significance for heterogeneity of outcome by genotype (χ2 test) and for heterogeneity of MAF across outcome categories (χ2 test of allele counts).
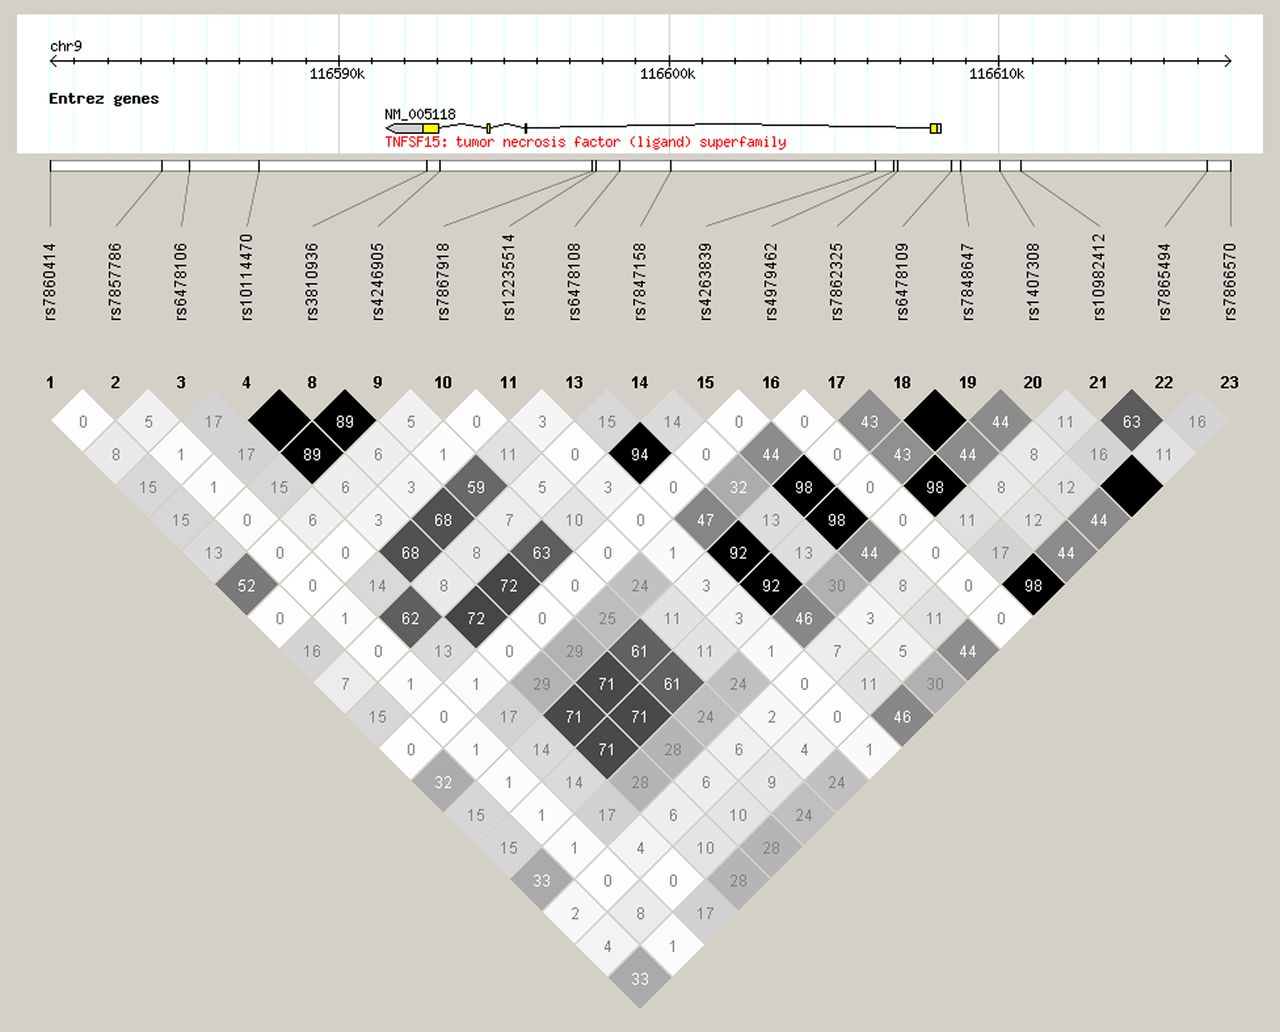
The region surrounding the TNFSF15 gene was studied for linkage polymorphisms in the Northern European population using Haploview 4.2, V.3, release R2 (figure 2) to test whether the three TNFSF15 polymorphisms significantly associated with D-IBS should be considered as truly independent variables.
Statistical analysis
Age, PHQ15 and permeability were normally distributed and are expressed in the text as mean±SEM. Other parameters which were not normally distributed are expressed as median (range) or where there were obvious outliers, median (IQR). Age and PHQ15 values were assessed using analysis of variance (ANOVA) followed by Dunnett's post hoc tests. The non-parametric data were assessed using the Kruskal–Wallis ANOVA followed by Mann–Whitney U test. p Values significant after the Bonferroni correction for multiple comparisons are indicated by an asterisk in tables 2 and 3.
The mRNA results were expressed as log2 to produce a normally distributed variable. Taqman results were analysed using an ANOVA model followed by post hoc comparison tests. For each probe set a linear model was fitted that included terms for disease group and gender. This analysis included a covariate to account for any change in expression due to the RNA loading of the samples. This covariate was represented by the scores from the first principal component obtained from a PCA of the housekeeper genes and ‘non-changers’ identified from microarray analysis.35 This analysis was conducted in Array Studio (V.3.6). Probe sets were deemed as statistically significant if the resulting p value from the post hoc test was <5% (0.05).
Power considerations
Study 1
Microarray studies are typically limited by expense and are hypothesis generating rather than hypothesis testing experiments. The array study was designed to provide candidate genes to test in study 2. Our n value per group, 19–37, is larger than most previous studies. The model used to obtain significant differential expression included terms for disease, gender, batch and disease by gender interaction. Results were filtered to exclude lowly expressed probe sets. Those with fold change >1.2 and p<0.05 were considered significant.
Study 2 (genetics study)
This study was designed to test candidate genes which were identified after the study had been completed and so could not be powered a priori. Our numbers were therefore based on the earlier study showing the MAF of high producing TNFα SNP of 41% in IBS compared with 26% in controls.25 Detecting such a difference would require 150 cases per group for an 80% power. In the event we slightly over-recruited for IBS-D achieving 179 per group. We were significantly underpowered for PI-IBS with only 41 cases and so little can be inferred from negative associations in this group.
Results
Part 1: identifying candidate genes
Demographics and bowel habits
There was no significant difference in male to female ratio between the HVs and the IBS patients; however, the post-C jejuni infected group were slightly older than the volunteers (table 1). As expected, IBS-D patients had significantly more bowel movements per day and significantly more days per week with loose stool than the HVs. Those studied 6 months after infection had more days per week with loose stool but there was no difference in the number of days with hard stool which were infrequent in all groups except the IBS-C patients. As expected, there were significant differences in somatisation as well as anxiety and depression which were significantly higher in both IBS-D and IBS-C than HV.
Demographics and bowel habits of four study groups in Part 1
Gene expression as assessed by TaqMan real-time PCR after Campylobacter infection
Gene expression as assessed by TaqMan real-time PCR for HV versus all IBS
Gene expression in rectal biopsies by TaqMan real-time PCR
All biopsies were classified as normal using conventional criteria. Compared with 25 HVs, those infected 6 months previously with C jejuni showed significant increases in expression of the pro-inflammatory genes CCL11, CCL13, Calpain 8 and GABRE and significant decreases in NR1D1 and GPR161 after Bonferroni correction for seven comparisons (table 2). There were no significant differences between IBS-D and IBS-C and so they are considered together in table 3. CCL13, GABRE, TNFSF15 and Calpain 8 mRNA were all significantly increased (fold changes 1.5–1.3) while GPR161 and NR1D1 were significantly decreased (fold changes 1.2–1.4) after Bonferroni correction for seven comparisons. The overall pattern was similar to that seen after gastrointestinal infection. The other 11 genes identified on the microarray did not show significant differences between IBS and HV in the Taqman assays (data not shown). We specifically looked at mucosal expression of mRNA for other cytokines which previous work had suggested might differ, including IL-10, TNFα and IL-1β. There were no significant differences in any of the IBS groups from HVs for these cytokines, Kruskal–Wallis, p=0.17, 0.57 and 0.59, respectively.
PBMC cytokine expression
PBMC TNFα production was significantly increased 6 months after Campylobacter enteritis. IL-10 and IL-1β production were also higher but these differences failed to reach statistical significance owing to several unexplained high outliers in the control HV group. Significant increases were seen in PBMC IL-10 production in IBS-D (table 4). If three outliers with values >2 SDs from the mean are excluded then both TNFα and IL-10 differences from HV were significant; p<0.05 for all three patient groups.
PBMC cytokine production (median (range)) in healthy volunteer (HV), subjects 6 months post-Campylobacter jejuni infection and patients with IBS-D and IBS-C
Intestinal permeability
There was a small but significant increase in Cr51 EDTA excretion 3–6 h at 6 months post-C jejuni infection compared with controls (table 4). While the permeability in IBS-D 3–6 h was numerically higher, the difference from controls was not significant or for IBS-C. The 0–3 h and 6–24 h samples showed no significant differences between groups. There was no correlation between PBMC cytokine production and small or large bowel permeability.
Part 2: testing candidate genes
Participant demographics
In accordance with the definition, IBS-D had significantly more loose stool and more bowel movements per day while IBS-C had significantly more hard stool and fewer bowel movements per day (table 5). PI-IBS had significantly more days with both loose and hard stool though loose stool predominated. IBS-D patients were significantly older than our volunteers but none of the variables measured correlated with age.
Subject demographics and bowel habit in part 2
Association of IBS subtypes with genes with altered expression in IBS
Given our findings in Part 1 of increased mucosal expression of CCL11, CCL13, TNFSF15 and Calpain 8 with decreased expression of NR1D1, GPR161 and GABRE in both IBS-D and IBS-C and increase in PBMC TNFα, IL-10 and IL-1, we tested known polymorphisms in these genes as listed in table 6. Three of the five polymorphisms within the TNFSF15 gene tested were significantly different in IBS-D patients compared with HVs with a reduced incidence of the MAF for all three SNPs (table 6). This difference from controls was not seen in IBS-C or PI-IBS. None of the polymorphisms in the chemokine eotaxin (CCL11) or monocyte chemoattractant protein-4 genes (CCL13) or NR1D1 showed significant differences in any of the IBS subgroups compared with HVs.
Prevalence of polymorphisms for genes whose expression increased after Campylobacter jejuni infection and in IBS, in HVs compared with PI-IBS, IBS-D and IBS-C
We found an association with PI-IBS of the TNFα polymorphism rs1800629 minor allele (table 6). We did not find any association of IBS with polymorphisms of IL-10 (rs1800896 and rs1800872) or with the IL-1β polymorphisms (rs1143627 and rs1143634).
Genotype–phenotype correlation
TNFSF15 polymorphisms
The relationship between TNFSF15 polymorphisms and the TNFSF15 gene expression as assessed by mRNA in rectal biopsies is shown in figure 1 and table 7. As can be seen, there was a linear trend for the C allele to be associated with a lower TNFSF15 expression (p=0.05) (figure 1). Similarly, there was a non-significant trend with rs6478109 and rs7848647 which also showed increased TNFSF15 mRNA in those homozygous for the Crohn's and IBS-D risk alleles (G & C, respectively) (table 7). However, the small numbers of the homozygous low risk allele means that these findings need replication to be sure they are real effects. We found no difference in PBMC TNFα production between the TNFα polymorphisms (rs 1800629). Likewise, we found no effect of the polymorphisms on cytokine mRNA in whole blood (data not shown).

Relationship between rectal biopsy TNFSF15 mRNA normalised abundance and TNFSF15 single nucleotide polymorphism rs6478108 genotype.
Diagram of linkage disequilibrium over the region of TNFSF15 gene on chromosome 9 from 116580k to 116620k generated using Haploview 4.2, V.3, release R2 using Utah residents with Northern and Western European ancestry from the CEPH (Centre d'Etude du Polymorphisme Humain) collection (CEU). Black boxed rs numbers show position of single nucleotide polymorphisms (SNPs) geneotyped in this study. Grey boxes show SNPs studied by Zucchelli et al (2011).38
TNFSF15 polymorphisms and TNFSF15 mRNA in rectal biopsies
Assessing the link between genotype and bowel habits of all except those with recent Campylobacter infection, we found those homozygous for the risk allele T for rs 6478108 had a greater number of days per week with loose stool 2.3±0.2 days/week versus 1.8±0.2 (p=0.05, n=452) for heterozygotes or C homozygotes. There was however no difference in the number of bowel movements per day which was 2.0±0.2 versus 2.0±0.1 bowel movements per day. As expected from the linkage disequilibrium rs6478109 showed a similar pattern, with homozygotes GG having 2.3±0.2 versus 1.8±0.2 days per week with loose bowel movements for GA and AA genotypes, though this difference did not reach the conventional significance level (p=0.07, n=453). Again, there was no difference in the average number of bowel movements per day.
Discussion
While IBS shows a familial tendency, previous studies have failed to consistently identify genetic differences between IBS and controls. This is undoubtedly due in part to the heterogeneity of IBS and the lack of power in many studies. Genetic tendencies can often be more clearly identified by studying gene–environment interactions. Our previous observations on the development of IBS after C jejuni infection and the association with persistent lymphocyte and enteroendocrine cell hyperplasia lead us to hypothesise that a genetic tendency impairing downregulation of certain key pro-inflammatory genes might predispose to PI-IBS which our recent studies suggest accounts for nearly one in five of all IBS.36 The first part of our study identified seven genes abnormally expressed in the rectal mucosa of patients recovering from Campylobacter enteritis and/or IBS patients. We also partially confirmed others findings of increased PBMC production of the cytokines TNFα and IL-10 in IBS.16 We then in Part 2 of our study determined the frequency in IBS patients of polymorphisms in these candidate genes which we had identified in Part 1. The main finding was of a consistent association of IBS-D with polymorphisms in the TNFSF15 gene with a reduced risk associated with the presence of the minor allele; ORs between 0.6 and 0.68 (95% CI 0.47 to 0.93). Three out of five SNPs studied in this gene showed association, although because of linkage disequilibrium between these SNPs, they should not be considered as truly independent variables. Genetic variation in this gene has previously been associated with Crohn's disease in Japanese patients with a risk haplotype (rs6478108 A, rs6478109C and rs7848647 G, as genotyped on opposite strand),28 a finding confirmed by a study in Koreans which showed the same trend for rs6478108 and rs7848647.29 The link with rs7848647 G allele was also confirmed in a European cohort37 and the large genome-wide association studies found that the major allele TNFSF15 SNP rs4263839, which is in high linkage with rs6478108 (see figure 2), was a risk factor for Crohn's.2 These data suggest a similarity between the mechanisms underlying the development of both IBS-D and Crohn's disease.
We carefully defined the intermediate phenotype of our patients in study 1 including details of gut permeability and bowel habit. Using the Cr51 EDTA urine excretion method, we could not confirm previous reports of increased intestinal permeability in IBS-D as a group nor could we link genotype to permeability. However, we could confirm that Campylobacter infection increases distal small bowel permeability for up to 6 months postinfection, in keeping with the fact that the brunt of this infectious disease is borne in the distal ileum and proximal colon. We found no differences in Cr51 EDTA urine excretion for the different genotypes of rs 6478108.
Although we found a rise in PBMC cytokines 6 months after Campylobacter infection with a trend to be increased in IBS-D, the results are highly variable, probably because cytokines increase in response to many insults both infectious and psychological39 ,40 and hence not as good a biomarker in IBS as had once been thought.16
Importantly, these findings confirm a recently reported association between IBS and a polymorphism in TNFSF15 (rs4263839) which is in strong linkage disequilibrium with rs6478109 which we found closely linked with IBS (see figure 2). Previous studies have suggested that gene expression in colonic biopsies is stable at least over the short term.7
We analysed five SNPs known within the TNFSF15 gene. As shown in the figure 2, there is substantial linkage disequilibrium within a large segment of DNA in this gene and thus rs 6478109 and rs 7848647 are both in 98% linkage disequilibrium with the SNP studied by Zucchelli et al (rs 4263839)38 so that it is likely that analysing any of these SNPs would give a similar conclusion. We chose SNPs for which laboratory data showed that the SNP altered function. The risk haplotype defined by the SNPs has been shown to increase expression of TNFSF15 in PBMCs stimulated by phytohaemagglutinin, relative to the non-risk haplotype.30 While the risk haplotype based on the five SNPs we studied was first associated with CD in Japanese patients, it has since been replicated in Europeans.28
Although our study numbers are relatively small, the independent finding of the same genetic link with IBS in two separate cohorts is highly unlikely to be due to chance.
TNFSF15, also known as TL1A, is a member of the TNF super family that binds to the death receptor 3 (DR3, TNFSF25) which activates a range of inflammatory pathways via NFkB.41 TNFSF15 mRNA is upregulated in Crohn's disease and augments interferon-γ production in lamina propria mononuclear cells from Crohn's patients.42 Lamina propria macrophages are major producers of TNFSF15 which enhances their production of interferon and IL-17 when they are stimulated by IL-23.43 Previous studies and our own show increased PBMC TNFα production in IBS-D16 and TNFSF15 is known to stimulate NFκB41 which in turn stimulates TNFα.
We were also able to confirm a previous report of increased prevalence of the TNFα rs1800629 genotype GA compared with GG in PI-IBS.25 These results support previous studies showing a key role for the TNFα pathway in the development of IBS.16
We believe that the demonstration of increased TNFSF15 mRNA in the rectal mucosa of IBS-D patients and an association between SNPs in TNFSF15 and risk of IBS-D are likely to be causally linked. However, an alternative explanation, given the known role for this gene in Crohn's disease, could be that some of our cases with IBS-D had undiagnosed Crohn's. We believe this is unlikely, first because the prevalence of Crohn's is 100-fold less than IBS and second because all these patients were investigated specifically to exclude this diagnosis with blood tests for inflammatory markers and colonoscopy. However, recently numerous studies have shown a low grade immune activation in the mucosa of IBS especially IBS-D,15 ,44 ,45 as well as increased gut permeability.46 ,47 While recognising that the histological picture and clinical features are usually quite different there are patients who appear to have an overlap with features of both IBS and Crohn's disease. Indeed, Crohn's in its early stages is often misdiagnosed as IBS-D, the mean time to diagnosis from onset of Crohn's disease symptoms being 11 years in the Manitoba cohort.48 The recent demonstration in numerous studies of a low grade immune activation in the mucosa of IBS, especially IBS-D,15 ,44 ,45 as well as increased gut permeability46 ,47 suggests similarities which warrant further exploration.
The finding of increased CCL11 (eotaxin), CCL13 (monocyte chemoattractant protein 4) and Calpain 8 mRNA are of interest being pro-inflammatory chemokines and suggest for the first time that assessing eosinophils in IBS mucosa might be of interest as it has proven to be in the oesophageal dysmotility. We did not find any increase in eosinophil count in our biopsies but this may not be the best way to identify activation of eosinophils. Decreases were seen in expression of NR1D1 (nuclear receptor subfamily 1, group D, member 1), a nuclear receptor, overexpression of which is associated with an increase in the expression of matrix-degrading enzymes such as matrix metalloproteinase 13. GPR161 (G protein-coupled receptor 161) is of unknown function while GABRE (γ-aminobutyric acid A receptor, ɛ) is one of the ligand-gated ion channels and is expressed widely in adrenergic and serotonergic nerves. What role if any these play in IBS will require further study.
One final issue which requires thought is that of multiple testing. Using a Bonferroni correction for the 21 SNPs tested would increase the p value for the TNSF15 genes to 0.15. However, this is an overconservative approach for two reasons. First, we used a two staged approach, first examining differences in mucosal gene expression in infection and IBS-D. We then performed a genetic analysis of SNPs in these same genes which was essentially a hypothesis testing exercise rather that an examination of all possible genes which would of course be expected to generate a lot of false positives by chance. Second and most convincingly, we have independent confirmation of the association of TNFSF15 polymorphisms with IBS by another group of investigators using a separate cohort from the USA and Sweden.38 Zucchelli et al tested 30 SNPs and found one TNFSF15 SNP associated with IBS while we studied 21 SNPs and found three associated implicating the same gene TNFSF15. Although not the same SNP, linkage disequilibrium calculations show that the SNPs are closely linked. The probability of this occurring by chance is 0.033×0.142=0.0048. Zucchelli et al 38 found a link between IBS and a TNFSF15 polymorphism rs4263839 with a decrease in the MAF in all IBS groups compared with controls, especially in the IBS-C group. They also reported strong linkage between rs4263839 and rs6478109 which we found to be associated with IBS-D (see figure 2). Interestingly, they also showed as we did that the risk allele was associated with increased rectal biopsy mRNA and in addition blood mRNA which makes us believe that the lack of overall significance in differences in mRNA for TNFSF15 in our study relates to the small number of subjects with low risk alleles.
We found a link between the TNFSF15 risk alleles and bowel habit within the whole study group excluding those with recent Campylobacter infection. Those with the risk allele associated with IBS had more days per week of loose stool suggesting that the link between a greater inflammatory response and looser stool is not limited to those with a formal diagnosis of IBS. This finding supports the prior observation by Camilleri et al that polymorphisms linked to Crohn's disease are also associated with faster colonic transit in a large group including both IBS and HVs but using a more rigorous validated method measuring transit.9
After we had completed our study, Villani et al showed that polymorphisms in TLR-9, IL-6 and cadherin genes (CDH1) were associated with PI-IBS.49 We analysed these same SNPs but found no evidence of a link with IBS-D, IBS-C or PI-IBS but we were very underpowered for the PI-IBS group (n=41) and so we can only conclude that more numbers are needed to clarify this.
In conclusion, our data support the thesis that IBS patients are genetically predisposed to an exaggerated response to infection and other immune activating stimuli which results in development of IBS. Our data suggest a potential role for TNFSF15 in this process. These results should encourage further research to identify better biomarkers for identifying IBS patients with immune activation who would be predicted to respond to anti-inflammatory treatments such as mesalazine or certain probiotics which are currently being trialled in IBS.
Acknowledgments
We are grateful for technical assistance from Susan Richards and Dr Amanda Henry and for Professor Y Mahida's advice on the PBMC preparation and Marguerite Richards who assisted in the patient recruitment.
References
Supplementary materials
Supplementary Data
This web only file has been produced by the BMJ Publishing Group from an electronic file supplied by the author(s) and has not been edited for content.
Files in this Data Supplement:
- Data Supplement 1 - Online supplement 1
Footnotes
-
CS and ND contributed equally to the manuscript.
-
Funding Educational grant from GlaxoSmithKline, grant number: GRGC Ref No: 00474.
-
Competing interests The study was an investigator-initiated study funded by GlaxoSmithKline who supported the project both financially and by performing the array analyses and confirmatory PCR analyses on the rectal biopsies. All subjects received this information prior to study entry. The genetic analyses and write up was performed by the investigators independent of the funder. The Nottingham Biomedical Research Unit is supported by a grant from the National Institute for Health Research. No other conflicts of interest.
-
Ethics approval Approval provided by theNottingham NHS Research Ethics Committee.
-
Provenance and peer review Not commissioned; externally peer reviewed.
-
Data sharing statement We have uploaded the Affymatrix data to a public access database GEO, accession number (GSE36701) which will be available to all from October 2012.