Article Text

Abstract
Background Recent evidence indicates that the composition of the gut microbiota contributes to the development of metabolic disorders by affecting the physiology and metabolism of the host. Metformin is one of the most widely prescribed type 2 diabetes (T2D) therapeutic agents.
Objective To determine whether the antidiabetic effect of metformin is related to alterations of intestinal microbial composition.
Design C57BL/6 mice, fed either a normal-chow diet or a high-fat diet (HFD), were treated with metformin for 6 weeks. The effect of metformin on the composition of the gut microbiota was assessed by analysing 16S rRNA gene sequences with 454 pyrosequencing. Adipose tissue inflammation was examined by flow cytometric analysis of the immune cells present in visceral adipose tissue (VAT).
Results Metformin treatment significantly improved the glycaemic profile of HFD-fed mice. HFD-fed mice treated with metformin showed a higher abundance of the mucin-degrading bacterium Akkermansia than HFD-fed control mice. In addition, the number of mucin-producing goblet cells was significantly increased by metformin treatment (p<0.0001). Oral administration of Akkermansia muciniphila to HFD-fed mice without metformin significantly enhanced glucose tolerance and attenuated adipose tissue inflammation by inducing Foxp3 regulatory T cells (Tregs) in the VAT.
Conclusions Modulation of the gut microbiota (by an increase in the Akkermansia spp. population) may contribute to the antidiabetic effects of metformin, thereby providing a new mechanism for the therapeutic effect of metformin in patients with T2D. This suggests that pharmacological manipulation of the gut microbiota in favour of Akkermansia may be a potential treatment for T2D.
- Intestinal Bacteria
- Obesity
- Pharmacotherapy
- Mucins
Statistics from Altmetric.com
Significance of this study
What is already known about this subject?
-
Alterations in the gut microbiota composition play a role in the development of adipose tissue inflammation and in the pathogenesis of obesity-induced diabetes.
-
The presence of the mucin-degrading bacterium, Akkermansia spp., is associated with healthy mucosa.
-
Immune cells resident in the adipose tissue are critical promoters of obesity and insulin resistance.
What are the new findings?
-
The microbial community in the intestine of metformin-treated high-fat diet-fed (HFD-Met) mice exhibited a unique microbial consortium that was distinct from that in the HFD-fed control mice (HFD-CT) or normal-chow diet (NCD)-fed mice (NCD-CT and NCD-Met).
-
Marked changes in the abundance of 29 genera, particularly mucin-degrading Akkermansia, accounted for the observed differences in the gut microbial communities following a HFD or metformin treatment.
-
The number of mucin-producing goblet cells increased upon metformin treatment, regardless of the dietary composition or glucose tolerance.
-
Akkermansia-administered HFD-fed mice (HFD-Akk) showed improved glucose tolerance and an increase in the number of goblet cells and adipose tissue-resident CD4 Foxp3 regulatory T cells (Tregs).
How might it impact on clinical practice in the foreseeable future?
-
This study provides circumstantial evidence that modulation of the gut microbial community, either by metformin treatment or by Akkermansia administration, may result in an improved metabolic profile in patients with type 2 diabetes.
Introduction
Worldwide prevalence of obesity has increased over the past 30–40 years owing to changes in dietary patterns and reduced physical activity.1 The condition has now become a pandemic.2 ,3 Although the primary reason for obesity is an imbalance between dietary energy intake and expenditure, it is becoming clear that the gut microbiota plays a role in controlling energy balance and immune homeostasis.4–11 The human gut microbiota comprises 10–100 trillion microorganisms and more than 1000 different bacterial species.12 It also plays important roles in regulating the host's metabolism and extracting energy from ingested food.4 ,8 ,10 ,13
Apart from its beneficial functions for the host, gut microbiota can potentially take part in pathophysiological interactions with the host, particularly in the case of obesity and related metabolic disorders. Recent studies have shown that changes in the gut microbiota may play a role in the pathogenesis of the obese and diabetic phenotypes. For example, germ-free mice are protected from high-fat diet (HFD)-induced obesity and metabolic dysfunction, including glucose intolerance.4 ,6 In addition, colonisation of germ-free animals with gut microbiota isolated from conventionally raised obese donors led to a significant increase in body fat content and insulin resistance in recipient mice.10 ,14 Similarly, the transfer of gut microbiota from Toll-like receptor 5-deficient mice to wild-type germ-free mice also transferred the diabetic phenotype of the Toll-like receptor 5-deficient donor to the recipient.15 Taken together, these studies suggest that alterations in the gut microbial community increase the capacity of the host to extract energy from a given diet, thereby triggering the development of obesity and diabetes. This indicates a link between the gut microbiota and the diabetic phenotype of the host.
Obesity and type 2 diabetes (T2D) are also associated with chronic low-grade tissue inflammation.16 ,17 Numerous studies suggest that adipose tissue is not just a fat storage depot; it also controls systemic metabolism by acting as an endocrine organ.18 Moreover, inflammation within adipose tissue disrupts triglyceride storage, and the subsequent excess of free fatty acids induces insulin resistance.19 At the cellular level, immune cells present in adipose tissue, such as neutrophils and macrophages, participate in obesity-induced pathology.20 ,21 Of the different types of immune cells that reside in adipose tissue, CD4 Foxp3 regulatory T cells (Tregs) control local inflammation by counteracting the infiltration of M1 macrophages and CD8 T cells, thereby preventing adipose tissue inflammation.22 The protective role played by these Tregs has also been demonstrated in several animal models of obesity and insulin resistance, such as leptin-deficient mice and HFD-fed mice.23 Both the percentage and number of Tregs in the adipose tissue of obesity-induced diabetic animals are considerably lower than those in lean controls.
Metformin (1,1-dimethylbiguanide hydrochloride) has been widely used to treat T2D for the past 50 years.24–26 In T2D, increased hepatic glucose production is an important cause of hyperglycaemia. Although the precise mechanism underlying the glucose-lowering effect of metformin is not fully understood, the most commonly accepted mechanism involves the suppressed transcription of genes involved in gluconeogenesis via activation of AMP-activated protein kinase (AMPK), an enzyme that senses cellular energy levels and regulates the availability of fuel.27–29 The intestinal microbiota may also control the activation status of AMPK. For example, germ-free mice that are protected against diet-induced obesity show increased levels of AMPK activity in the liver and in muscle tissue.6 Furthermore, the intestines themselves make an important contribution to the glucose-lowering effect of metformin.30–32 Several studies report much higher concentrations of metformin in the intestinal mucosa than in other tissues.31 ,32 These findings raise the possibility that metformin may have both direct and indirect effects on the gut microbiota, which may in turn contribute to its antidiabetic effects.
However, no experimental or clinical studies have examined the effects of antidiabetic drugs on the gut microbiota, although gut microbial dysbiosis has been reported in patients with T2D.33 ,34 Therefore, questions about whether metformin, as an antidiabetic agent, regulates glucose metabolism by modulating the gut microbiota remain unanswered. This study examined the therapeutic effect of metformin on the progression of the diabetic phenotype in HFD-induced obese and diabetic mouse models and studied the possible contribution of the gut microbiota. The results show that metformin induces a profound shift in the composition of the gut microbiota community and suggest a mechanism by which this drug exerts its therapeutic effect in patients with diabetes.
Materials and methods
Animals
C57BL/6 mice (4-week-old, n=24; Charles River Laboratories, L'Arbresle, France) were maintained in groups of no more than six mice per cage with free access to food and water. Mice were fed either a normal-chow diet (NCD) or a HFD (60% fat, 20% protein, 20% carbohydrate (kcal/100 g), #D12492; Research Diets, New Brunswick, New Jersey, USA). After 8 weeks, the mice were divided into four groups of six and fed the following diets: (1) a NCD without metformin treatment (NCD-CT), (2) a NCD with metformin treatment (NCD-Met), (3) a HFD without metformin treatment (HFD-CT) or (4) a HFD with metformin treatment (HFD-Met). The two groups of metformin-treated mice (NCD-Met and HFD-Met) received 300 mg/kg/day of metformin by oral gavage for a period of 6 weeks. Body weight was monitored once a week. Akkermansia muciniphila MucT (CIP107 961) were cultured anaerobically on brain–heart infusion (BBL) agar plates containing porcine mucin (Sigma) at 37°C. The bacteria were harvested at the late exponential growth phase, suspended in thioglycolate–phosphate-buffered saline (PBS) (4.0×10⁸ cfu) and orally administered to HFD-fed mice (HFD-Akk; n=6).
Biochemical analyses
Glucose homeostasis
Mice were fasted overnight and a glucose tolerance test was performed after an intraperitoneal injection of glucose (1 g/kg body weight). The homeostasis model assessment of insulin resistance (HOMA-IR) index was calculated as previously described.35 Blood glucose concentrations were measured with an Accu-Check glucometer (Roche) both before (0 min) and after (15, 30, 60, 120 and 180 min) the glucose injections.
Histology
The distal ileum was removed from all the mice, flushed with PBS, fixed in 4% formaldehyde overnight at room temperature and paraffin-embedded. The specimens were then cut into 5 μm sections and stained with Alcian blue periodic acid–Schiff (PAS) (the goblet cells were stained blue). The results were expressed as the number of goblet cells per intestinal villus.
Analysis of gut microbiota and quantification of Akkermansia muciniphila
The methods used to analyse the gut microbiota and to quantify A muciniphila are described in the online supplementary methods (see online supplementary table S1).
Isolation of stromal vascular fraction cells and flow cytometry
The visceral adipose tissue (VAT) was excised and minced into small pieces (>2 mm) and incubated for 20 min in a collagenase solution (1 mg/mL of collagenase type 2 (Worthington) in Dulbecco's modified Eagle's medium). The digested tissue was centrifuged at 1000g for 8 min. The pellet containing the stromal vascular fraction (SVF) was resuspended in PBS and filtered through a 70 μm mesh filter. The cells were then washed with PBS, incubated in red blood cell (RBC) lysis buffer (Sigma) for 3 min and resuspended in fluorescence-activated cell sorting (FACS) buffer (2 mM EDTA, 2% fetal bovine serum in PBS). The isolated cells were then incubated with labelled monoclonal antibodies (eBioscience and BD Pharmingen) and analysed by flow cytometry using a FACSAria flow cytometer (Becton Dickinson). Data were analysed with FlowJo software (Tree Star, Inc). We validated the flow cytometric identification of CD11c F4/80 CD11b (M1) and CD206 F4/80 CD11b (M2) adipose tissue macrophages. The percentage of Tregs was analysed by three-colour flow cytometry after staining with antibodies to CD3, CD4 and mouse/rat Foxp3 (FJK-16 s), as previously described.36
Statistical analysis
Data were expressed as the mean±SEM. Significance of the differences between the groups of mice was assessed using the Student t test. For experiments comparing multiple groups, the differences were analysed by one-way analysis of variance followed by Duncan's post-hoc test. p Values <0.05 were considered significant. The nearest shrunken centroid (NSC) method was used to detect the bacterial genera that were specifically over- or under-represented within each category (diet, treatment or diet–treatment combinations).37 The amount of shrinkage was chosen to minimise the overall misclassification error. These analyses allowed the identification of bacterial genera whose relative abundance was significantly different between the categories.38 The analysis was performed using the Predictive Analysis for Microarrays package under R software.
Results
Metformin improves glucose homeostasis under HFD conditions
To assess the effect of metformin on obesity and glucose intolerance, we used a glucose tolerance test to examine glucose homeostasis in metformin-treated and non-treated mice fed either a NCD or a HFD. As expected, in comparison with NCD-CT mice, HDF-CT mice showed an increase in the area under the curve (AUC), an increased HOMA-IR index and an increased incidence of fasting hyperglycaemia (figure 1), all of which suggest glucose intolerance. Total body weight and fat pad weight also increased in mice fed a HFD (see online supplementary figure S1). Compared with HFD-CT mice, HFD-Met mice showed a significant improvement in glucose tolerance, fasting blood glucose levels and the HOMA-IR index (p<0.01) (figure 1A–D), demonstrating that metformin has an anti-hyperglycaemic effect. Metformin treatment did not affect fasting blood glucose levels, glucose tolerance or the HOMA-IR index in NCD-fed mice. In contrast to its effects on glucose metabolism, 6 weeks of metformin treatment had no effect on body weight or fat pad weight in NCD- or HFD-fed mice (see online supplementary figure S1), indicating that the improvements in glucose tolerance seen in the HFD-Met mice are not related to changes in body weight or fat mass.
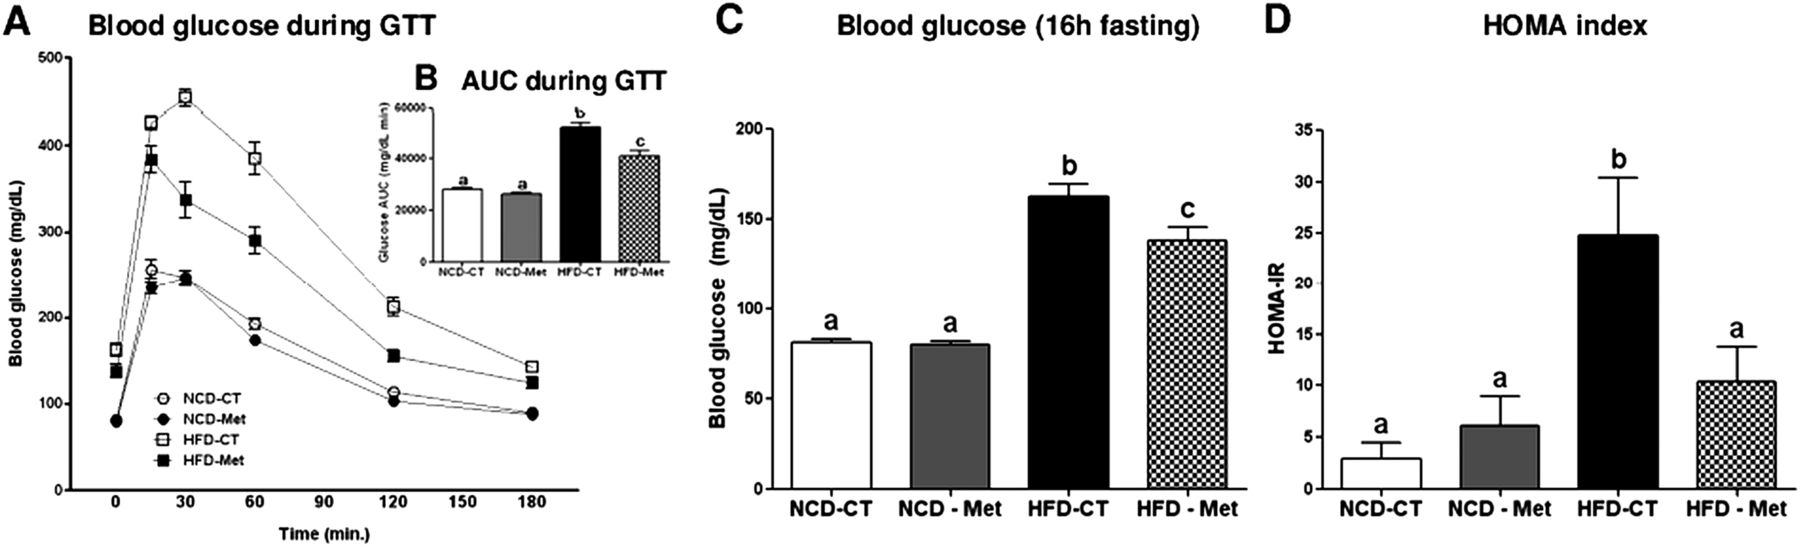
Metformin improves glucose homeostasis in HFD-fed (diabetic) mice. The glucose tolerance test (GTT) (A), the area under the curve (AUC) for the GTT curves (B), the fasting glucose levels (C) and the homeostasis model assessment of insulin resistance (HOMA-IR) index (D) are shown for both control (CT) and metformin-treated (Met) mice fed a normal-chow diet (NCD) or a high-fat diet (HFD). All mice were fasted overnight (16 h) before the GTT. Data are expressed as the mean±SEM (n=6 mice/group). The letters denote the level of statistical significance (p<0.05) using one-way analysis of variance followed by Duncan's post-hoc test.
Effect of metformin on the composition of the gut microbial community
Since the composition of the gut microbiota is associated with T2D,33 we next determined the effect of metformin on the composition of the gut microbiota using metagenomic analysis based on 454 pyrosequencing technology. A total of 121 051 raw reads were obtained from 20 fecal samples. After performing quality control procedures to remove low-quality sequences, 63 132 sequences (with an average length of 370±25 bases) were subjected to further analysis (see online supplementary table S2).
Classification of the sequences was carried out by non-OTU (operational taxonomic units)-based assessment using the Ribosomal Database Project classifier. All the sequences were assigned to eight bacterial phyla, comprising three phyla that dominate the distal gut in both mice and humans: Firmicutes, Bacteroidetes and Actinobacteria.8 Although all individuals are born with a specific gut microbiome, dietary factors have a significant influence on the development of the gut microbial composition.8 ,10 ,13 We observed that HFD-CT mice had a greater abundance of Firmicutes (p<0.001) and a lower abundance of Bacteroidetes (p<0.001) than NCD-CT mice (see online supplementary figure S2A). In addition, HFD-CT mice showed a significantly lower abundance of the phyla Verrucomicrobia (p<0.001) and TM7 (p<0.01) than NCD-CT mice.
Thus, we hypothesised that metformin may alter the composition of the gut microbiota in parallel with its antidiabetic effect on host glucose metabolism. Metformin treatment resulted in a profound shift in the fecal microbial community profiles of the gut microbiota in diabetic mice (see online supplementary figure S2B). The tendency toward phyla-wide changes after metformin treatment was similar in NCD- and HFD-fed mice; however, the changes were more marked in the HFD-fed group. There were significant differences in the abundance of Firmicutes and Bacteroidetes between HFD-CT mice and HFD-Met mice (p<0.001), but there was no significant difference in the abundance of these two phyla between NCD-Met mice and NCD-CT mice. Importantly, the abundance of Verrucomicrobia was significantly increased in the HFD group after metformin treatment (p<0.001), whereas no significant change was seen in the NCD group. This suggests that metformin-induced modulation of the gut microbiota is diet-dependent.
The overall composition of the bacterial community in the different groups was characterised by quantifying and interpreting similarities based on phylogenetic distances using UniFrac metric. The principal coordinates analysis of UniFrac-based pairwise comparisons of community structures disclosed an unexpected distribution of the microbial community among the four groups of mice. The main finding of the principal coordinates analysis was that different diets promote the development of different gut microbial communities. Furthermore, HFD-Met mice formed a cluster that was distinct from that of HFD-CT mice and not even intermediate between those of the control HFD-fed and NCD-fed mice (figure 2). The microbial communities of the NCD-fed groups were, however, closely clustered, even in mice treated with metformin; this indicates that metformin has a more marked effect on gut microbial community composition in HFD-fed mice than it does in NCD-fed mice. Taken together, these results indicate that metformin has different effects on the gut microbial composition of NCD- and HFD-fed mice.
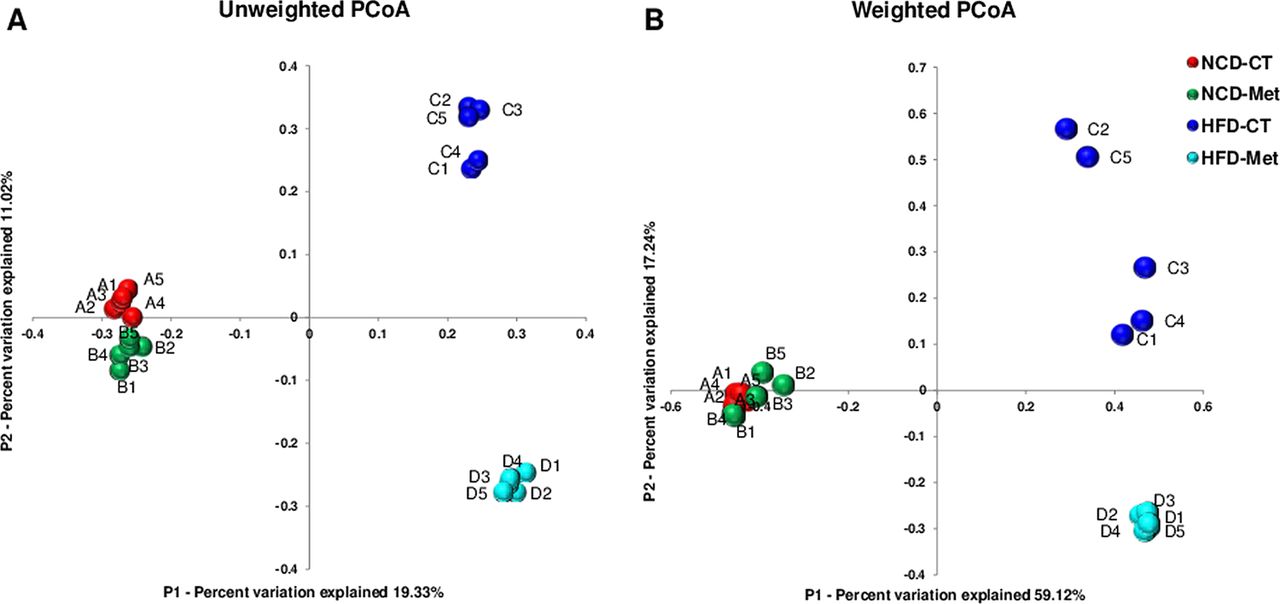
Cluster analysis of control (CT) or metformin-treated (Met) mice fed a normal-chow diet (NCD) or a high-fat diet (HFD). Bacterial communities were clustered using the principal coordinates analysis (PCoA) of unweighted (A) and weighted (B) UniFrac distance matrices. The first two principal coordinates (PC1 and PC2) from the PCoA of unweighted and weighted UniFrac are plotted for each sample. The percentage variation in the plotted principal coordinates is indicated on the axes. Each spot represents one sample and each group of mice is denoted by a different colour.
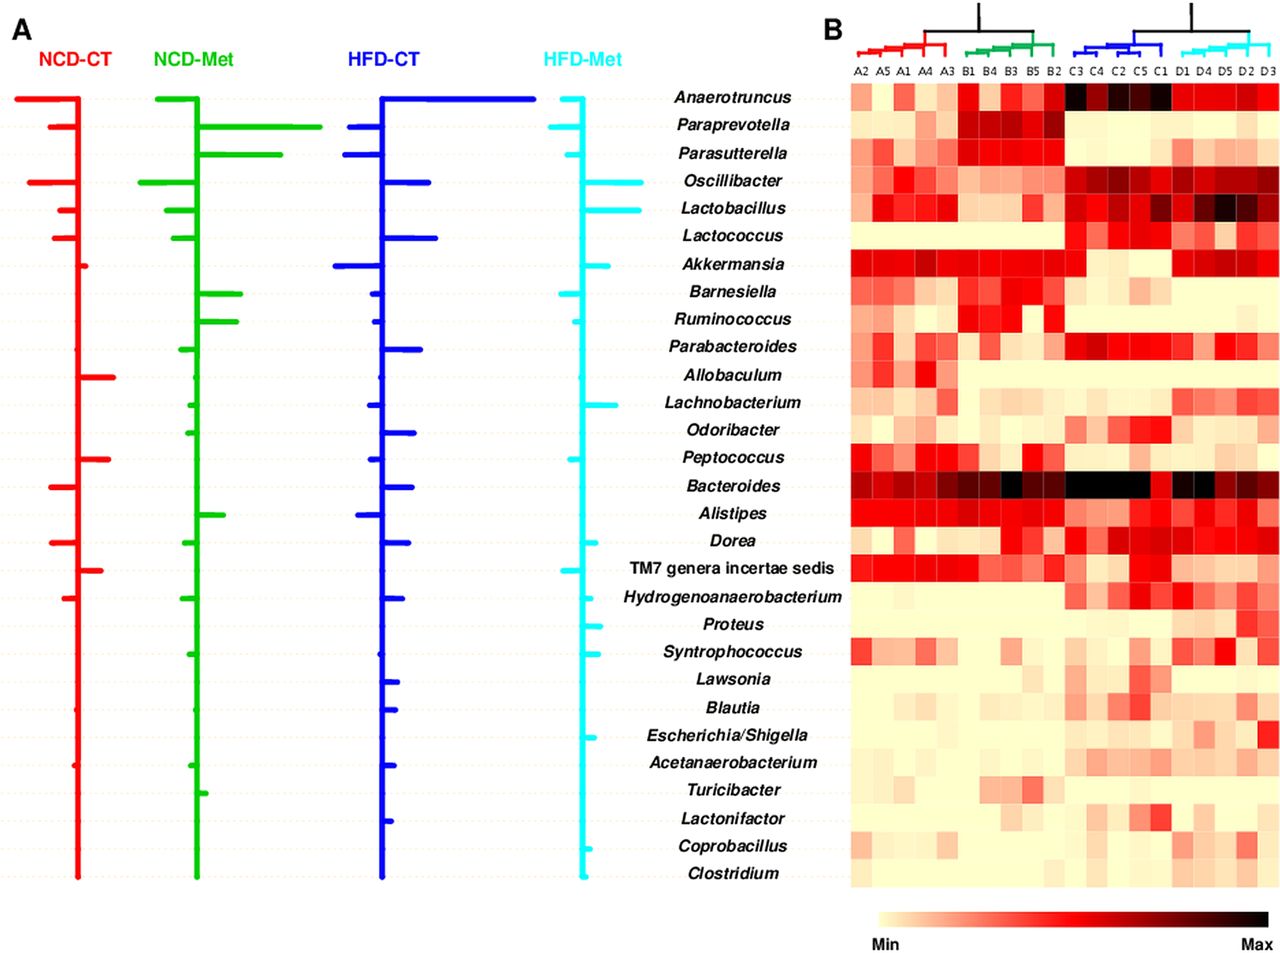
Next, to determine which bacterial genera contributed to these differences in microbiota composition between the four groups, we performed a NSC analysis. The specifically defined comparisons between community characteristics were tabulated on a heat map representing the relative abundance of each genus. By combining both statistical and NSC analyses, we found that changes in the abundance of 29 genera, belonging to six phyla, accounted for the differences in the gut microbial communities seen in mice fed different diet or metformin treatment (figure 3), which suggests the possibility that the antidiabetic effect of metformin may be mediated by a specific subset of bacterial taxa. The relative abundance of Anaerotruncus, Lactococcus, Akkermansia, Parabacteroides, Odoribacter, Alistipes, Lawsonia, Blautia and Lactonifactor was altered by a HFD; however, metformin rescued these HFD-induced changes, restoring the levels to those seen in NCD-fed mice. Despite the low relative abundance (0.3–2.9%) of sequences assigned to Akkermansia, this genus made a large contribution to the observed differences in the composition of the gut microbial communities in HFD-CT and HFD-Met mice. Moreover, Akkermansia was responsible for the greater abundance of Verrucomicrobia seen in HFD-Met mice compared with HFD-CT mice. Thus, metformin restored the relative abundance of specific bacterial genera in HFD-Met mice to that seen in NCD-fed mice, an action that may play a role in its glucose-lowering effects.

Striking differences in the abundance of the different bacterial genera that comprise the gut microbial communities in NCD-fed and HFD-fed mice in CT and Met mice. (A) Nearest shrunken centroids of the 29 genera that account for the differences in the composition of the microbial communities between the four groups of mice. For the genera listed in the centre, those that are over-represented are designated by rightward-extending bars. The bars denoting under-represented genera extend to the left. The length of the bar indicates the strength of the effect. (B) Heat map showing the relative abundance of each classified genus. Each column on the heat map represents a sample of 20 mice (n=5 mice/group) and each row represents the genus listed in the centre. A range of colours, from yellow to black, indicates the prevalence of each genus. All the genera listed in the centre showed significant differences (p<0.05; one-way analysis of variance followed by Duncan's post-hoc test). NCD-CT, normal-chow diet (NCD)-fed control mice; NCD-Met, NCD-fed metformin-treated mice; HFD-CT, high-fat diet (HFD)-fed control mice; HFD-Met, HFD-fed metformin-treated mice.
The unexpected changes in the composition of the gut microbiota in HFD-Met mice prompted us to examine whether depleting the microbiota using broad-spectrum antibiotics would abrogate the antidiabetic effects of metformin. To examine this, HFD-fed mice were treated with a combination of antibiotics (carbenicillin, metronidazole, neomycin and vancomycin) before metformin treatment. It is noteworthy that HFD-fed mice treated with antibiotics, but not treated with metformin (HFD-Abx), showed a significant improvement in glucose tolerance in comparison with HFD-CT mice (p<0.05) (see online supplementary figure S3). However, the reduction in the AUC seen for metformin- and antibiotic-treated HFD-fed mice (HFD-Abx+Met) was not significantly different from that seen for HFD-Abx mice. This suggests that antidiabetic effect of metformin can be abrogated in the absence of the gut microbiota.
Metformin treatment increases the number of goblet cells
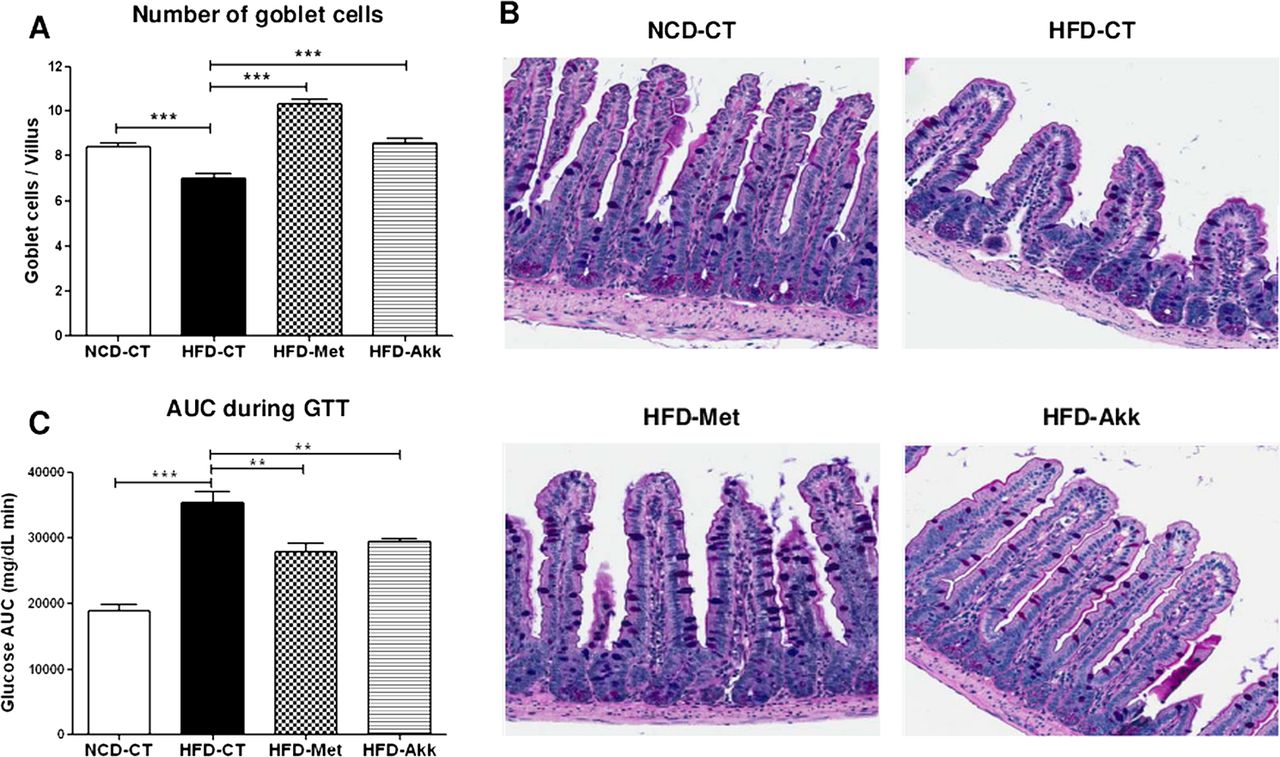
Because metformin significantly increased the relative abundance of Akkermansia in HFD-Met mice and Akkermansia uses mucus as a nutrient source,39 we next examined the ileum in mice from the different treatment groups and counted the number of mucin-producing goblet cells. PAS–Alcian blue staining showed that metformin treatment increased the number of PAS-positive goblet cells (figure 4A–D). To evaluate these changes further, we counted the number of PAS-positive goblet cells per villus. An average of 6.6±0.3 goblet cells was seen in HFD-CT mice, which was lower than that in NCD-CT mice (7.8±0.2) (figure 4E). Interestingly, metformin treatment significantly increased the number of goblet cells in both NCD- and HFD-fed mice (NCD-Met, 9.1±0.2; HFD-Met, 9.5±0.5; p<0.001), indicating that metformin alters the goblet cell population regardless of metabolic profile or dietary composition. In addition, Pearson correlation analysis showed that the number of goblet cells was positively correlated with the abundance of Akkermansia (figure 4F).

The goblet cell population is affected by metformin treatment. (A–D) Representative light photomicrographs showing ileal sections stained with periodic acid–Schiff (PAS)/Alcian blue. (A) NCD-CT mice. (B) NCD-Met mice. (C) HFD-CT mice. (D) HFD-Met mice. (E) Changes in goblet cells (blue in A–D) are expressed as means±SEM of the number of PAS-positive goblet cells per villus. The letters above the bars denote statistically significant differences (p<0.05) between the means (one-way analysis of variance followed by Duncan's post-hoc test). (F) The relationship between the relative abundance of Akkermansia and the number of goblet cells (Pearson's correlation test; r=0.4996, p=0.02). NCD-CT, normal-chow diet (NCD)-fed control mice; NCD-Met, NCD-fed metformin-treated mice; HFD-CT, high-fat diet (HFD)-fed control mice; HFD-Met, HFD-fed metformin-treated mice.
Administration of A muciniphila improves insulin signalling by inducing VAT-resident CD4 Foxp3 Tregs
Since we observed both a greater abundance of Akkermansia and an increase in the number of goblet cells in HFD-Met mice, we next investigated whether a selective increase in the Akkermansia population had any effect on the metabolic profile or the number of goblet cells in HFD-fed mice. Mice were fed a HFD for 4 weeks, after which they were given 4.0×10⁸ cfu of A muciniphila orally every day for a further 6 weeks. Colonisation of Akkermansia was confirmed by calculating the relative fractional abundance of Akkermansia by quantitative PCR. Despite differences in the initial abundance of Akkermansia between HFD-CT and HFD-Akk mice, Akkermansia treatment prevented any decrease in abundance in HFD-fed mice as they aged (see online supplementary figure S4). Consistent with the positive correlation between the number of goblet cells and the abundance of Akkermansia, supplementation with Akkermansia restored both the number (per villus) and density (per unit surface area) of goblet cells in HFD-fed mice (figure 5A–B and online supplementary figure S5).
Akkermansia administration improves glucose tolerance and modulates the number of goblet cells in HFD-fed mice. (A) Changes in goblet cells are expressed as the number of periodic acid–Schiff (PAS)-positive goblet cells per villus. (B) Representative light photomicrographs showing ileal sections stained with PAS/Alcian blue. (C) Area under the curve (AUC) obtained after the glucose tolerance test (GTT). The results are representative of three independent experiments. All data are expressed as the mean±SEM (n=6 mice/group). p Values were determined using a one-tailed unpaired t test. *p<0.05; **p<0.01; ***p<0.001. NCD-CT, normal-chow diet (NCD)-fed control mice; HFD-CT, high-fat diet (HFD)-fed control mice; HFD-Met, HFD-fed metformin-treated mice; HFD-Akk, HFD-fed Akkermansia-administered mice.
Furthermore, HFD-Akk mice showed a significant improvement in glucose tolerance (p<0.01) (figure 5C), similar to that seen in HFD-Met mice. This indicates that Akkermansia has the potential to ameliorate the glucose tolerance induced by a HFD. However, treatment with a lower dose (4.0×10⁶ cfu) of live Akkermansia or with the same dose of autoclaved (dead) cells did not ameliorate the impaired glucose tolerance (see online supplementary figure S6), suggesting that the bacteria must be metabolically active and used at a dose > 4.0×10⁷ cfu to exert their beneficial effect. We next studied the effect of Akkermansia on metabolic hormones. As expected, metformin significantly reduced the increases in serum insulin and leptin levels induced by a HFD (p<0.001 for insulin; p<0.05 for leptin) (see online supplementary figure S7A and B), an effect that is probably secondary to improvements in glucose homeostasis. Similarly, HFD-Akk mice showed reduced serum concentrations of insulin and leptin compared with HFD-CT mice, although the differences were not statistically significant (see online supplementary figure S7A and B). The HFD-induced increases in serum lipopolysaccharide (LPS) levels reduced by metformin or Akkermansia, suggesting that the decreased endotoxaemia seen in HFD-Akk mice might be related to improved glucose tolerance. However, the differences were not statistically significant compared with HFD-CT mice (see online supplementary figure S7C). Furthermore, neither metformin nor Akkermansia affected intestinal permeability in HFD-fed mice (see online supplementary figure S7D).
Because changes in intestinal permeability cannot explain the improved metabolic profile seen after Akkermansia administration, we next examined the possibility that Akkermansia might exert an antidiabetic effect by reducing SVF inflammation in the VAT, which has been implicated in the aetiology of insulin resistance.21 ,40 FACS analysis showed a significant increase in the proportion of M1 macrophages and a decrease in the proportion of M2 macrophages in the VAT of HFD-CT mice compared with that in NCD-CT mice. However, M1/M2 macrophage polarisation in the SVF of HFD-fed mice was not affected by Akkermansia or metformin (see online supplementary figure S8). In addition, we also observed a significant difference in the CD4/CD8 T cell ratio in the SVF of NCD-CT and HFD-CT mice; however, the CD4/CD8 T cell ratio in the SVF of HFD-fed mice was not affected by Akkermansia or metformin (see online supplementary figure S9).
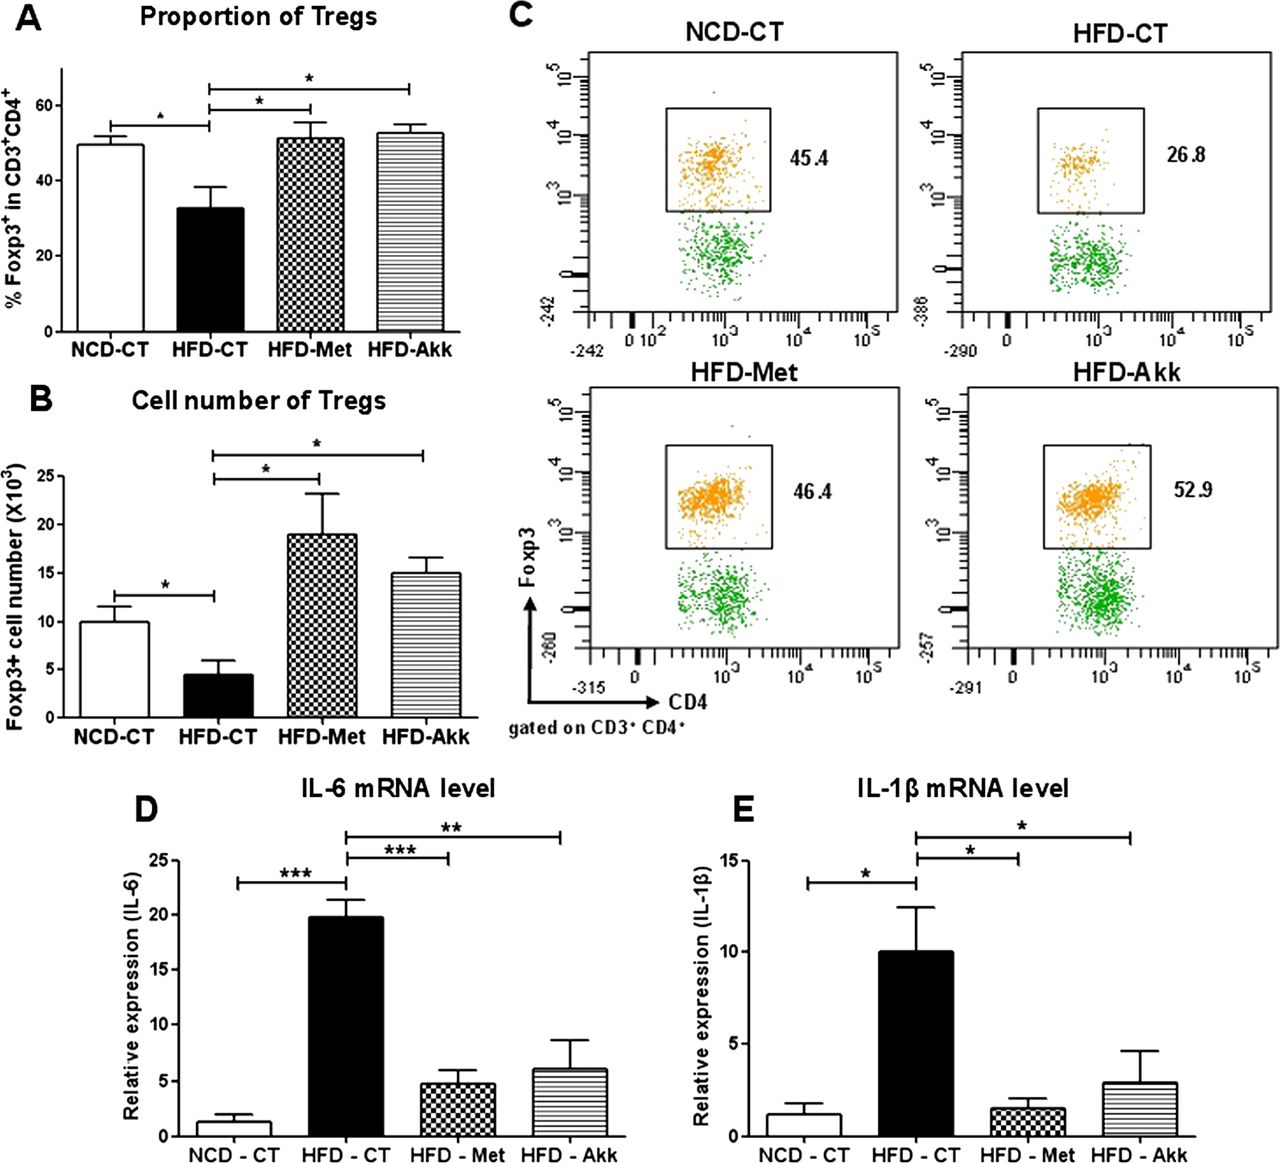
We next examined the number of Tregs, which are critical regulators of immune or inflammatory responses in the adipose tissues of obese animals. We observed a significant reduction in the proportion of Tregs in the SVF from the VAT of HFD-CT mice compared with that in NCD-CT mice (p<0.05) (figure 6A and C), consistent with previous reports.23 Interestingly, administration of Akkermansia to HFD-fed mice restored the Treg proportion to a level comparable to that in NCD-CT mice (NCD-CT, 49.5±2.3; HFD-CT, 32.5±5.7; HFD-Akk, 52.47±2.176; p<0.01; figure 6A and C). There was also a significant increase in the overall number of Tregs within the SVF in HFD-Met and HFD-Akk mice compared with that in HFD-CT mice (figure 6B). When we examined the expression of proinflammatory cytokines that play a direct role in tissue inflammation and insulin resistance, we found that the expression of interleukin (IL)-6 and IL-1β mRNA was significantly increased in HFD-CT mice compared with that in NCD-CT mice; however, after treatment with Akkermansia, the expression of IL-6 and IL-1β was similar to that in NCD-CT mice (figure 6D and E). Thus, a single bacterial species, A muciniphila, can attenuate VAT inflammation by inducing the generation of Tregs and suppressing the production of proinflammatory cytokines in the SVF, thereby leading to increased insulin signalling in HFD-fed mice.

The induction of Tregs and a reduction in the levels of proinflammatory cytokines attenuate visceral adipose tissue (VAT) inflammation in Akkermansia treatment to HFD-fed mice. (A) Percentage of Foxp3 Tregs within the CD3 CD4 T cell population in the stromal vascular fraction (SVF) of the VAT. (B) Absolute number of CD3 CD4 Foxp3 Tregs per million cells in the SVF of the VAT. (C) Representative fluorescence activated cell sorting plots showing the gated Foxp3 Tregs within the total SVF CD4 T cell population in the VAT of each mouse. (D and E) Relative expression of interleukin (IL)-6 and IL-1β mRNA in the VAT. All data are expressed as the mean±SEM (n=6 mice/group). p Values were determined using a one-tailed unpaired t test. *p<0.05; **p<0.01; ***p<0.001. NCD-CT, normal-chow diet (NCD)-fed control mice; HFD-CT, high-fat diet (HFD)-fed control mice; HFD-Met, HFD-fed metformin-treated mice; HFD-Akk, HFD-fed Akkermansia-administered mice.
Discussion
The gut microbiota is highly associated with obesity and T2D.8–10 ,33 Metformin is one of the most common drugs used to treat patients with T2D.25 ,41 Here, we used a metagenomic approach to demonstrate a role for metformin in modulating the composition of the gut microbiota in diet-induced obese and diabetic C57BL/6 mice. Consistent with previous findings,7 ,8 ,10 ,42 a HFD led to dysbiosis, increased fasting glucose levels and glucose intolerance. Metformin treatment significantly improved the hyperglycaemia in HFD-CT mice; however, the gut microbiota of HFD-Met mice showed an altered microbial composition, which was distinct from that in HFD-CT or NCD-CT mice. Based on these results, we suggest that the gut microbiota might be a contributing factor to the glucose-lowering effect of metformin.
Depending on the diet fed to the mice, metformin had different effects on microbial composition. The gut microbial community in HFD-Met mice was distinct from that in NCD-CT and NCD-Met mice (figure 2). Specifically, NSC analysis identified several genera that contributed to the observed differences in the distribution of bacterial communities between the four groups (figure 3). Metformin offset the changes in the proportions of several genera that were induced by a HFD. For example, the significant reductions in the proportions of Akkermansia and Alistipes and the increases in the proportions of Anaerotruncus, Lactococcus, Parabacteroides, Odoribacter, Lawsonia, Blautia and Lactonifactor, seen in HFD-CT mice, were reversed by metformin. Consequently, the proportions of these genera were similar in HFD-Met and NCD-CT mice (the non-diabetic phenotype). Depleting the gut microbiota using a combination of antibiotics before metformin treatment abrogated the antidiabetic effects of the drug, as indicated by the finding that HFD-Abx+Met mice did not show any additional reduction in the AUC over that seen in HFD-Abx mice. However, both HFD-Abx and HFD-Abx+Met mice showed a significant improvement in glucose tolerance compared with HFD-CT mice. Accordingly, recent studies suggest that antibiotics improve glucose homeostasis of HFD-fed mice.43 ,44 Furthermore, it is not possible to test whether the antidiabetic effects of metformin are abrogated in germ-free animals because HFD-induced dysbiosis is likely to be responsible for impaired glucose homeostasis.4 ,6 Despite this, our study supports the hypothesis that changes in the composition of the gut microbiota induced by antidiabetic drugs contribute to the improved glucose homeostasis seen in diabetic mice.
Recently, several studies have highlighted the effects of mucus degradation on host physiology.45 ,46 The mucin-degrading bacterium, A muciniphila, which belongs to the phylum Verrucomicrobia, is more abundant in the mucosa of healthy subjects than in that of diabetic patients or animals.47–50 Also, the colonisation of germ-free mice with A muciniphila led to altered host mucosal transcriptome profiles, which showed balanced immune responses indicative of tolerance to commensal bacteria.46 We observed that a HFD reduced the abundance of Akkermansia, suggesting an unhealthy state in these mice. The abundance of Akkermansia in HFD-Met mice was, however, significantly higher than that in HFD-CT mice, suggesting increased caecal mucin levels.45 In this regard, we observed a greater number of mucin-producing goblet cells in both NCD- and HFD-fed mice after metformin treatment. We also noted a positive correlation between the abundance of Akkermansia and the number of PAS-positive goblet cells (figure 4). Additionally, the amelioration of glucose intolerance and an increase in the goblet cell number were seen in HFD-Akk mice (figure 5). Akkermansia is a mucin-degrading bacterium and the proportion of Akkermansia correlates with an increase in the number of goblet cells; thus, an increase in the number of goblet cells may underlie the improved glucose profiles seen after Akkermansia administration.
In addition to producing components of the mucus layer, goblet cells also produce molecules that are associated with innate defence mechanisms, such as intestinal trefoil factor and resistin-like molecule β. Because these molecules augment barrier integrity,51 ,52 an increase in the number of goblet cells after Akkermansia administration may attenuate glucose intolerance by reducing LPS translocation across the intestinal barrier. However, serum LPS levels and gut permeability were not significantly different in HFD-Akk and HFD-CT mice, suggesting that factors other than changes in barrier function are responsible for the improved metabolic profile found in HFD-Akk mice.
Of the various T cell subsets, Tregs play a key role in controlling the classic adaptive immune responses and also the innate immune responses associated with obesity-induced chronic inflammation.53 In this context, we observed a significant decrease in the Treg population in HFD-CT mice compared with NCD-CT mice. However, oral administration of Akkermansia to HFD-fed mice restored both the percentage and absolute number of Tregs within the total CD4 T cell population in the VAT, which was similar to the effect of metformin treatment (figure 6A–C). These results provide evidence that a selective increase in the Akkermansia population improves the metabolic profile of individuals with diet-induced obesity via a mechanism that is mediated by the anti-inflammatory activity of VAT-resident Tregs. In addition, the increases in IL-6 and IL-1β mRNA expression seen in the VAT after a HFD were abolished by Akkermansia treatment (figure 6D and E). This is consistent with the findings of previous studies suggesting that Akkermansia has anti-inflammatory activity.48 ,54 Recent papers report that goblet cells affect intestinal immune homeostasis by delivering antigens from the lumen to tolerogenic dendritic cells, which then induce Tregs.55 Thus, the increase in the number of goblet cells after Akkermansia treatment might also induce Tregs; however, the increased goblet cell population does not appear to modulate systemic LPS or intestinal permeability. Also, the increased goblet cell population might expedite tolerogenic dendritic cell responses to Akkermansia under HFD conditions and dendritic cell-augmented Treg activity might suppress inflammatory changes in adipose tissues, leading to increased glucose tolerance.
In summary, our results show that metformin treatment induced an unexpected change in the composition of the gut microbiota in mice receiving a HFD, which may constitute a new mechanism for the antidiabetic activity of metformin. Moreover, these findings reinforce the concept that changes in the gut microbial community, aimed at increasing the Akkermansia population, can rescue the glucose intolerance associated with T2D. Although it is still unclear which of the molecular mechanisms or interactions associated with Akkermansia (and which govern glucose homeostasis) are involved in increasing the goblet cell and Treg populations, our pharmacological intervention study provides circumstantial evidence that modulation of the gut microbial community improves the health of patients with T2D. It also supports the suggestion that Akkermansia has a potential role as a probiotic with antidiabetic effects. It would be interesting to undertake a follow-up study to identify the immunomodulatory molecule(s) and/or soluble factors produced by Akkermansia and their related interactions.
References
Supplementary materials
Supplementary Data
This web only file has been produced by the BMJ Publishing Group from an electronic file supplied by the author(s) and has not been edited for content.
Files in this Data Supplement:
- Data supplement 1 - Online supplement
Footnotes
-
N-RS, J-CL and H-YL contributed equally to this work.
-
Contributors N-RS, J-CL and H-YL contributed equally to this work. N-RS, J-CL and H-YL performed the experiments and data analysis. N-RS, J-CL, M-SL and J-WB planned the experiments. N-RS, J-CL, M-SK, TWW, M-SL and J-WB wrote the manuscript. M-SL and J-WB conceived and supervised the study.
-
Funding This work was supported by a grant from the Mid-Career Researcher Program (2011–0028854 to J-WB) through the National Research Foundation of Korea (NRF), funded by the Ministry of Education, Science and Technology (MEST) and by the Bio R&D Program (2008–04090 to M-SL). M-SL is the recipient of a global research laboratory grant from the National Research Foundation of Korea (K21004000003-12A0500-00310).
-
Competing interests None.
-
Provenance and peer review Not commissioned; externally peer reviewed.