Article Text

Abstract
Background and aims: The pathogenesis of Crohn’s disease (CD), a chronic inflammatory bowel disease characterised by a Th1 immune response, remains unclear. Osteopontin (OPN) is a phosphoprotein known as an adhesive bone matrix protein. Recent studies have shown that OPN plays an important role in lymphocyte migration, granuloma formation, and interleukin 12 (IL-12) production. The present study investigated expression and the pathophysiological role of OPN in CD.
Methods: Plasma OPN concentration was measured by enzyme linked immunosorbent assay. Expression of OPN in human intestinal mucosa was determined using reverse transcription-polymerase chain reaction and western blot, and localisation of OPN was examined by immunohistochemistry. Expression of integrin β3, an OPN receptor, on lamina propria mononuclear cells (LPMC) was assessed by flow cytometry. Functional activation of OPN in LPMC was investigated by measuring the production of cytokines.
Results: Plasma OPN concentration was significantly higher in patients with CD compared with normal controls or patients with ulcerative colitis (UC). OPN was upregulated in intestinal mucosa from UC and CD patients. OPN producing cells were epithelial or IgG producing plasma cells, or partial macrophages. OPN was detected in areas surrounding granuloma from mucosa in CD. Integrin β3 expressing macrophages infiltrated inflamed mucosa in UC and CD; in contrast, there was no expression of integrin β3 on intestinal macrophages in normal mucosa. OPN induced production of IL-12 from LPMC in CD but not in normal controls or UC.
Conclusions: Increased OPN expression facilitates cytokine production and is closely involved in the Th1 immune response associated with CD.
- CD, Crohn’s disease
- CDAI, Crohn’s disease activity index
- UC, ulcerative colitis
- IFN-γ, interferon γ
- TNF-α, tumour necrosis factor α
- PBMC, peripheral blood mononuclear cells
- LPMC, lamina propria mononuclear cells
- LPT, lamina propria T cells
- TLR, toll like receptor
- LPS, lipopolysaccharide
- OPN, osteopontin
- IL, interleukin
- FITC, fluorescein isothiocyanate
- ELISA, enzyme linked immunosorbent assay
- BSA, bovine serum albumin
- PBS, phosphate buffered saline
- RT-PCR, reverse transcription-polymerase chain reaction
- osteopontin
- Crohn’s disease
- ulcerative colitis
- Th1 immune response
Statistics from Altmetric.com
- CD, Crohn’s disease
- CDAI, Crohn’s disease activity index
- UC, ulcerative colitis
- IFN-γ, interferon γ
- TNF-α, tumour necrosis factor α
- PBMC, peripheral blood mononuclear cells
- LPMC, lamina propria mononuclear cells
- LPT, lamina propria T cells
- TLR, toll like receptor
- LPS, lipopolysaccharide
- OPN, osteopontin
- IL, interleukin
- FITC, fluorescein isothiocyanate
- ELISA, enzyme linked immunosorbent assay
- BSA, bovine serum albumin
- PBS, phosphate buffered saline
- RT-PCR, reverse transcription-polymerase chain reaction
Crohn’s disease (CD) is a chronic inflammatory bowel disease characterised by granuloma formation and transmural infiltration of Th1 cells. We previously reported that the production of interleukin (IL)-12 and IL-18 by macrophages was elevated in CD, and that these cytokines synergistically enhanced production of interferon γ (IFN-γ) from lamina propria T cells (LPT).1 IFN-γ, produced by Th1 cells, is thought to facilitate macrophages to induce production of proinflammatory cytokines such as tumour necrosis factor α (TNF-α), IL-1β, and IL-6, and is thus involved in the pathogenesis of CD.2 Indeed, clinical and experimental investigations have confirmed the effectiveness of immunotherapy targeting IL-12, IFN-γ, or TNF-α.3–5 Although the pathophysiology of the effecter phase of CD is beginning to be clarified, the mechanisms for IL-12 production and granuloma formation have yet to be elucidated. Several factors that induce the production of IL-12 from macrophages have been reported, with some of these factors being bacterial in origin (for example, lipopolysaccharide (LPS) and lipoteichoic acid).6 These bacterial factors induce IL-12 production by nuclear factor κB via toll-like receptor (TLR)-MyD88 signalling.7 In addition, the existence of T cell dependent pathways mediated by IFN-γ and CD40L have been reported, and levels of these molecules are elevated in CD LPT.8,9 These events are thought to be involved in amplification of the Th1 response.
Osteopontin (OPN)/Eta-1 has been reported as a new IL-12 inducing factor and has been actively investigated.10 OPN is a phosphoprotein containing an RGD domain, and is predominantly expressed in epithelial cells, activated T cells, macrophages, and osteoblasts.11 OPN is secreted as a soluble protein and, in common with LPS, induces production of IL-12 from murine monocytes. However, OPN differs from LPS in that while OPN suppresses the production of the anti-inflammatory cytokine IL-10, LPS enhances its production. The reason for this is that whereas both TLR for LPS and integrin αvβ3 for OPN induce production of IL-12 via activation of nuclear factor κB, OPN suppresses the production of IL-10 via another receptor, CD44.10 Furthermore, expression of OPN has been confirmed in patients with granulomatous diseases such as tuberculosis,12 silicosis,13 or sarcoidosis.13,14 Hence OPN should play an important role in granuloma formation because it induces not only the production of cytokines but also migration of monocytes and macrophages. This has been supported by in vivo experiments; aseptic subcutaneous injection of OPN leads to accumulation of macrophages15,16 while the formation of granulomas is significantly low in OPN deficient mice.10
In this study, we investigated expression of OPN and its functional role in intestinal mucosa in CD.
MATERIALS AND METHODS
Antibodies and reagents
Purified antihuman OPN mAb (MPIIIB10, mouse IgG1) was purchased from Developmental Studies Hybridoma Bank (Iowa City, Iowa, USA). Purified antihuman CD3 (polyclonal, rabbit Ig), CD20 mAb (L26), and antihuman CD68 mAb (PG-M1) were purchased from Dako (Glostrup, Denmark). Purified antihuman CD38 mAb (SPC32) was purchased from Novocastra Laboratories (Newcastle, UK). Isotype matched mouse IgG1 mAb (MOPC-31C), fluorescein isothiocyanate (FITC) conjugated antihuman CD33 mAb (HIM3–4), and PE conjugated antihuman integrin αvβ3 mAb (RUU-PLF12) were purchased from BD Pharmingen (San Diego, California, USA). Purified antihuman IgM (polyclonal, rabbit Ig), antihuman IgA (polyclonal, rabbit Ig), and antihuman IgG (polyclonal, rabbit Ig) were purchased from ScyTek Laboratories (Logan, Utah, USA). Purified antihuman IgG1, IgG2, IgG3, and IgG4 (affinity purified, sheep IgG) were purchased from Binding Site (Birmingham, UK). Purified antihuman β-actin IgG (AC-74) was purchased from Sigma-Aldrich (St Louis, Missouri, USA). Native OPN was purchased from Sangi Co. (Sapporo, Japan).
Patients and samples
Mucosal samples were obtained from inflamed and non-inflamed areas of intestinal mucosa from 30 patients with CD (25 surgical specimens and five biopsy specimens; 30 inflamed and 15 non-inflamed specimens) and from 35 patients with ulcerative colitis (UC) (28 surgical specimens and seven biopsy specimens; 35 inflamed and 20 non-inflamed specimens). The primary site of CD involvement was the ileum in seven patients, ileocolonic in 17, and the colon in six. As a normal control, mucosal samples were obtained from macroscopically and microscopically unaffected areas of 25 colonic and ileal specimens from patients with colon cancer who underwent surgery. Histopathological examination revealed no malignancy or inflammation in these control samples. As an inflammatory control, mucosal samples were obtained from inflamed mucosa of patients with intestinal tuberculosis. The mucosa was prepared immediately after stripping away the underlying submucosa by blunt dissection. In the CD group, disease activity was defined using the Crohn’s disease activity index (CDAI) and endoscopic and histopathological data. In the UC group, disease activity was defined by the Lichtiger index17 and endoscopic (Matts grade) and histopathological data. Informed consent was obtained from all patients prior to the study.
Measurement of plasma OPN
Plasma levels of full length OPN were measured by sandwich enzyme linked immunosorbent assay (ELISA), as previously described.18 Microtitre plates with 96 wells were coated with purified anti-OPN4 antibody (20 μg/ml, 100 μl in volume, in 0.1 M carbonate buffer, pH 9.5) at 4°C overnight, then blocked with 1% bovine serum albumin (BSA) in phosphate buffered saline (PBS) containing 0.05% NaN3 (referred to as blocking buffer). Samples and purified OPN-a derived from CHO cells as a standard OPN were diluted with dilution buffer (1% BSA in PBS containing 0.05% Tween 20), added to the plates (100 μl/well), and incubated for one hour at 37°C. After extensive washing with PBS containing 0.05% Tween 20 (washing buffer), 100 μl of 2 ng/ml horseradish peroxidase labelled anti-OPN1 antibody was added to each well and incubated for 30 minutes at 37°C. After nine washes with washing buffer, 100 μl of tetramethyl benzidine buffer as a substrate was added to each well and incubated for 30 minutes at room temperature in the dark. Colour development was stopped by addition of 100 μl of stop solution (1 N H2SO4). A plate reader was used to quantify the signal at 450 nm.
Immunohistochemistry
Tissues were paraffin embedded using standard techniques. Masked antigens were retrieved by microwaving for 20 minutes in 1 mM EDTA buffer (pH 8.0). Tissue sections were processed for immunofluorescence as described previously.1 Sections were incubated for 1 hour at room temperature with anti-CD3 mAb, anti-CD20 mAb, anti-CD38 mAb, or anti-CD68 mAb, followed by a one hour incubation at room temperature with goat antimouse IgG coupled with Alexa Fluor 488 (1 μg/ml) (Molecular Probe, Eugene, Oregon, USA). Sections were then incubated for one hour at room temperature with Alexa Fluor 546 conjugated mouse antihuman OPN antibodies (MP-IIIB) (conjugated by Zenon Mouse IgG1 Labeling Kit; Molecular Probes). Antibodies were diluted in PBS containing 0.3% Triton X-100. Non-specific staining was controlled by incubation with mouse IgG1 or IgG3 rather than the specific primary antibody. All steps were followed by a wash in three changes of PBS for five minutes. Sections were mounted with glycerol/PBS with p-phenylenediamine, and colocalisations of Alexa Fluor 488 and 566 were examined using a confocal fluorescence microscope (LSM 410 inverted laser scan microscope; Carl Zeiss, Jena, Germany).
To quantify the percentage of OPN expressing cells in the plasma cell subset, four different high power fields from each of four different sections were analysed. The total number of plasma cell subset (green) and the number of OPN expressing plasma cells (yellow) were counted for each field. The percentages of OPN expressing cells/plasma cell subset for each sample were calculated.
Isolation of lamina propria mononuclear and epithelial cells from intestinal mucosa
Lamina propria mononuclear cells (LPMC) were isolated from surgically resected intestinal specimens using enzymatic techniques, as previously described.1 Briefly, the dissected mucosa was incubated in calcium and magnesium free Hank’s balanced salt solution containing 2.5% fetal bovine serum and 1 mM dithiothreitol (Sigma-Aldrich) to remove mucus. The mucosa was then incubated in medium containing 1 mM EDTA (Sigma-Aldrich) for one hour at 37°C, twice. During this treatment, intraepithelial lymphocytes and epithelial cells were released from the tissue, and tissues containing LPMC were collected and incubated in medium containing 1 μg/ml collagenase type III (Worthington Biochemical Corp., Freehold, New Jersey, USA) for one hour at 37°C. The fraction was pelleted twice and resuspended in 3 ml of 40% Percoll (Pharmacia Biotech, Piscataway, New Jersey, USA), which was then layered over 60% Percoll before centrifugation at 200 g for 30 minutes at 18°C. Cells in the top 40%/60% layer interface contained >95% pure LPMC. For isolation of colonic epithelial cells, supernatants after EDTA treatment were washed twice, pelleted, and resuspended in 3 ml of 0% Percoll. Layers of 60%, 40%, and 30% Percoll (3 ml) were layered successively on top before centrifugation at 200 g for 30 minutes at 4°C. Cells in the top 0/30% layer interface contained >95% pure viable epithelial cells. The purity of the resulting epithelial cells and LPMC was confirmed by flow cytometry
Real time reverse transcription-polymerase chain reaction (RT-PCR) analysis for human osteopontin mRNA
Total RNA was isolated from 1×10⁷ freshly purified LPMC and epithelial cells using RNeasy columns (Qiagen, Valencia, California, USA), according to the manufacturer’s instructions. First strand cDNA was synthesised from 2 μg of total RNA with oligo (dT) primer using an Omniscript RT kit (Qiagen). Real time PCR was done with an ABI Prism 7700 sequence detection system (Applied Biosystems, Foster City, California, USA). Taqman probes and primer for OPN and β-actin were purchased from Applied Biosystems. We calculated values on the basis of standard curves generated for each gene. Samples were normalised by dividing the number of copies of OPN cDNA by the number of copies of β-actin cDNA.
Western blot analysis
Whole cell lysates were prepared with lysis buffer (0.5% NP40, 10 mM Tris, 150 mM NaCl, 1 mM EDTA, 1 mM PMSF, 1 μg/ml aprotinin, 1 μg/ml leupeptin, 500 μM Na2VO4, 10 mM NaF). Cells were incubated over ice for 20 minutes and centrifuged at 10 000 g at 4°C for 10 minutes. The supernatant was collected and protein concentration was determined with Bio-Rad protein reagent (Bio-Rad Laboratories, Hercules, California, USA). Proteins (standardised to 20 μg of total protein/lane) were separated on NuPAGE 4–12% Bis-Tris gels (Novex pre-cast mini gels; Invitrogen, Carlsbad, California, USA) at 200 V for 50 minutes in the presence of NuPAGE MOPS SDS running buffer (Invitrogen). Separated proteins were transferred to PVDF membranes (Bio-Rad Laboratories) at 25 V for one hour using a Novex XCell II blotting apparatus in NuPAGE transfer buffer. Membranes were washed twice for 10 minutes each with TBS containing 0.01% Tween-20 (TBS-T), and incubated in 5% non-fat dry milk in TBS-T for two hours at room temperature. The primary antibody was diluted in TBS-T and incubated overnight at 4°C on an orbital shaker. Membranes were subsequently washed and incubated with an antimouse IgG conjugated horseradish peroxidase (1:2000) for 1.5 h at room temperature, also on an orbital shaker. Finally, membranes were washed and incubated with 6.5 ml/membrane of enhanced chemiluminescence detection reagent (Amersham Life Science, Arlington Heights, Illinois, USA) for one minute at room temperature and exposed to X-OMAT autoradiography film with intensifying screens for 15–30 seconds.
Flow cytometric analysis
Flow cytometric analysis was performed as previously described.1 Viable macrophage populations were gated using forward scatter/side scatter and negative staining of propidium iodide. For staining of freshly isolated cells, 1×10⁶ cells were incubated with FITC conjugated anti-CD33 mAb and PE conjugated antihuman integrin αvβ3 mAb or isotype matched mouse IgG mAb for 20 minutes on ice. After washing, fluorescence intensity on the surface of the cells was analysed using a FACS Callibur (Becton Dickinson, Mountain View, California, USA).
Activation of monocytes and lamina propria macrophages after stimulation with OPN
Purified peripheral blood mononuclear cells (PBMC) or LPMC (5×10⁴ per well) were stimulated with OPN (25 μg/ml) or LPS (50 ng/ml) in 96 well microtitre plates for 60 hours in the presence or absence of IFN-γ (500 U/ml; Shionogi Pharmaceutical Co., Osaka, Japan), TNF-α (10 ng/ml; R&D, Minneapolis, Minnesota, USA), IL-5 (5 ng/ml; R&D), or IL-13 (25 ng/ml; R&D). After incubation, supernatants were collected and concentrations of IL-12 p40 and IL-10 were determined by ELISA (Biosource, Sunnyvale, California, USA) according to the manufacturer’s instructions.
Statistical analysis
Results are expressed as mean (SEM). Groups of data were compared using the Mann-Whitney U test. Statistical significance was established at p<0.05.
RESULTS
Plasma OPN concentration
As shown in fig 1A, plasma OPN concentration in normal controls ranged from 850 to 1922 ng/ml, with an average of 1198 ng/ml, whereas it was significantly (p = 0.042) higher in the plasma of CD patients, ranging between 1206 and 3349 ng/ml (mean 2078). Moreover, a significant correlation (r2 = 0.68, p = 0.003) was observed between plasma OPN concentration and disease activity, as determined by CDAI in patients with CD (fig 1B). Plasma OPN concentration in UC patients (range 598–2598; mean 1493 ng/ml) was also higher than that of normal controls but no significant difference was found between UC patients and normal controls (fig 1A). There seemed to be a positive correlation between plasma OPN concentration and UC disease activity, as determined by Lichtiger scoring, but this was not statistically significant (r2 = 0.34, p = 0.07) (fig 1C).

(A) Plasma osteopontin (OPN) concentrations in normal controls (NL, n = 10), in patients with ulcerative colitis (UC, n = 10), and in patients with Crohn’s disease (CD, n = 10) were measured using a human OPN specific ELISA. Plasma OPN concentration was significantly higher in CD (p = 0.042 v NL; p = 0.0046 v UC). (B) Correlation between plasma OPN concentration and disease activity, determined by the Crohn’s disease activity index (CDAI) in CD. To assess the correlation between plasma OPN concentration and CDAI, Pearson’s correlation coefficient test was used. A significant correlation between plasma OPN concentration and CDAI in CD patients was observed. (C) Correlation between OPN concentration and disease activity, determined by the Lichtiger index in UC. Although there was a weak correlation, this was not statistically significant.
OPN mRNA and protein expression in mucosa
As OPN has been reported to be prominently expressed in bone and at epithelial surfaces in normal tissue,19 we first examined expression levels of OPN mRNA in intestinal epithelial cells purified from normal controls, UC (UCa, active inflammation; UCi, inactive inflammation) and CD (CDa, active inflammation; CDi, inactive inflammation). OPN transcripts were detected in all groups but the presence of inflammation did not affect expression levels (fig 2A). There was no difference in OPN expression at the protein level among the three groups (data not shown).

(A) Osteopontin (OPN) expression in intraepithelial lymphocytes (IEC). OPN mRNA transcripts were determined in isolated IEC from normal controls (NL) and from patients with ulcerative colitis (UCa active inflammation; UCi inactive inflammation) and Crohn’s disease (CDa active inflammation; CDi inactive inflammation) by real time reverse transcription-polymerase chain reaction. There were no differences of OPN mRNA transcripts in IEC with or without inflammation. (B) OPN expression in lamina propria mononuclear cells (LPMC). OPN mRNA transcripts were also determined in isolated LPMC from NL, UC, and CD. LPMC from UCa and CDa expressed higher levels of OPN mRNA. Values were normalised to the housekeeping gene β-actin. (C) OPN protein expression was determined by western blot analysis. LPMC from UCa and CDa expressed higher levels of OPN protein. Equal loading was confirmed by equal β-actin levels.
Next we examined mRNA expression of OPN in purified LPMC. Consistent with previous reports that activated T cells and macrophages can produce OPN, the transcripts were detected in normal LPMC, which contained activated immune cells (fig 2B). Although LPMC from uninflamed parts of UC and CD samples expressed similar levels of OPN to normal LPMC, expression of OPN mRNA was significantly upregulated in LPMC from inflamed areas of UC and CD patients. This difference was further confirmed at the protein level by western blot analysis. As shown in fig 2C, OPN protein levels in LPMC from inflamed lesions in UC and CD were significantly higher than those from uninflamed parts. However, no significant difference was observed between UC and CD specimens at either the transcriptional or protein level. We also examined whether OPN expression differed between the ileum and colon in active CD. However, as shown in fig 2B and 2C, we did not detect any significant difference at the transcriptional or protein level in the presence of inflammation.
Localisation of OPN in normal and inflamed intestinal mucosa
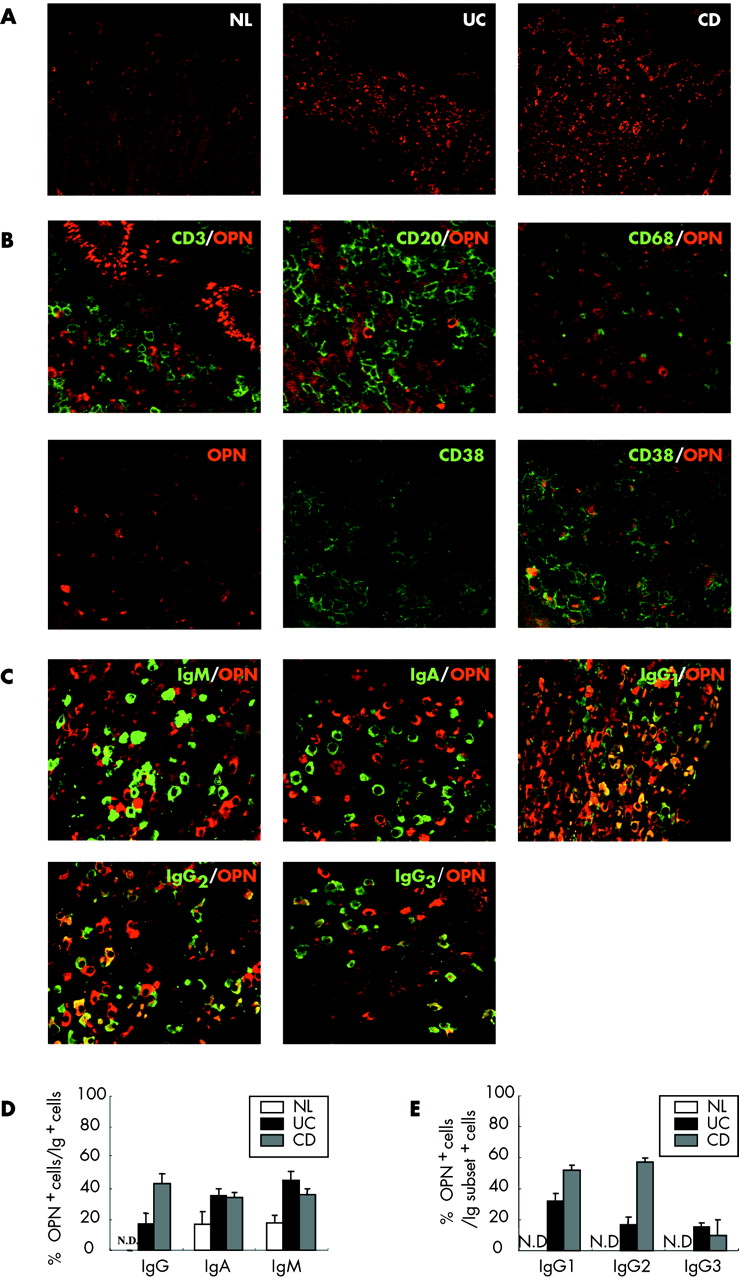
To more precisely identify the localisation and the cellular source of OPN, we performed immunohistochemical analysis. At low magnifying power (fig 3A), we demonstrated that normal intestinal epithelial cells showed widespread but relatively weak staining for OPN, while clearly positive cells were scattered in the lamina propria of normal mucosa. In contrast, there were significantly more OPN+ cells in the lamina propria of CD and UC mucosa, consistent with the data shown in fig 2B and 2C. These increased numbers of OPN+ cells in the lamina propria may contribute to the high OPN plasma levels in inflammatory bowel disease patients, especially in CD.

(A) Confocal imaging of colonic mucosa in normal controls (NL) and in patients with ulcerative colitis (UC) and Crohn’s disease (CD), stained with anti-osteopontin (OPN) mAb. The numbers of OPN expressing cells (red) were higher in the lamina propria in UC and CD compared with NL. (B) Expression of OPN protein (red) on lamina propria T cells (CD3; green), B cells (CD20; green), macrophages (CD68; green), and plasma cells (CD38; green) in CD. OPN was expressed in plasma cells but not in T or B cells. A small population of lamina propria macrophages expressed OPN. (C) Expression of OPN protein in plasma cell subsets (green). Most OPN was expressed in IgG1 or IgG2 cells in lamina propria in CD. (D) Percentage of OPN expression in plasma cell immunoglobulin subsets in lamina propria in NL, UC, and CD. (E) Percentage of OPN expression in plasma cell IgG subsets in lamina propria in NL, UC, and CD. N.D., not detected.
To characterise OPN+ cells in the lamina propria, double immunofluorescent staining with antibodies for T cells (CD3), B cells (CD20), and macrophages (CD68) was performed using CD specimens (fig 3B). OPN+ cells were not stained with anti-CD3 mAb or anti-CD20 mAb, while a small fraction of CD68 positive cells were double positive for OPN. Because most of the CD68 negative OPN+ cells resembled plasma cells morphologically, we next performed double staining with anti-CD38 mAb, which clearly demonstrated that most OPN+ cells were eventually plasma cells.
Then, to assess which type of plasma cells expressed OPN, we performed double staining for IgM, IgA, and IgG with OPN. Most of the OPN expressing plasma cells were IgG+, and only a few were IgM+ or IgA+ (fig 3C). Neither IgD+ nor IgE+ plasma cells expressed OPN (data not shown). In addition, we investigated the subclasses of OPN positive IgG plasma cells. Most OPN expressing IgG+ plasma cells were IgG1+ and IgG2+, while a few were positive for IgG3+ (fig 3C). It was difficult to determine whether OPN was expressed in IgG4+ plasma cells because of the scarcity of these cells (data not shown).
Figure 3D shows the positive rate of OPN expression in IgG, IgA, and IgM plasma cells. The abundant infiltration of IgG plasma cells is one of the histological characteristics of inflammatory bowel disease and OPN expressing IgG+ plasma cells were much higher in inflammatory bowel disease, especially in CD, compared with control samples. Furthermore, when IgG plasma cells were divided into subclasses, OPN producing IgG2 cells were less in UC than in CD (fig 3E); this result was due to the low numbers of IgG2 cells in UC lamina propria, as previously reported.20,21
OPN expression in granuloma
As OPN has been reported to play a pivotal role in granulomatous response,10 its expression was further assessed in inflamed CD lesions with granuloma formation. OPN expressing cells could not be seen in the centre of granulomas consisting of macrophages, epithelioid cells, and multinucleated giant cells. However, OPN expression was widespread, surrounding the granuloma, and again double immunofluorescent analysis showed that most of these cells were plasma cells, not T cells or macrophages (fig 4A and data not shown). To assess OPN expression in granulomas of different aetiologies, we also examined the mucosa of intestinal tuberculosis (fig 4C). OPN was again expressed in the tissue surrounding the granuloma but not in the granuloma itself.
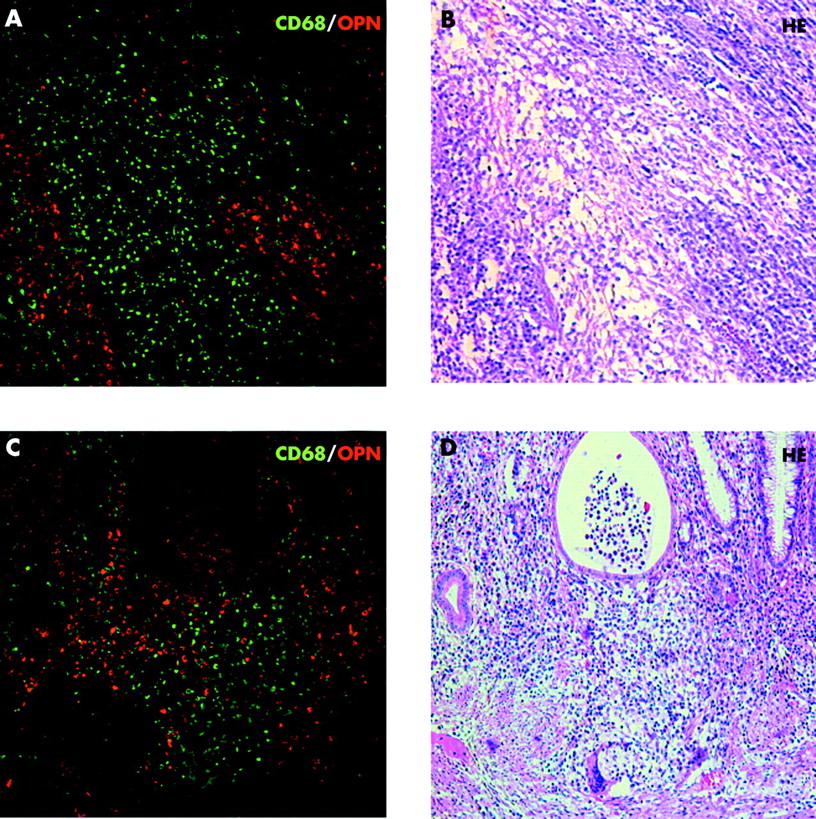
(A, B) Confocal imaging of the mucosa in Crohn’s disease (CD). CD68+ macrophages (green) were aggregated in granuloma. Osteopontin (OPN) expressing cells (red) were not in the granuloma but in the surrounding area. A, immunohistochemistry; B, haematoxylin-eosin stain. (C, D) Confocal imaging of the mucosa in intestinal tuberculosis. OPN expressing cells were also not in the granuloma but in the surrounding tissue. C, immunohistochemistry; D, haematoxylin-eosin statin.
Integrin β3 (OPN receptor) expression on intestinal macrophages
Next we focused on expression of integrin β3, an OPN receptor, which has been reported to be essential for OPN signalling towards Th1 cytokine expression.10 Integrin β3 expression on PBMC was first examined using flow cytometry. CD33 was used as a monocyte/macrophage surface marker because CD14 is downregulated in intestinal macrophages.22 As shown in fig 5, peripheral blood monocytes constitutively expressed integrin β3 (range 95.1–98.5%; mean 97.5%). In contrast, integrin β3 expression was dramatically downregulated in macrophages in NL LPMC (range 9.1–25.0%; mean 17.82%). However, approximately half of intestinal macrophages from UC (range 33.2–60.9%; mean 49.1%) or CD (range 39.1–64.6%; mean 49.5%) lamina propria expressed integrin β3. This expression pattern was reminiscent of CD14 antigen, which is also upregulated on LPMC in inflammatory bowel disease.22

Expression of integrin β3 on freshly isolated lamina propria macrophages from normal controls (NL), and from patients with ulcerative colitis (UC) and Crohn’s disease (CD). Integrin β3 was downregulated on lamina propria macrophages in NL but significantly upregulated on those in UC and CD. Integrin β3 was constitutively expressed on peripheral blood monocytes. The numbers in each quadrant represent percentages of the populations. Data shown are representative of six experiments (NL (n = 6), UC (n = 6), and CD (n = 6)).
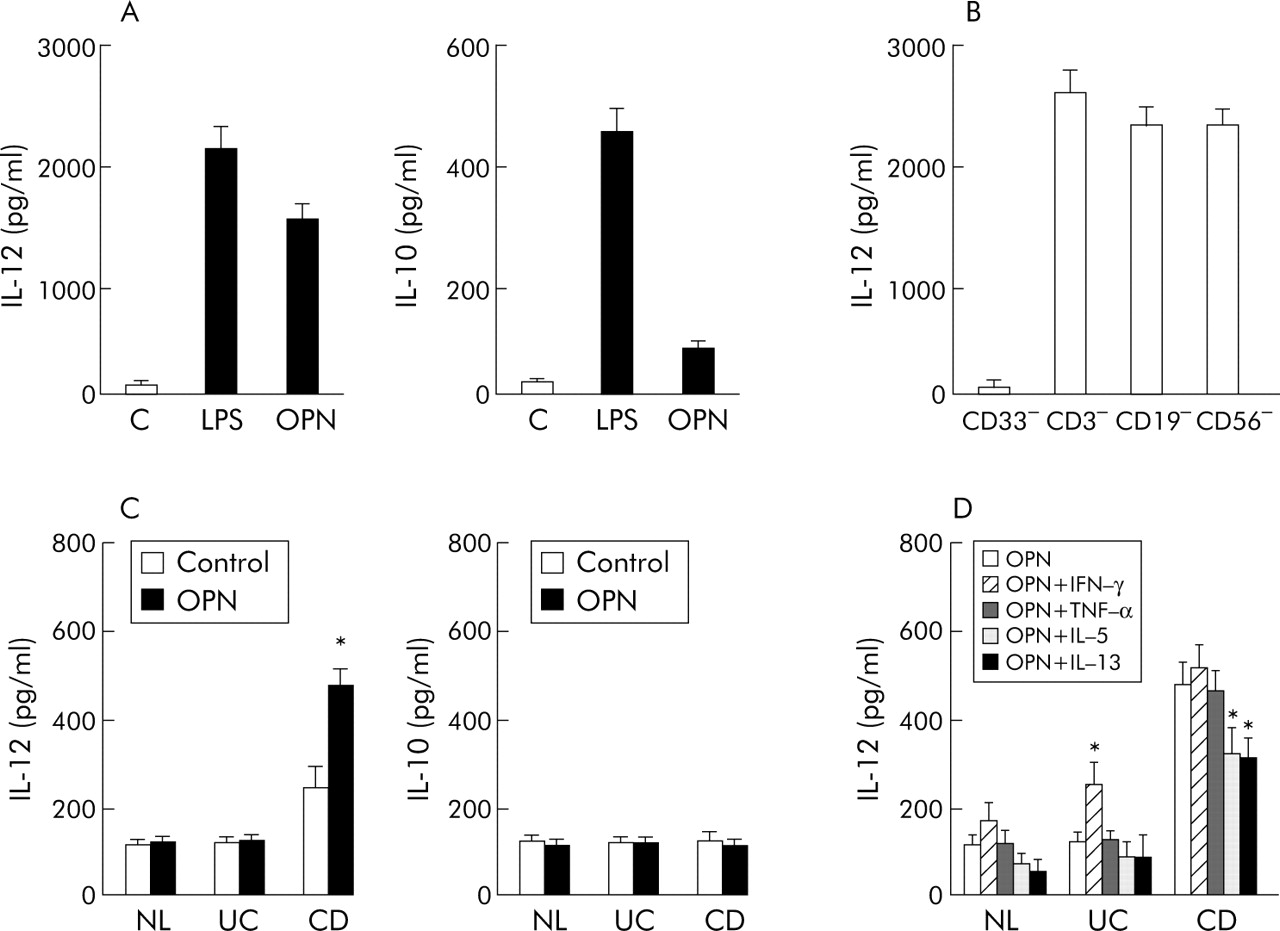
OPN enhanced IL-12 production only in CD LPMC
As shown in fig 6A, native OPN induced IL-12 production from PBMC. The quantity of OPN stimulated IL-12 production was comparable with that induced by LPS. On the other hand, OPN had a much weaker effect on IL-10 induction than LPS. To identify the cellular source of IL-12 in PBMC, we stimulated magnetically depleted cells; monocytes (CD33), T cells (CD3), B cells (CD19), and NK cells (CD56) by OPN (fig 6B). We found that monocytes were the only source of IL-12 in response to OPN among PBMC. The same experiments were also performed with CD and UC PBMC, and the results were not significantly different from those of normal PBMC (data not shown).

(A) Cytokine production of peripheral blood mononuclear cells (PBMC). Lipopolysaccharide (LPS) significantly induced inteleukin (IL)-12 and IL-10 production from PBMC. In contrast, osteopontin (OPN) significantly induced IL-12 production but induced a small amount of IL-10. (B) OPN induced IL-12 from T cells (CD3), B cells (CD19), or NK (CD56) depleted cells, but not from monocytes (CD33) depleted cells. (C) Cytokine production of lamina propria mononuclear cells (LPMC) obtained from normal controls (NL, n = 5), and from patients with ulcerative colitis (UC, n = 10) and Crohn’s disease (CD, n = 10) induced with or without OPN 25 μg/ml. LPMC from inflamed mucosa in CD produced higher amounts of IL-12 than those from NL or UC. IL-12 production was significantly (*p<0.05) induced by OPN only in LPMC from inflamed mucosa in CD. There were no differences in IL-10 production among NL, UC, and CD with or without OPN. (D) IL-12 production from NL (n = 5), UC (n = 5), and CD (n = 5). Interferon γ (IFN-γ) significantly induced IL-12 production in LPMC from UC in the presence of OPN. IL-5 and IL-13 inhibited IL-12 production in LPMC from CD. *p<0.05.
We then examined the effects of OPN stimulation on LPMC. As shown in fig 6C, LPMC purified only from CD, but not from UC or normal controls, produced IL-12 spontaneously; OPN enhanced IL-12 production from these CD LPMC. In contrast, OPN did not induce IL-12 production in any other group of LPMC. IL-10 production could not be detected in any LPMC, with or without OPN stimulation.
Given that integrin β3 expression of UC macrophages was similar to that of CD, OPN induced IL-12 production may require some cofactors, which may be lacking in UC. To examine this possibility, we stimulated LPMC with OPN in the presence or absence of several cytokines: IFN-γ, TNF-α, IL-5, or IL-13. As shown in fig 6D, exogenous IFN-γ with OPN enhanced IL-12 production from LPMC in UC whereas it had no additional effect on OPN induced IL-12 production in CD. TNF-α, another proinflammatory cytokine, had no effect in either group. In contrast, addition of IL-5 or IL-13, which are two of the known key cytokines in UC, to OPN significantly diminished IL-12 production in CD LPMC. In the presence of each cytokine alone, IL-12 was not produced from LPMC in any group (data not shown). These results suggest that the difference in responses to OPN between CD and UC LPMC could be explained in part by the different cytokine environments characteristic of the diseases.
DISCUSSION
Although the pathogenesis of CD remains unknown, non-caseating granuloma, the hallmark of the Th1 immune response, is deeply involved; and increased production of IL-12 lies at the root of this disease.2 OPN has recently been found to play an important role in inducing IL-12 production and granuloma formation, and many studies have focused on Th1 diseases, such as multiple sclerosis and rheumatoid arthritis.23,24 However, the role of OPN in mucosal responses and intestinal inflammation is little understood. In this study, we showed that plasma OPN levels were significantly higher in CD. In contrast, plasma OPN concentrations in UC were not statistically higher compared with normal controls. This is the first study to describe increased plasma OPN concentrations in a human chronic inflammatory bowel disease.
To clarify the cellular sources of increased plasma OPN in CD patients, we examined OPN expression in intestinal mucosa utilising multiple approaches. We confirmed that OPN was constitutively expressed in intestinal epithelial cells, as reported by Brown and colleagues,19 although its expression was found to be relatively weak in our immunohistochemical study. Intensity of staining was not different between inflamed and uninflamed mucosa in inflammatory bowel disease. A recent study showed that OPN is upregulated in colonic cancer cells compared with normal colonic epithelial cells, and that it contributes to increased plasma OPN concentrations.25,26 However, our study suggested that epithelial cells were not the main source of the high OPN levels in plasma in inflammatory bowel disease patients.
Next we examined OPN expression in freshly isolated LPMC, and clearly demonstrated increased OPN expression in LPMC from inflamed mucosa in inflammatory bowel disease, at both the mRNA and protein levels. Gassler et al showed that expression of OPN was not changed between inflammatory bowel disease patients and normal controls.27 This difference may result from the methods of sample preparation; that is, they examined biopsy samples while we examined freshly isolated LPMC. Because of the rich amount of OPN from epithelial cells, especially in the small intestine,19 it might have been difficult to detect differences in OPN expression in LPMC from biopsy samples.
To assess which type of cells produced OPN, we used immunohistological analysis. We clearly demonstrated that most OPN producing cells were plasma cells, and that there was a fraction of macrophages in the intestinal mucosa, as reported in previous studies.27 Furthermore, we showed for the first time that most OPN producing plasma cells were IgG producing cells, and that few IgA producing cells were positive for OPN. It is well established that IgA plasma cells dominate in non-inflammatory conditions, while marked infiltration of IgG plasma cells is one of the characteristics of inflammatory bowel disease. This fact may reflect the increased OPN expression in inflammatory bowel disease lamina propria. We also demonstrated that the frequency of OPN positive cells in IgG producing plasma cells was higher in CD than in UC. These OPN expression patterns in plasma cells may contribute to the increased plasma OPN levels in inflammatory bowel disease, especially in CD patients.
Although OPN has been reported to play an essential role in granulomatous formation, its expression in granuloma itself is still controversial. Initially, OPN has been reported to be expressed in macrophages within granulomas from pulmonary tuberculosis,12 while more recent studies have shown that OPN is expressed in T cells around granulomas rather than within granulomas.13 We could not detect OPN expression immunohistochemically in macrophages within granulomas in CD or in intestinal tuberculosis. However, we clearly showed that an abundance of OPN expressing plasma cells surrounded intestinal granulomas. Recently, it has been shown that granuloma formation is weak in B cell deficient mice and that the involvement is independent of an inability to secrete antibodies.28 Sequential pathological studies suggested that accumulation of lymphocytes and plasma cells caused the influx of macrophages, which resulted in epithelioid cell and granuloma formation.29,30 Because OPN is involved in granuloma formation through its migration effect,31 our results suggest that OPN secreting plasma cells play a central role in this milieu. Further studies are needed to clarify the role of plasma cells, major players in the humoral immune response, in granulomatous formation, which is the hallmark of the cellular immune response.
Ashkar and colleagues10 have reported that OPN enhanced the production of IL-12 by murine macrophages, and this was followed by our study in human monocytes and by Koguchi and colleagues.32 In this study, we demonstrated that OPN induced production of IL-12 but not IL-10 from monocytes purified from PBMC, while LPS induced both cytokines. This pattern was also seen in monocytes purified from CD or UC PBMC. However, when the same experiments were performed with LPMC, IL-12 induction by OPN could only be detected from CD LPMC, and not from normal or UC LPMC. This difference was in part explained by differences in integrin β3, an OPN receptor, expression. We demonstrated that macrophages did not express integrin β3 in normal mucosa, while they did in CD and UC lamina propria. This pattern corresponded to that seen for CD14, part of the LPS receptor, on monocytes/macrophages. CD14 expression was downregulated in normal mucosa in contrast with peripheral blood, but was upregulated in both CD and UC inflamed mucosa.22 However, Monteleone et al have reported that only CD LPMC could respond to LPS and produce IL-12,33 which again corresponds to the difference in OPN/integrin β3 expression shown in this study. Why is there a difference in IL-12 production induced by OPN between UC and CD? Are there any indispensable cofactors? The difference could not be explained by IL-10 as IL-10 production did not occur in OPN stimulated LPMC in any group. To further examine the issue, we evaluated the effect of other cytokines which are selectively higher in UC or CD in vivo. IFN-γ, which is reported to be higher in CD,9,34,35 enhanced IL-12 production by OPN stimulated LPMC in UC. In contrast, IL-5 and IL-13, which are reported to be higher in UC,9,34,35 diminished OPN induced IL-12 production in CD. These results suggest that Th1/Th2 status in vivo can affect OPN induced IL-12 production by LPMC. Recently it has been shown that NOD2 mutation in CD patients can enhance peptidoglycan induced IL-12 production.36 Thus some genetic factors may also be the cause of the difference in OPN induced IL-12 production. It would be of interest to make comparisons between CD monocytes/macrophages with or without the NOD2 mutation. However, this could not be undertaken because the NOD2 mutation is not seen in the Japanese population, as we reported previously.37 Further studies, including a search for other possible genetic factors, are needed to clarify this central issue in the pathogenesis of CD.
In conclusion, our results indicate that plasma cells in inflammatory bowel disease inflamed intestinal mucosa produce OPN, and they may serve as a potent IL-12 inducing factor for intestinal mucosal macrophages in CD. Thus OPN may play an important role in the Th1 cytokine environment essential for chronic inflammation in CD, and so could be a therapeutic target.
Acknowledgments
We thank Drs Masaki Kitajima, Masahiko Watanabe, Hirotoshi Hasegawa, and Akira Sugita for providing specimens. This work was supported in part by grants in aid from the Japanese Ministry of Education, Culture, and Science, and from the Japanese Ministry of Health and Welfare.
REFERENCES
Footnotes
-
Conflict of interest: None declared.