Article Text

Abstract
Background: In coeliac disease (CD) mucosa, the histological lesion is associated with marked infiltration of T helper cell type 1 (Th1) cells. However, the molecular mechanisms which regulate Th1 cell differentiation in CD mucosa are unknown.
Aims: To analyse expression of transcription factors which control the Th1 cell commitment in CD.
Patients: Duodenal mucosal samples were taken from untreated CD patients and normal controls.
Methods: Interferon γ (IFN-γ) and interleukin (IL)-4 RNA expression was examined in T lamina propria lymphocytes by quantitative reverse transcription-polymerase chain reaction. T-bet and STAT-4, two Th1 promoting transcription factors, and STAT-6 and GATA-3, transcription factors which govern T helper cell type 2 (Th2) cell polarisation, were examined in duodenal biopsies by western blotting. The effect of gliadin and IFN-γ on expression of T-bet was examined in an ex vivo culture of biopsies taken from normal and treated CD patients.
Results: As expected, IFN-γ but not IL-4 RNA transcripts were increased in the mucosa of CD patients in comparison with controls. CD mucosal samples consistently exhibited higher levels of T-bet than controls. However, no difference in active STAT-4 expression was seen between CD patients and controls, suggesting that Th1 polarisation was not induced by local IL-12. GATA-3 and STAT-6 were also low in both CD and control mucosa. In normal duodenal biopsies, IFN-γ stimulated T-bet through a STAT-1 dependent mechanism. Challenge of treated CD but not control biopsies with gliadin enhanced T-bet and this effect was also inhibited by STAT-1 inhibition.
Conclusions: This study shows that activation of STAT-1 by IFN-γ promotes T-bet in CD mucosa.
- CD, coeliac disease
- Th1, T helper cell type 1
- Th2, T helper cell type 2
- IFN, interferon
- IL, interleukin
- T-LPL, lamina propria T lymphocytes
- EMA, antiendomysial antibodies
- DMSO, dimethylsulphoxide
- PT, peptic-tryptic digest of gliadin
- LPMC, lamina propria mononuclear cells
- coeliac disease
- T-bet
- STAT-1
Statistics from Altmetric.com
- CD, coeliac disease
- Th1, T helper cell type 1
- Th2, T helper cell type 2
- IFN, interferon
- IL, interleukin
- T-LPL, lamina propria T lymphocytes
- EMA, antiendomysial antibodies
- DMSO, dimethylsulphoxide
- PT, peptic-tryptic digest of gliadin
- LPMC, lamina propria mononuclear cells
There is now little doubt that in coeliac disease (CD) the histological lesion is associated with a predominant T helper cell type 1 (Th1) cell response. Lamina propria T lymphocytes (T-LPL) isolated from the intestine of patients with active CD released interferon (IFN)-γ in response to gluten stimulation, and neutralisation of endogenous IFN-γ prevented the gliadin mediated morphological changes in an ex vivo organ culture of treated CD biopsies.1–5 Moreover, we have previously shown that the Th1 cell response in fetal gut explants results in villous atrophy and crypt cell hyperplasia,6,7 thus supporting the role of local Th1 cell inflammation in promoting CD associated tissue damage. Many important questions remain however regarding factors which induce and maintain Th1 cell polarisation in CD. Although the intestinal mucosa of CD patients contains increased amounts of Th1 associated cytokines, such as IFN-α, interleukin (IL)-18, and IL-15, the contribution of each of these cytokines in the ongoing Th1 response remains to be determined.8–10 Similarly, the transcriptional mechanisms that underlie the distinct Th1-type cytokine repertoire in CD remain unknown.
Several studies have clearly demonstrated that distinct cytokine activated signalling and transcription factors regulate the commitment of a naïve T cell along the Th1 or T helper cell type 2 (Th2) phenotype, as well as maintenance of the polarised phenotype.11,12 Transcription factors such as STAT-1 and STAT-4 are associated with IFN-γ production and play a major role in Th1 specific cytokine production.12 Th1 commitment seems to be stable after polarisation and there is a great deal of interest in the changes in chromatin remodelling which allow polarised Th1 cells to maintain their cytokine profile. A molecular analysis of transcription factors expressed in polarised lymphocytes has recently led to the identification of T-bet, a novel member of the T-box family of transcription factors. T-bet drives chromatin remodelling of the IFN-γ locus and is a master switch for Th1 cell development and regulation.13 Increases in T-bet have been reported in patients with Crohn’s disease, another Th1 associated chronic inflammatory disease of the gastrointestinal tract. Moreover, we have previously shown that T-bet RNA transcripts are upregulated in CD mucosa, thus suggesting a role for this transcription factor in promoting the Th1 cell polarisation during this disease.9,14,15 In contrast, transcription factors such GATA-3 and STAT-6 have a major influence on Th2 differentiation and are necessary for expression of IL-4/IL-13 cytokines.11,16,17 The balance between STAT-4/T-bet and STAT-6/GATA-3 thus seems to dictate the fate of T cell polarisation during the immune response.
In this study, we have analysed expression T-bet and active STAT-4, as well as GATA-3 and active STAT-6, in CD.
METHODS
Patients and controls
Biopsy specimens from the distal duodenum of 18 patients with untreated CD (aged 20–47 years) were obtained during upper gastrointestinal endoscopy. The histopathological diagnosis was based on typical mucosal lesions with crypt cell hyperplasia, villous atrophy, and increased number of intraepithelial lymphocytes. All untreated CD patients were positive for antiendomysial (EMA) and antitransglutaminase antibodies at the time of diagnosis. No patient with refractory CD was enrolled in the study. Duodenal biopsies were collected at the time of diagnosis from all 18 patients: one was used from each of these 18 patients for routine histological examination. In 11 of 18 patients, two additional biopsies were collected and immediately frozen in liquid nitrogen and stored until tested for protein expression. Four duodenal biopsies were taken and used for lamina propria CD3+ T-LPL isolation from the remaining seven patients. Biopsies were also obtained from eight treated CD patients (aged 19–30 years) who were in clinical and histological remission, and negative for EMA and antitransglutaminase antibodies. No patient had gluten refractory disease. From these patients, five or more biopsies were collected: one was used for histology and the remaining for organ culture. In three of eight treated CD patients who were consecutively enrolled, an additional biopsy specimen was taken and used for protein extraction. Normal controls (n = 27) were under investigation for gastrointestinal symptoms but had normal histology, no increase in inflammatory cells, and were EMA and antitransglutaminase antibody negative. The study received ethics approval from the local committee.
Organ culture
To examine the regulatory action of IFN-γ on T-bet induction, normal duodenal biopsies were cultured in medium containing RPMI 1640 (Sigma-Aldrich Srl, Milan, Italy) supplemented with HL-1 (Biowhittaker, Walkersville, USA) with or without addition of human recombinant IFN-γ (50 ng/ml) (Prepotech, Inc, London, UK) for 24 hours. As we have previously shown that challenge of normal duodenal biopsies with IFN-γ results in STAT-1 activation,18 normal duodenal biopsies were also cultured with IFN-γ in the presence or absence of Tyrphostin B42 (AG490; Calbiochem, San Diego, California, USA), a JAK2/STAT-1 inhibitor (TB42, 100 μM final concentration), or vehicle (dimethylsulphoxide (DMSO)) for 24 hour and then assessed for T-bet expression. Both TB42 and DMSO were preincubated for one hour before addition of IFN-γ To verify that TB42 specifically inhibits STAT-1 activation, THP1 cell lines were cultured in RPMI 1640 with or without the initial addition of graded doses of TB42 (final concentration ranging from 50 to 200 μM) for 45 minutes and then stimulated with IFN-γ (100 ng/ml) for 30 minutes. At the end, both nuclear and cytosolic protein extracts were prepared and used for analysing nuclear STAT-1 translocation, as previously described.18 We also examined the effect of gliadin stimulation on T-bet expression in biopsies from treated CD. For this purpose, duodenal biopsies taken from five treated CD patients and five normal controls were cultured in medium containing RPMI 1640 (Sigma-Aldrich) supplemented with HL-1 with or without addition of 1 mg/ml peptic-tryptic digest of gliadin (PT) for 24 hours, as previously indicated.18 To investigate if the gliadin modulating activity on T-bet associates relies on JAK/STAT signalling, duodenal biopsies taken from three treated CD patients were cultured with PT in the presence or absence of TB42 (100 μM final concentration) or DMSO for 24 hours.
Biopsies were placed on iron grids in the central well of an organ culture dish and the dishes placed in a tight container with 95%O2/5%CO2 at 37°C, at 1 bar. At the end of the culture, biopsies were snap frozen and stored at −80°C until used.
LPL isolation, RNA extraction, and quantitative polymerase chain reaction (PCR)
Lamina propria mononuclear cells (LPMC) were isolated from duodenal biopsies taken from seven active CD patients and seven normal controls by the dithiothreitol-EDTA-collagenase procedure (all reagents from Sigma-Aldrich). Subsequently, LPMC were used to purify T-LPL by magnetic bead separation, as previously described.19 T-LPL were then used for extracting total RNA using 1 ml of a monophasic solution of phenol and guanidine isothiocyanate and chloroform, followed by isopropanol precipitation (Sigma-Aldrich). The integrity of the RNA was checked by electrophoresis on a 1.5% agarose gel. Quantitative PCR was performed as previously described.6
Protein extraction and western blot analysis
Snap frozen biopsies were mechanically homogenised in liquid nitrogen, and total extracts collected in buffer containing 10 mM Hepes (pH 7.9), 10 mM KCl, 0.4 M NaCl, 1 mM EDTA, 1 mM EGTA, 10% glycerol, 1 mM dithiothreitol, 10 μg/ml aprotinin, 10 μg/ml leupeptin, and 1 mM phenylmethanesulphonyl fluoride (all reagents from Sigma-Aldrich). For detection of T-bet, total proteins (200 μg/sample) were separated by 10% sodium dodecyl sulphate-polyacrylamide gel electrophoresis. A commercially available mouse monoclonal T-bet antibody (Santa Cruz Biotechnology, Inc, Santa Cruz, California, USA) (final dilution 1:500), followed by a horseradish peroxidase conjugated goat antimouse IgG antibody (Dako SpA, Milan, Italy) (final dilution 1:10 000) was used, and the reaction detected with a Super Signal West DURA chemiluminescence kit (Pierce Biotechnology, Rockford, Illinois, USA). GATA-3 was detected using a mouse monoclonal GATA-3 antibody (Santa Cruz Biotechnology, Inc) (final dilution 1:500), followed by a horseradish peroxidase conjugated goat antirabbit IgG antibody (Dako) (final dilution 1:10 000). After detection of T-bet and GATA-3, blots were stripped and incubated with a mouse antihuman β-actin antibody (Sigma; final dilution 1:5000), followed by a goat antimouse antibody conjugated to horseradish peroxidase (final dilution 1:20 000). p-Tyr-STAT-4 and p-Tyr-STAT-6 were detected using rabbit monoclonal antibodies which specifically recognise STAT-4 or STAT-6 phosphorylation on tyrosine residues (Santa Cruz Biotechnology, Inc) (final dilution 1:500). After incubation with a horseradish peroxidase conjugated goat antirabbit IgG antibody (Dako) (final dilution 1:10 000), the reaction was detected with a Super Signal West DURA chemiluminescence kit (Pierce). After detection of phosphorylated STAT-4 and STAT-6, blots were stripped and incubated with a rabbit antihuman total STAT-4 or a rabbit antihuman STAT-6 antibody (Santa Cruz Biotechnology, Inc) (final dilution 1:500) followed by a goat antirabbit antibody conjugated to horseradish peroxidase (Dako) (final dilution 1:10 000).
STAT-1 was analysed in nuclear protein prepared from THP1 cells, as previously described.18 After analysis of STAT-1, the blot was stripped and incubated with a rabbit monoclonal antihuman OCT-1 antibody (Santa Cruz Biotechnology, Inc, 1:500 final dilution) followed by goat antirabbit antibody conjugated to horseradish peroxidase (Dako) (final dilution 1:10 000). In addition, cytosolic proteins prepared from THP-1 cells were analysed for both phosphorylated and total ERK-1 content, using monoclonal mouse antihuman antibodies (Santa Cruz Biotechnology, Inc, 1:600 final dilution) followed by a goat antimouse antibody conjugated to horseradish peroxidase (Dako) (final dilution 1:10.000).
Computer assisted scanning densitometry was used to analyse the intensity of the immunoreactive bands.
Statistical analysis
Data were compared using the Mann-Whitney U test.
RESULTS
IFN-γ and IL-4 RNA transcripts in untreated CD duodenal mucosa
To confirm that the CD lesion is associated with a marked Th1-type immune response, RNA transcripts for IFN-γ and IL-4 were analysed by quantitative PCR using RNA extracted from T-LPL isolated from seven untreated CD patients and seven controls. As shown in fig 1A, the number of IFN-γ transcripts was significantly higher in CD (median 10229 transcripts/μg total RNA (range 8915–14126)) than control T-LPL samples (median 3900 transcripts/μg total RNA (range 500–5142)) (p<0.001, Mann Whitney U test). In contrast, the number of IL-4 transcripts was the same in CD (median 2650 transcripts/μg total RNA (range 500–5980)) and control T-LPL (median 1239 transcripts/μg total RNA (range 500–2120 in controls)) (fig 1B). Overall, in CD T-LPL samples, the number of IFN-γ transcripts was approximately four times higher than that for IL-4, thus confirming the predominance of Th1 committed lymphocytes in the duodenal mucosa of patients with untreated CD.

Interferon γ (IFN-γ) but not interleukin (IL-4) transcripts are increased in T lamina propria lymphocytes (T-LPL) from untreated coeliac disease (CD) patients. IFN-γ (A) and IL-4 (B) RNA transcripts in T-LPL isolated from the duodenum of seven untreated CD patients and seven normal controls. Each point represents the value (number of transcripts/μg total RNA) of IFN-γ or IL-4 in T-LPL taken from a single subject. Horizontal bars indicate median values.
T-bet is overexpressed in CD mucosa
As polarisation of Th1 cells is dependent on activation of STAT-4 and/or T-bet expression, we then looked at these two transcription factors in duodenal biopsies from 11 untreated CD patients, three treated CD patients, and 10 controls. T-bet was consistently detected in all samples regardless of proteins were extracted from CD or normal duodenum. Importantly, immunoreactivity for T-bet was more pronounced in duodenal samples from active CD in comparison with treated CD patients and controls (fig 2A). Analysis of intensity of bands revealed that T-bet expression was significantly higher in untreated CD samples (median 0.55 (range 0.06–2.48)) than controls (median 0.17 (range 0.003–0.24)) (fig 2B) (p<0.001, Mann Whitney U test). In contrast, no difference was seen between treated CD patients and normal controls in terms of T-bet (fig 2).

T-bet but not active STAT-4 predominates in untreated coeliac disease. (A) Representative blot showing T-bet in proteins extracted from duodenal biopsies from three untreated coeliac disease (CD) patients, three treated CD patients, and three controls. (B) Quantitative analysis of T-bet protein in mucosal samples from 11 patients with untreated CD, three treated CD, and 11 normal controls, as measured by densitometry scanning of western blots. Values are expressed in arbitrary units (au). Each point represents the T-bet/β-actin ratio in mucosal samples taken from a single subject. Horizontal bars indicate median values. (C) Representative blot showing phosphorylation of STAT-4 on tyrosine groups (p-Tyr-STAT-4) (top blot) and total STAT-4 (bottom blot) in proteins extracted from duodenal biopsies from three untreated CD patients, three treated CD patients, and three controls. (D) Quantitative analysis of p-Tyr-STAT-4/total STAT-4 ratio in mucosal samples from 11 patients with untreated CD, three treated CD, and 11 normal controls, as measured by densitometry scanning of western blots. Values are expressed in arbitrary units (au). Each point represents the p-Tyr-STAT-4/total STAT-4 ratio in mucosal samples taken from a single subject. Horizontal bars indicate median values.
Activated STAT-4 was detected in all CD and normal controls with no significant differences (median 0.28 (range 0.01–0.75) in CD v 0.21 (0.11–0.52) in controls; NS) (fig 2C, D). Western blotting is not a quantitative technique and arbitrary units may not directly reflect the biological quantities of protein within the duodenal mucosa. However, the fact that the intensity of the T-bet band was increased in most CD samples in comparison with controls suggests that in CD the inflammatory response associates with a predominant induction of T-bet but not STAT-4.
GATA-3 and STAT-6 are not induced in coeliac disease mucosa
Th2 cell development is dependent on activation of STAT-6 and GATA-3. Therefore, we next examined expression of these transcription factors in proteins extracted from the same duodenal samples used for T-bet and STAT-4 analysis. GATA-3 was expressed at the same level in CD and controls (median 0.12 densitometry arbitrary units (range 0.03–0.49) in CD and 0.06 (0.02–0.30) in controls) (fig 3A, B) (NS). Similarly, activation of STAT-6 did not significantly differ between CD patients (median 0.4 densitometry arbitrary units (range 0.02–0.74)) and controls (0.25 (0.06–0.56)) (fig 3C, D).

(A) Representative blot showing GATA-3 in proteins extracted from duodenal biopsies from three untreated coeliac disease (CD) patients and three controls. (B) Quantitative analysis of GATA-3 protein in mucosal samples from 11 patients with untreated CD and 11 normal controls, as measured by densitometry scanning of western blots. Values are expressed in arbitrary units (au). Each point represents the GATA-3/β-actin ratio in mucosal samples taken from a single subject. Horizontal bars indicate median values. (C) Representative blot showing phosphorylation of STAT-6 on tyrosine groups (p-Tyr-STAT-6) (top blot) and total STAT-6 (bottom blot) in proteins extracted from duodenal biopsies from three CD patients and three controls. (D) Quantitative analysis of p-Tyr-STAT-6/total STAT-6 ratio in mucosal samples from 11 patients with active CD and 11 normal controls, as measured by densitometry scanning of western blots. Values are expressed in arbitrary units (au). Each point represents the p-Tyr-STAT-6/total STAT-6 ratio in mucosal samples taken from a single subject. Horizontal bars indicate median values.
In normal duodenal biopsies, IFN-γ/STAT-1 signalling enhances T-bet expression
The fact that IFN-γ is enhanced in CD, together with recent studies which have shown that IFN-γ enhances T-bet in cell lines,20 prompted us to explore the possibility that IFN-γ could regulate T-bet expression in human duodenum. Normal duodenal biopsies were cultured with or without IFN-γ and examined for T-bet by western blotting. As shown in fig 4, IFN-γ induced T-bet. As IFN-γ signals through the STAT-1 pathway,21 and we have previously shown that stimulation of normal duodenal biopsies with IFN-γ results in STAT-1 activation,18 we then examined the effect of JAK2/STAT-1 inhibition on IFN-γ mediated T-bet induction. Data shown in fig 4B clearly demonstrate that blocking STAT-1 activation causes dramatic suppression of IFN-γ-induced T-bet.

(A) Interferon γ (IFN-γ) enhances T-bet protein expression in duodenal biopsies from normal controls. Representative blot showing T-bet and β-actin in normal duodenal biopsies cultured with medium (M) or IFN-γ 50 ng/ml for 24 hours. One of two representative experiments analysing biopsies from four normal controls is shown. Similar results to those shown were obtained in each case. (B) Treatment of normal duodenal biopsies with TB42, a JAK2/STAT-1 inhibitor, prevents IFN-γ mediated T-bet induction. M, biopsies cultured with medium alone. Dimethylsulphoxide (DMSO) was used as vehicle. One of four representative experiments is shown.
In CD, gliadin induced STAT-1 signalling leads to T-bet induction
To independently verify the role of the STAT signalling in the regulation of T-bet in CD, we stimulated biopsies from five treated CD patients and five controls with PT digest of gliadin. In explants from treated CD biopsies, but not controls, stimulation with PT enhanced T-bet protein expression (fig 5). We have previously shown that challenge of treated CD biopsies with PT results in STAT-1 activation.18 Therefore, we explored the possibility that STAT-1 activity could play a major role in modulating PT mediated T-bet induction. For this purpose, treated CD biopsies were stimulated with PT in the presence or absence of TB42 or DMSO. As shown in fig 6A, TB42 abrogated PT induced T-bet expression. Importantly, TB42 dose dependently inhibited IFN-γ stimulated STAT-1 nuclear translocation in THP1 cells but did not affect phosphorylation of ERK-1, thus confirming the specificity of the TB42 effect on STAT-1 activation (fig 6B, C).
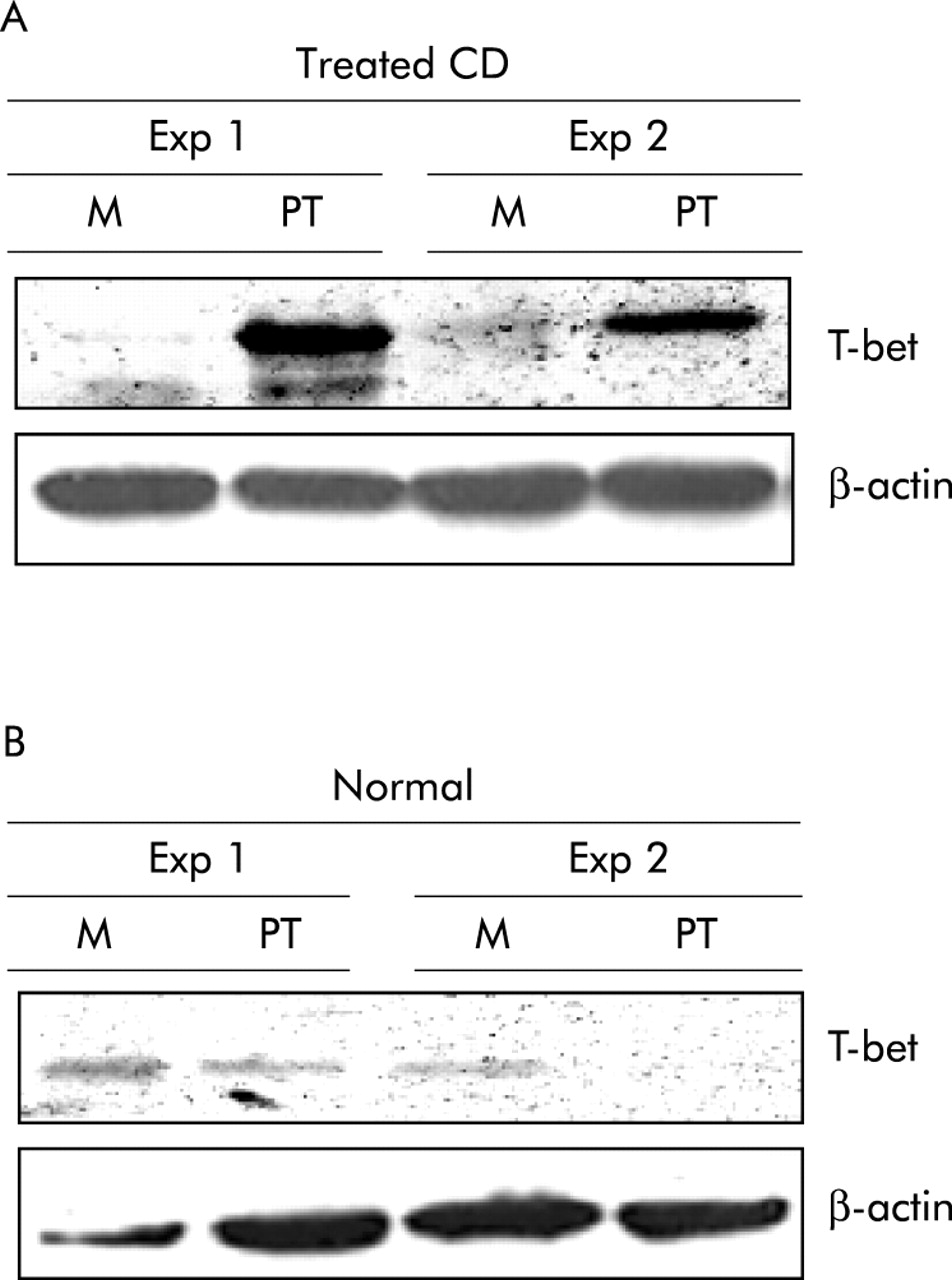
(A) Challenge of treated coeliac disease (CD) biopsies with peptic-tryptic digest of gliadin (PT) results in enhanced expression of T-bet. Representative blot of T-bet (top panel) and β-actin (bottom panel) in total proteins extracted from duodenal biopsies from two treated CD patients and cultured with medium (M) or PT for 24 hours. Two of four representative experiments are shown. (B) Stimulation of normal duodenal biopsies with gliadin does not modify T-bet expression. Representative blot of T-bet (top panel) and β-actin (bottom panel) in total proteins extracted from duodenal biopsies from two normal controls and cultured with medium (M) or PT for 24 hours. Two of four representative experiments are shown.

(A) Pretreatment of duodenal biopsies from treated coeliac disease (CD) patients with TB42, a JAK2/STAT-1 inhibitor, prevents gliadin mediated T-bet induction. Representative blot of T-bet (top panel) and β-actin (bottom panel) in total proteins extracted from duodenal biopsies from a patient with treated CD and cultured with medium (M) or a peptic-tryptic digest of gliadin (PT) for 24 hours. One of four representative experiments analysing total biopsies from four patients is shown. Similar results to those shown were obtained in each case. (B, C) TB42 dose dependently inhibits interferon γ (IFN-γ) induced STAT-1 nuclear translocation in THP1 cells but does not affect ERK-1 phosphorylation. (B) Representative western blot for STAT-1 (top blot) and OCT-1 (bottom blot) in nuclear protein extracted from THP-1 cells left untreated (UNST) or preincubated with medium (M) or graded doses of TB42 or dimethylsulphoxide (DMSO, vehicle) for 45 minutes and then stimulated with IFN-γ for 30 minutes. (C) Both phosphorylated (top blot) and total ERK-1 (bottom blot) content in cytosolic proteins extracted from THP-1 cells left untreated (UNST) or preincubated with medium (M) or graded doses of TB42 or DMSO (vehicle) for 45 minutes and then stimulated with IFN-γ for 30 minutes.
DISCUSSION
The present study was undertaken to analyse the transcription factors which regulate and/or stabilise polarisation of T cells along the Th1 or Th2 phenotype in CD mucosa. We have shown that duodenal samples from untreated CD patients exhibit high levels of T-bet protein in comparison with controls. Densitometry analysis revealed that median levels of T-bet in CD samples were approximately three times higher than those in controls. In contrast, T-bet was expressed at the same level in treated CD patients and normal controls, clearly indicating that upregulation of T-bet in CD is dependent on active inflammation. These data confirm and expand our previous observation that T-bet RNA transcripts are enhanced in biopsies from untreated CD patients.9 While this study was in progress, it was shown that upregulation of T-bet also occurs in the mucosa of patients with Crohn’s disease,14 thus confirming the selective expression of this transcription factor in Th1 driven gut inflammation.
The factors which induce T-bet in CD remain to be determined but some observations made in this study underline the relevance of the STAT-1 signalling pathway. Challenge of normal duodenal biopsies with IFN-γ enhanced T-bet and this effect was dependent on STAT-1 activation. Induction of T-bet by gliadin in biopsies from treated CD patients was also preventable by STAT-1 inhibition. Together, these data suggest that, in CD mucosa, irrespective of the master factor that promotes the initial Th1 cell differentiation, optimal IFN-γ//STAT-1 signalling is necessary to expand and stabilise the committed Th1 cell phenotype by enhancing expression of T-bet. This is consistent with the demonstration that T cells from STAT-1 deficient mice are defective in their ability to synthesise IFN-γ and that high levels of IFN-γ are measurable in the serum of mice deficient for SOCS-1, an intracellular inhibitor of STAT-1 signalling.22,23
However, we would like to point out that both STAT-1 and T-bet were examined in whole biopsies and not in purified cell types. As studies in other systems have revealed cell specific regulation of T-bet,13,20 we believe it would be biologically relevant to examine STAT-1 and T-bet in single mucosal cell types to ascertain if activation of STAT-1 directly leads to T-bet induction. Unfortunately, it is not possible using current technology to purify sufficient T, B, and NK cells from small biopsies to carry out mechanistic studies and extract proteins for western blotting or DNA binding protein assays.
Expression of active STAT-4, another crucial transcription factor for Th1 T cell development and regulation, did not significantly differ between untreated CD patients and controls, even though relatively high levels of active STAT-4 were seen in some CD samples. This observation is not entirely surprising in that activation of STAT-4 in human cells mostly occurs in response to IL-12, a cytokine which is not produced in CD.3 However, it is noteworthy that STAT-4 can also be activated by IFN-α, a molecule that is synthesized in excess in active CD.7,8,24 The reason why this does not then result in sustained activation of STAT-4 remains unclear, even if there is evidence that IFN-α mediated phosphorylation and DNA binding of STAT-4 are very short and transitory events compared with those induced by IL-12.25
Taken together, these results suggest the possibility that upregulation of T-bet in CD mucosa does not simply reflect increased mucosal infiltration of lymphoid cells. In fact, if this was the case we would have observed a parallel increase in active STAT-4, given that STAT-4 and T-bet are selectively expressed in lymphoid but not in other cell types (for example, myofibroblasts, epithelial, and endothelial cells).13,20
Both T-bet and active STAT-4 were documented in all duodenal mucosal samples from normal subjects, consistently with preferential expression of IFN-γ RNA transcripts seen in normal T-LPL, and a large body of literature shows that T cells from the normal intestinal lamina propria produce greater amounts of IFN-γ than other cytokines.26,27 These results raise the question of what induces STAT-4 and T-bet in normal duodenal samples. T-LPL are probably derived from Peyer’s patches where they are subjected to IL-12 stimulation26 but it is unlikely that active STAT-4 will be maintained in T cells after they leave Peyer’s patches and migrate to the lamina propria, a process which takes several days. Further studies are needed to determine if LPL can continue to express active STAT-4 when cultured on their own in vitro, which will establish if STAT-4 is being activated in LPL by locally released factors or is indeed a remnant of IL-12 stimulation in Peyer’s patches.
Acknowledgments
This work received support from the European Union Contract ERBFMRXCT980240.
REFERENCES
Footnotes
-
↵* I Monteleone and G Monteleone contributed equally to the study.