Article Text

Abstract
Objective Adult primary human hepatocytes (PHHs) support the complete infection cycle of natural HCV from patients’ sera. The molecular details underlying sera infectivity towards these cells remain largely unknown. Therefore, we sought to gain a deeper comprehension of these features in the most physiologically relevant culture system.
Design Using kinetic experiments, we defined the optimal conditions to infect PHH and explored the link between cell organisation and permissivity. Based on their infectivity, about 120 sera were classified in three groups. Concentration of 52 analytes was measured in 79 selected sera using multiplexed immunobead-based analyte profiling.
Results PHH permissivity towards HCV infection negatively correlated with cell polarisation and formation of functional bile canaliculi. PHH supported HCV replication for at least 2 weeks with de novo virus production. Depending on their reactivity, sera could be classified in three groups of high, intermediate or low infectivity toward PHH. Infectivity could not be predicted based on the donors’ clinical characteristics, viral load or genotype. Interestingly, highly infectious sera displayed a specific cytokine profile with low levels of most of the 52 tested analytes. Among them, 24 cytokines/growth factors could impact hepatocyte biology and infection efficiency.
Conclusions We identified critical factors leading to efficient PHH infection by HCV sera in vitro. Overall, we showed that this cellular model provides a useful tool for studying the mechanism of HCV infection in its natural host cell, selecting highly infectious isolates, and determining the potency of drugs towards various HCV strains.
- HEPATOCYTE
- CHRONIC HEPATITIS
- HEPATITIS C
- CHEMOKINES
- CYTOKINES
Statistics from Altmetric.com
Significance of this study
What is already known about this subject?
-
HCV infection is a major cause of chronic liver disease. Many different in vitro models that mimic the entire virus cycle have been described but are largely based on the molecular clone JFH1 (HCVcc, genotype 2a), subgenomic or full length replicons and hepatoma cell lines, which mimic partly the natural infection. Mature human hepatocytes in primary culture, isolated from non-infected patients, are sensitive to infection by HCV-positive sera from infected patients (different HCV genotypes). This system remains so far the most physiologically relevant cell culture model for studying HCV infection but most of laboratories failed in using it.
What are the new findings?
-
We explored key factors that are likely to influence sera infectivity in vitro. Parameters including patient clinical profile, viral load, genotype, cytokines content were carefully examined as potential markers allowing the prediction of sera infectivity in vitro. Interestingly, our findings indicate that HCV sera with low level of some cytokines involved in the regulation of immune response and inflammation are highly infectious, particularly those from patients after liver transplantation, but also from naïve patients.
How might it impact on clinical practice in the foreseeable future?
-
Our results suggest that suppression of inflammation by immunosuppressive treatments could impact on hepatocyte biology and favour HCV recurrence after liver transplantation. We also showed that primary human hepatocytes infected with HCV-positive sera of various genotypes could be of great interest for testing antiviral drug potency.
Introduction
Infection by HCV is the leading cause of chronic liver disease and affects approximately 3% of the world population. HCV infection is limited to humans and chimpanzees, imposing ethical, economic and technical limitations to in vivo experimentation. Many different in vitro models that mimic the entire virus cycle (entry, replication, assembly, release) and the host innate immune response have been described; however, our current understanding of HCV life-cycle is largely based on the molecular clone JFH1 (genotype 2a), which can replicate in hepatoma Huh7 cells and release infectious particles (termed HCVcc), and on pseudotyped particles (HCVpp) and HCV subgenomic or full length replicons, which mimic partly the natural infection.1 Differentiated human hepatocyte-like cells derived from human embryonic or induced pluripotent stem cells could represent an alternative model.2–5 These cells offer the opportunity to explore the host genetic factors that influence the viral pathogenesis and response to treatments. Nevertheless, even the most advanced protocols result only in heterogeneous cell populations that are not fully differentiated and still retain many fetal hepatocyte markers.
We and others have previously reported that primary human hepatocytes (PHHs) isolated from non-infected patients are sensitive to infection by HCV-positive serum from infected patients (HCVser)6 ,7 or HCVcc (JFH1)8 ,9 and permissive to viral genome replication.10 These non-dividing cells can be maintained in culture for several weeks and have been used to study different steps of the HCV cycle: viral entry,8 ,11 response to interferon (IFN) treatment,12 antiviral response,13–17 or viral replication and production.9 The HCV JFH1 strain replicates well in PHH, thus allowing comparative analyses with other isolates. PHH cultures could thus represent a relevant screening system for drug discovery. For instance, Ploss et al18 have developed micropatterned co-cultures of PHH and supportive stroma in a multiwell format adapted to high-throughput screening of antiviral drugs. Moreover, differently from hepatoma cell lines or immortalised hepatocytes that are from single individuals, primary hepatocytes are derived from different patients. Thus, the contribution of the interindividual host variability to the antiviral drug response can be evaluated. Finally, PHH infected with a large panel of HCV strains could help better understand the HCV life-cycle. However, this cell culture system remains difficult to set up and use: liver surgical samples are scarce (but cryopreserved PHH can be purchased) and most HCV-positive sera do not give measurable infection level in culture and are considered inefficient.
Therefore, to define the parameters required for efficient infection of adult PHH, we tested the in vitro infectivity of about 120 HCVser samples in different PHH cultures and evaluated the parameters driving their infectivity.
Materials and methods
Cells
PHHs were isolated from encapsulated liver samples obtained from 26 different liver donors (see online supplementary table S1) as previously described.19 The HLLR1-1.4 and HLL116 cell lines (kindly provided by Dr G Uzé) were cultured and used as previously described.20 Details are in online supplementary information.
HCV-positive serum (HCVser) samples
Details are in online supplementary information.
RNA extraction
Total cell RNA was isolated using guanidinium isothiocyanate (RNAble, Eurobio). HCV RNA from filtered culture supernatants (SNs) or sera was purified using the QIAamp Viral RNA Kit (QIAGEN, Courtaboeuf, France) according to the manufacturer's instructions. The concentration of total RNA in cells was determined using a Nanodrop Spectrophotometer ND-1000 (Fisher Scientific SAS, Illkirch, France).
Reverse transcription and real-time PCR analysis
HCV RNA copy number was quantitated using the SuperScript III Platinium One-Step quantitative RT-PCR system (Invitrogen). Cell mRNAs were reverse transcribed using the M-MLV Reverse transcriptase (Invitrogen). Real-time measurement of the PCR products was carried out with a LightCycler 480 Real-Time PCR System (Roche Diagnostics, Meylan, France).
PHH infection with HCVser or HCVcc
PHHs were cultured in 12-well plates with Lanford (LNF) medium at 37°C in a humidified 5% CO2 atmosphere from day (D)1 to D3 post seeding. Infections were performed by incubating cells with 25 µL HCVser in 1 mL LNF/well (except when specified). After 2 h to 16 h at 37°C, the inoculum was removed and cells were washed three times with William's E medium. One mL/well of fresh LNF was then added and cells harvested 72 h post infection, unless otherwise stated. High titre stocks of HCVcc (JFH1) were prepared as described elsewhere.21 HCVcc infectivity was evaluated by adding increasing volumes of suspension (10–150 µL) in 1 mL LNF/well. Intracellular HCV RNA copy number was measured 72 h post inoculation with the One-step RT-PCR system.
PHH infection with HCVpp
Details are in online supplementary information.
Immunofluorescence
PHHs were fixed in 3.2% (v/v) paraformaldehyde (EMS, Hattfield, Pennsylvania, USA), permeabilised with 0.1% Triton-X 100 (Fisher) and stained with specific antibodies. Details are in online supplementary information.
Type I and type III interferon measurement
Details are in online supplementary information.
Evaluation of the cytokine profile in HCV-positive sera
A range of cytokines, chemokines and growth/angiogenic factors was quantified in HCVser (25 μL) using two multiplexed microbead assays (the Cytokine 52-plex and the Cytokine 51-plex kit that does not include endothelial growth factor (EGF), Procarta, Marne-la-Vallée, France) according to the manufacturer’s instructions and a FIDIS apparatus (BMD). Standard curves were established to determine the cytokine concentrations. Concentrations above the highest point of the curve were given an arbitrary value equal to the highest point of the analyte standard curve. Four HCVser (S320-Inter, S358-PI, S380-PI and S388-PI) were analysed in both assays and used as control for assay variability.
Statistical analysis
Statistical significance was assessed using a two-tailed unpaired t test and the GraphPad Prism 5 software. p Value <0.05 was considered statistically significant; n indicates the number of experiments. Correlations were evaluated using Spearman's correlation coefficients. For cytokine analysis, computations were performed using R (http://www.R-project.org) and Bioconductor.22 When assessing analyte list significance, Mann-Whitney rank tests were corrected for multiple testing23 to adjust p values with a 0.05 threshold. Hierarchical clustering and subsequent expression heatmap were performed using Euclidean distance.
Results
HCVser samples
We constructed a library of serum samples from patients with chronic HCV infection (genotype 1–5) that partially reflects HCV prevalence in France (table 1). Patients had different clinical profiles, including relapsers and non-responders to the conventional IFN/ribavirin bitherapy, treatment-naive patients and patients after liver transplantation (see online supplementary table S2).
Characteristics of the serum samples from HCV-positive patients
Optimal infection conditions of PHH
In order to identify the most favourable infection conditions, PHH from liver FT316 and FT351 were infected with HCVser S317 (genotype 1b) at different Ds post seeding (D1 to D7) for 16 h. The intracellular HCV RNA copy number was quantified 72 h post infection (figure 1A). PHH permissivity to HCV replication was optimal in cells infected between D2 and D3 post seeding and decreased gradually in cells that were infected later (30% loss between D3 and D4). Next, PHH cultures were infected with HCVcc following the same protocol as for HCVser (figure 1B). HCV RNA accumulation was maximal in PHH infected at D2 post seeding, strongly decreased in cells infected at D3 (70–75% loss) and then remained stable. The different infectivity profiles of HCVser and HCVcc could be due to some differences in virus entry and/or replication between cell-cultured particles produced in hepatoma cells and circulating viruses from HCV-positive patients. Antibodies against the main host receptors LDL-R, SR-B1 and CD81 prevented HCV entry at D3 and D5 post seeding in both conditions (see online supplementary figure S2A–B). Moreover, the NS3–4A protease inhibitors Telaprevir and BILN 2061, which stop viral replication, inhibited infection by HCVser (figure 1D–F) and by HCVcc (see online supplementary figure S6A) in a concentration-dependent manner, independently of the day of infection after seeding and without affecting cell viability (see online supplementary figure S6D).
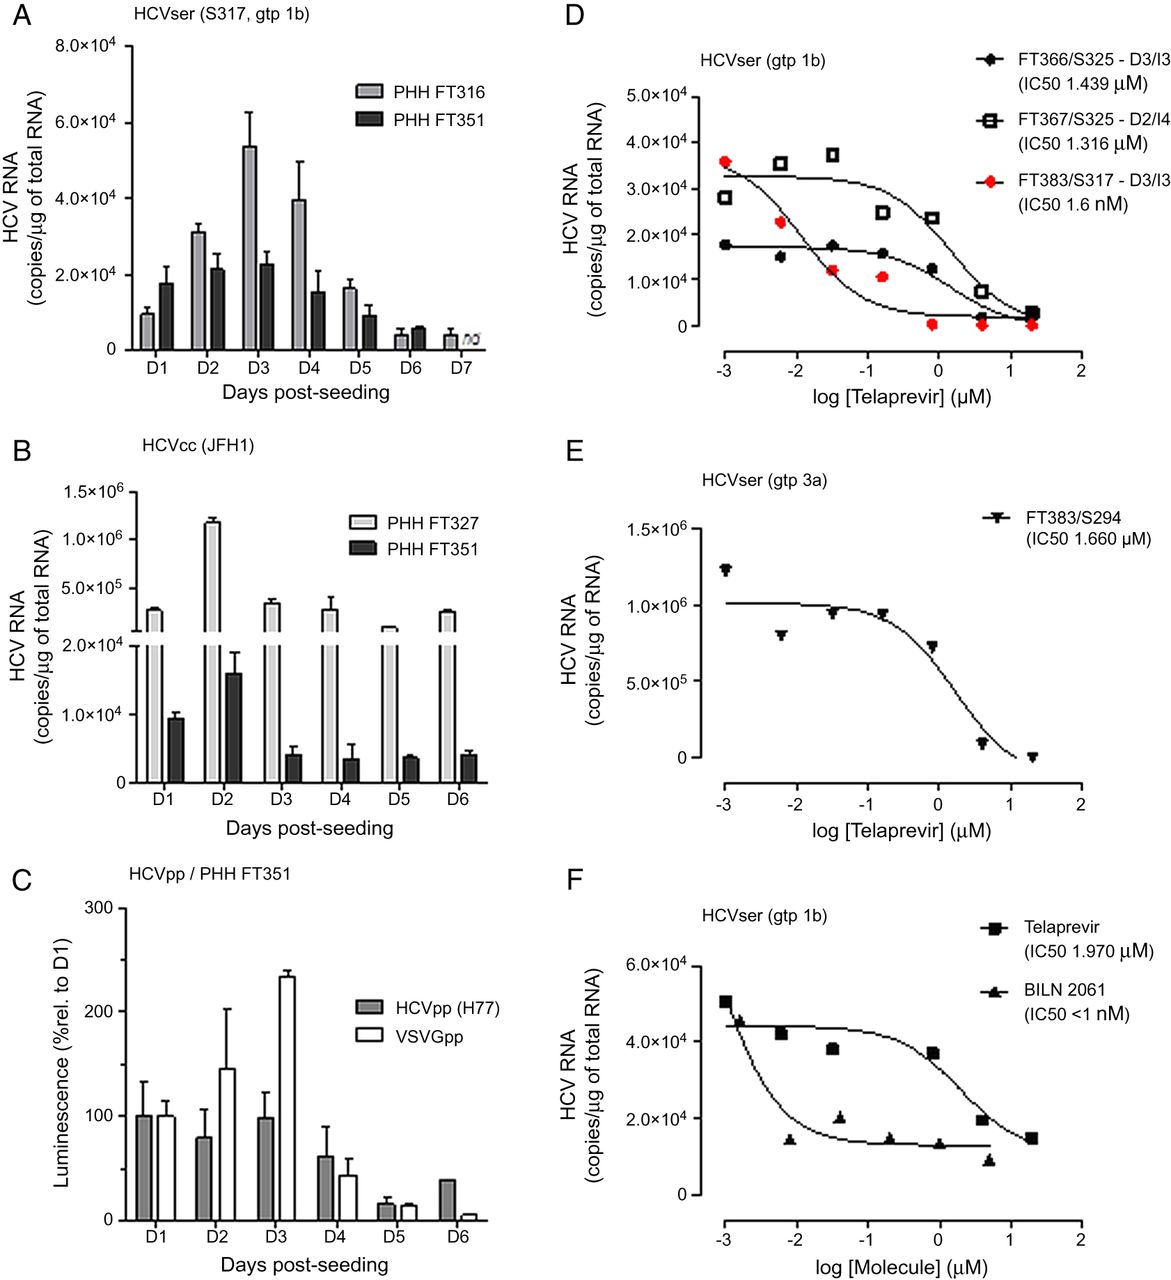
Primary human hepatocytes (PHHs) sensitivity to HCV infection and potency of NS3-4 inhibitors. (A) PHH FT316 and FT351 were exposed to HCVser S317 (genotype 1b) for 16h at different days post-seeding. The intracellular HCV RNA concentration was evaluated 72h post-inoculation. (B) PHH FT327 and FT351 were infected with HCVcc. (C) PHH FT351 were infected with HCVpp (H77) or VSVGpp. Luciferase activity in cell lysates was evaluated 48h later and reported as the percentage of the value obtained in cells infected at D1. All values were the mean±SD of biological duplicates. (D) PHH were infected with HCVser at D3 (FT366 and FT383) or D2 (FT367). After 16h, the inoculum was washed off and increasing amounts of Telaprevir or control (0.2% DMSO) were added. In case of the FT383/S317 combination, cells were treated both at time of inoculation and after washing off the inoculum (red points). Cells were lysed three (FT366, FT383; I3) or four days (FT367; I4) after infection. (E) PHH FT383 cells were infected with HCVser S294 (genotype 3a) and treated with increasing concentrations of Telaprevir after washing off the inoculum. (F) PHH FT385 cells were infected with S397 (genotype 1b) and treated with increasing concentrations of Telaprevir or BILN 2061 after washing off the inoculum. Curves represent the non-linear regression analysis of the data. nd, not determined.
Finally, to further confirm that the infection profiles were related to HCV entry, PHH FT351 were inoculated with HCVpp (H77, genotype 1a) or pseudotyped particles bearing vesicular stomatitis virus glycoproteins as control at different time points (D1–D6) post seeding. Infectivity was analysed 48 h later by measuring the luciferase expression level. The HCVpp infection profile (figure 1C) was similar to the one obtained with HCVser: the signal was stable in cells infected at D1 to D3 and decreased in cells infected at D4 (about 30% lower than at D3). The vesicular stomatitis virus glycoproteins infection profile showed a strong decrease at D4 (80% less than at D3).
These results suggest that PHH sensitivity to HCV depends on the cell membrane permeability/organisation and HCV particle origin (HCVser/HCVcc) rather than on the ability of the virus to replicate in the cell.
Link between HCV infection and cell organisation
We then assessed whether PHH time-dependent susceptibility to HCV infection correlated with expression of the HCV host receptors LDL-R, SRB1, CD81, claudin-1 and occludin (see online supplementary figure S3A). CD81 mRNA expression remained unchanged from D1 to D7 (FT327 and FT383) or D10 (FT316) post seeding. SRB1, LDL-R and claudin-1 increased from D2 to D4–5 post seeding and then slightly decreased. Occludin gradually increased from D2 to D5 (∼2.5-fold) and then remained stable between D5 and D10 post seeding. Occludin is an integral membrane protein which is specifically localised at tight junctions (TJs) and its expression is strongly linked to cell polarisation. We therefore investigated the structural changes of non-infected PHH, from D1 to D7 post seeding. PHHs were fixed daily and expression of the polarisation markers ZO-1, CD26, multidrug resistance protein (MRP)2 and occludin assessed by immunofluorescence. At D1, ZO-1 was located at the cell membrane, while the other proteins were not clearly detectable (figure 2A). Many well-defined structures formed between D4 and D7 (figure 2B–C). All the studied markers accumulated around these structures that were identified as functional biliary canaliculi due to their ability to accumulate the fluorescent bile acid analogue cholyl-lysyl-fluorescein (see online supplementary figure S3C). The mRNA expression profiles of occludin and MRP2 correlated well with the immunofluorescence data (see online supplementary figure S3A). Moreover, the protein level of occludin, claudin-1 and of actin and tubulin-α (two major cytoskeletal proteins) increased concomitantly (see online supplementary figure S3B).

Primary human hepatocytes (PHHs) reorganisation in polarised cell layers after seeding. The localisation of CD26, ZO-1, MRP2 and occludin was assessed in PHH at D1 (column A), D4 (column B) and D7 (column C) post seeding by immunofluorescence staining; nuclei were stained with Hoechst (blue). Merge of MRP2 and Occludin staining is shown at the bottom.
As the previous results indicate that HCV infectivity decreases from D3 to D7 post seeding (figure 1A and see online supplementary figure S4A for S294, #357-1), we then tested whether PHH susceptibility to HCV could be recovered after trypsinisation and reseeding. Non-infected PHH FH357 (#357-2) were thus trypsinised at D5 post seeding and reseeded. Two and seven days later, PHH were infected with S294 and then intracellular HCV RNA quantified 72 h post infection. HCV RNA copy numbers were comparable with those obtained for cell culture #357-1 seeded just after tissue perfusion, indicating that PHH susceptibility is recovered after reseeding. Similar results were obtained with PHH FT358 (see online supplementary figure S4B). In this case, cells were trypsinised a first time at D13 post perfusion (#358-2) and a second time at D20 (#358-3), suggesting that susceptibility to HCV infection can be partly recovered after 20 days in culture; but then it decreased again rapidly. Immunofluorescence analysis of #358-3 culture showed that PHH reorganised between D2 and D5 after reseeding with the formation of biliary canaliculi (see online supplementary figure S4C).
These findings demonstrate that PHH susceptibility to HCV infection is strongly linked to cell polarisation and membrane/cytoskeleton organisation.
HCV replication in PHH
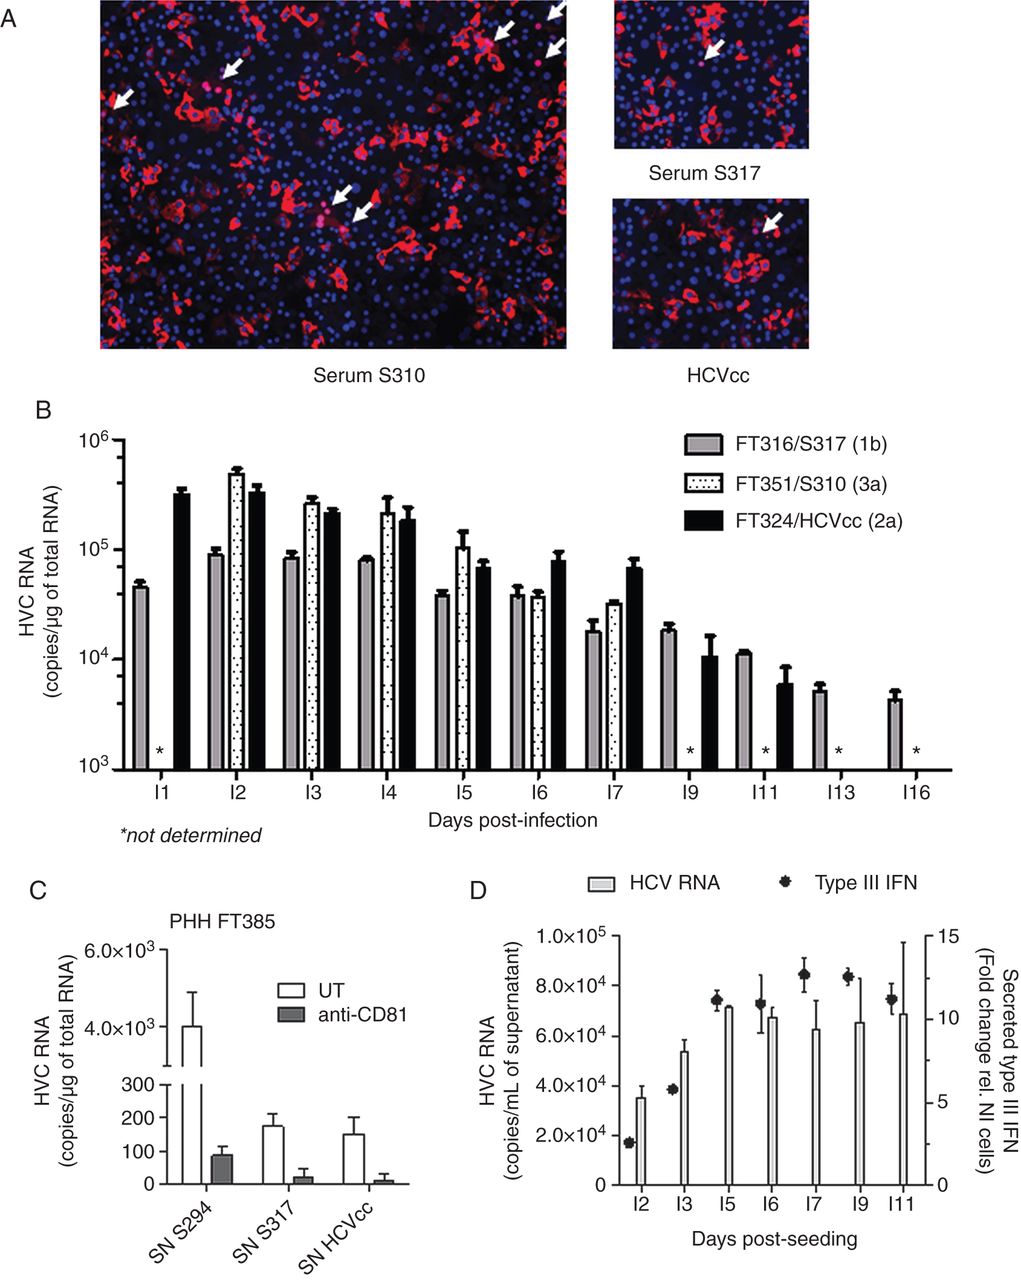
To confirm that HCV efficiently replicated in PHH cultures and to rule out that the HCV RNA detected 72 h post inoculation was not due to cell surface attached viruses, several experiments were carried out. First, PHHs FT383 were transduced with lentiviruses expressing the reporter protein red fluorescent protein-nuclear localisation sequence-interferon-β promoter stimulator (RFP-NLS-IPS) and 48 h later were inoculated with serum S310 or S317, or HCVcc. After 72 h of infection, translocation of RFP-NLS from the mitochondria to the nucleus of infected cells was detected (arrows in figure 3A). The number of infected cells correlated with HCVser or HCVcc infectivity as indicated by the many clusters of positive nuclei observed in PHH infected with the highly infectious (HI) serum S310.

HCV replication and persistence of infection in primary human hepatocytes (PHHs). (A) PHHs FT383 were transduced with lentiviruses expressing RFP-nuclear localisation sequence-interferon-β promoter stimulator (RFP-NLS-IPS) at D1 post seeding and then were inoculated with serum S310 (left panel), S317 or HCVcc (right panels). HCV infected cells were identified by translocation of the cleavage product RFP-NLS to the nucleus (pink nuclei indicated by arrows) 72 h post infection. (B) PHH isolated from liver FT316, FT351 and FT324 were infected at D3 post seeding with HCVser S317 (genotype 1b), S310 (genotype 3a) and HCVcc (JFH1), respectively. Cells were washed 8 h post inoculation and cellular HCV RNA was evaluated at the indicated time points post infection (I1=D4 post seeding). HCV RNA is expressed as the mean copy number/µg of total RNA on a log10 scale (±SD, n=2 replicates/condition). (C) Supernatants (SN) of PHH FT383 cells infected with S294, S317 or HCVcc were collected at I3 (1 mL/∼6×105 cells) and conserved at −80°C. PHHs FT385 were pretreated or not with an anti-CD81 neutralising antibody (5 µg/mL) for 30 min and then inoculated with 400 µL/well of PHH FT383 SN as indicated. After 16 h, the SN was washed off and cells were lysed at I3. The intracellular HCV RNA values are the mean±SD of biological duplicates. (D) At the indicated time points, SN of PHH FT316 infected with S317 were collected. HCV RNA is expressed as the mean copy number per mL of supernatant (±SD, n=2 replicates/condition, left axis). Type III interferon concentration (dot plot) was evaluated using HLLR1.4 cells (right axis) and expressed as fold change relative to the signal of untreated cells (background value fixed to 1).
Then, cell wash with proteinase K to remove viral particles at the cell surface24 did not change the HCV RNA content detected 72 h post inoculation (see online supplementary figure S5A). Conversely, UV-inactivation of HCVser or HCVcc abolished the HCV RNA signal at 72 h post inoculation, whatever the viral load (see online supplementary figure S5B). Similarly, telaprevir and BILN 2061 inhibited HCVser and HCVcc infection in a concentration-dependent manner, whatever the HCVser genotype or viral load (figures 1D–F, see online supplementary figure S6A–B). In the case of HCVser S385 (low viral load), the HCV RNA content did not change when the volume of inoculum was increased from 50 µL/well to 100 µL/well, while 4 µM telaprevir inhibited ∼60% of the signal in both cases (see online supplementary figure S6A). Finally, the inhibitory effect was significantly higher when telaprevir was added at the time of infection and after inoculum wash (FT383/S317 sample in red in figure 1D; FT383/HCVcc in red, see online supplementary figure S6A), suggesting that telaprevir can suppress HCV RNA levels over time.
Overall, these results demonstrate that the HCV RNA content detected 72 h post inoculation cannot be attributed to cell surface attached viruses, confirming that infection of PHH by HCVser is productive.
Persistence of HCV infection in PHH
To evaluate the intracellular HCV RNA level in PHH between D1 and D16 post infection (I1–I16), three different PHH cultures were infected at D3 post seeding with HCVser S317 (genotype 1b), S310 (genotype 3a) or with HCVcc and then lysed at different times post inoculation. The highest HCV RNA level was observed between I2 and I4 (figure 3B). HCVser S310 and S317 were HI and high HCV RNA concentrations were detected up to I16 (∼4×10³ copies/µg of total RNA for S317). A similar profile was obtained for HCVcc, with intracellular HCV RNA still detectable at I11 (∼6×10³ copies/µg of total RNA). HCV RNA was detected in the supernatant from I2 to I11 post infection. Moreover, de novo produced viral particles in SN of PHH infected with different sera or HCVcc (collected at I3 post infection and stored at −80°C) could infect naïve PHH cells (figure 3C and see online supplementary table S3).
To evaluate whether the progressive decrease of HCV copy number over time could be partially due to PHH antiviral response, we measured the concentration of type I and type III IFN in the SNs of infected PHH cultures at different times post infection using HLLR1-1.4 and HLL116 cells. No signal was detected in HLL116 cells incubated with SN from different PHH cultures infected with different sera, indicating that the SNs did not contain type I IFN. Conversely, the signal measured in HLLR1.4 cells showed that type III IFN concentration increased from I2 to reach a maximum at I5 (figure 3D). Incubation with antibodies against interleukin (IL)-29 (IFNλ1), IL-28 (IFNλ2) or IL-28/29, or antibodies against the IL-10 receptor (IL-10 Rβ) to neutralise the antiviral effect of secreted type III IFN did not alter the infectivity profiles (data not shown).
These results clearly demonstrate that, in our culture conditions, viral strains from HCVser can complete their viral cycle in PHH. However, despite the production of viral particles, the infection tended to decrease over time. No evidence was found to directly link type III IFN in the cell SNs to this decrease. Nevertheless, infectious cycles could be followed up to 15 days and this is of particular interest for studying cell disorders involved in the switch from acute to chronic infection.
Parameters influencing HCVser infectivity in vitro
To test the infectivity of the different HCVser (table 1), PHHs were inoculated using the optimised infection conditions described above. Intracellular HCV RNA was quantified at D3 post infection. Of the 119 sera tested, 13.5% were HI (HI; more than 5×10³ HCV RNA copies/µg of total RNA), 66.5% poorly infectious (PI) (PI; less than 1.3×10³ copies/µg of total RNA) and 20% showed intermediate (Inter) infectivity (table 1). HI and Inter sera allowed in vitro studies. Eight of the HI serum samples were collected after liver transplantation (see online supplementary table S2).
A correlation was observed between serum infectivity and viral load of the inoculum (Spearman, p=0.0002) (figure 4A). Nevertheless, this parameter was not sufficient. Indeed, although the viral loads of S385 and S368, or S294 and S286 (all genotype 3a) were similar, their infectivity was very different (∼20-fold and 35-fold, respectively). The viral load in the PI group varied from ∼105 to ∼2×10⁷ and in the Inter group from ∼6×10⁵ to ∼3×10⁷. Infectivity was not related to the genotype (figure 4B) or to the PHH culture (different liver donor, different IL28B single nucleotide polymorphism rs12979860 genotype) (figures 4C, see online supplementary figures S7A–B). Of note, S310 is by far the most infectious serum identified in our library. The genome of this particular viral strain has been recently cloned and used to establish a robust genotype 3a replicon system.25 Differently from what observed with HCVcc, increasing the volume of the serum inoculum per well did not systematically increase the infection level (see online supplementary figures S8A–B). As an example, in spite of adding ∼0.45 Geq/cell (100 µL) as for S325, serum S380 (1a) infectivity did not increase.

Association of serum viral load, genotype and infectivity in primary human hepatocytes (PHHs). Correlations between variables were assessed using the Spearman's rank correlation test. (A) Correlation between viral load and in vitro mean infectivity (intracellular HCV RNA level measured 72 h post inoculation, mean value of 2–7 PHH cultures per serum) of 39 HCVser (9 highly infectious (red points), 12 intermediate (open points) and 18 poorly infectious (blue squares). (B) Correlation between mean infectivity and serum genotype (not significant). (C) Reproducibility of HCVser infectivity in PHH cultures from different livers (n: number of cultures infected with a serum).
Finally, to assess the impact of storing conditions on HCVser infectivity, perfusion of a liver surgery sample (PHH FT325) and collection of a blood sample (S355/genotype 3a) were performed concomitantly (D0). Some S355 aliquots were conserved at 4°C and others at −80°C. PHH FT325 cells were then infected at D2 post seeding with the two types of S355 aliquots (see online supplementary figure S8C). No significant difference of infectivity was observed, indicating that one freezing/thawing cycle does not affect HCV infectivity.
In vitro HCVser infectivity and analyte content
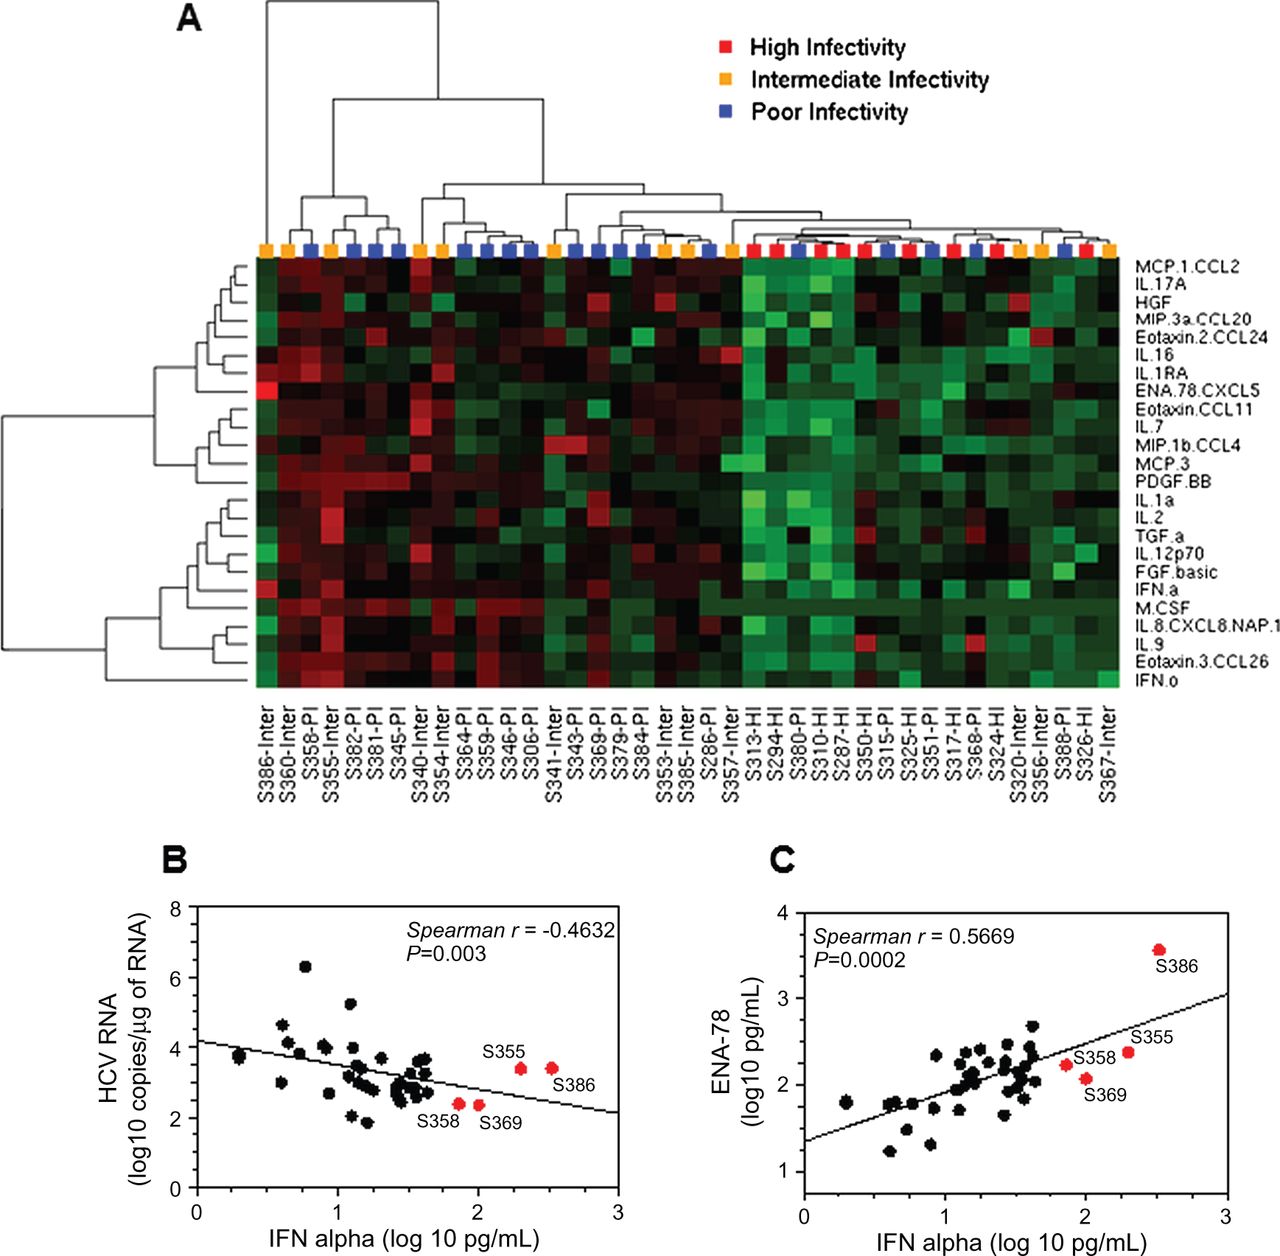
Many studies explored the association/predictive value of the serum levels of various cytokines for the treatment outcome of patients infected by HCV.26 Increasing evidence suggests a major role of inflammation mediators and growth factors in the mechanisms leading to HCV infection.27 We thus quantified by multiplex analysis the levels of 52 cytokines, chemokines and growth/angiogenic factors (see online supplementary table S4) in 39 selected HCVser samples (9 HI, 12 Inter and 18 PI, see online supplementary table S2) to identify potential predictors/biomarkers of serum infectivity in vitro. We investigated whether the serum-analyte profiles were different for HI and PI sera. The distribution comparison using a Mann-Whitney unpaired rank test and multiple testing correction showed that the serum levels of 24 analytes were significantly lower in the HI group (adjusted p<0.05), and particularly INFα, IL-8, eotaxin-3, platelet-derived growth factor, homodimer beta and IL-16 (adjusted p≤0.01, table 2). Hierarchical clustering of the 24 analyte concentrations in the 39 HCVser illustrates this finding (figure 5A) and highlights the fact that some PI samples (S380, S315, S351, S368, S388) cosegregated with the HI group, as well as four Inter samples (S357, S367, S356, S320). The 24 analytes were distributed in four main groups (left dendrogram). The Inter sera S386 and S355 contained the highest levels of IFNα (≥200 pg/mL) followed by the PI samples S358 and S369 (72 and 99 pg/mL, respectively), despite the slight negative correlation between IFNα concentration and serum infectivity (Spearman, p=0.003) (figure 5B). Samples S386 and S355 also contained high levels of ENA-78. Moreover, IFNα and epithelial neutrophil activating protein (ENA)-78 concentrations positively correlated (Spearman, p<0.001) (figure 5C). Using statistical analysis of microarrays (SAM) and a false discovery rate of 0, the number of cytokines correlated with serum infectivity was reduced to 13 (see online supplementary table S5), without improving the clustering pattern previously obtained (see online supplementary figure S9). These analytes were nevertheless necessary and sufficient to distinguish HI and PI sera. These results were confirmed by the multiplex analysis of the concentration of the same analytes (excepted EGF, which was not included in the new kit) in 40 additional HCVser samples (11 HI, 8 Inter and 15 PI). Indeed, the clustering pattern illustrating the correlation between the concentration of the 13 previously identified cytokines and the infectivity of all tested HCVser samples (n=79) clearly confirmed the different analyte profiles of HI and PI sera (excepted for S327 and SH139) (see online supplementary figure S10). Moreover, serum samples obtained from the same patient at two different times generally cosegregated (S356/S400, S294/S310 and S325/S397, but not S360/S401).
Correlation between analyte serum concentration and HCVser infectivity in PHH

Classification of serum samples based on the analyte content. (A) Twenty-four analytes differentially concentrated (p<0.05) in highly infectious (HI) and poorly infectious (PI) serum samples were identified using a Mann-Whitney unpaired rank test, and visualised in a heat map by unsupervised hierarchical clustering. Concentrations in red: high; green: low; black: unchanged. Each row represents an analyte; each column represents a serum. Dendrogram: at the top of the matrix indicates the distance between HCVser; on the left, the distance between analytes. (B) Correlation between interferon (IFN)α concentration level and infectivity (intracellular HCV RNA copies measured 72 h post inoculation) in the 39 HCVser. (C) Correlation between IFNα and ENA-78 concentration levels. HCVser S355 (genotype 3), S386 (genotype 4f), S369 (genotype 1b) and S358 (genotype 1a) that had the highest concentration of IFNα are highlighted in red.
Taken together, these results indicate that the infectivity of HCVser cannot be predicted based on the viral genotype or viral load, differently from HCVcc particle stocks, but has to be determined using a standard test. The donor patient's clinical profile could also be important: 8 of the 14 samples collected after liver transplantation were HI. Finally, the effect of cytokine/growth factor content on in vitro HCVser infectivity should be further investigated. It could be hypothesised that a combination of some of the analytes highlighted above impacts on sera infectivity in vitro.
Discussion
Despite the high relevance of PHH as an in vitro model for HCV studies, these cells are used by few laboratories. Here, we investigated how to optimise PHH infection with HCVcc or strains of various genotypes and quasispecies contained in HCVser and the key feature of HCVser infectivity. Our findings clearly demonstrate that there are critical time windows for inoculation and infectivity analysis. The efficiency of HCVser infection is similar to that of pseudotyped particles harbouring G protein of the Vesicular Stomatitis Virus or HCV E1-E2 envelope glycoproteins and is maximal during the first 3 days post seeding. After 4 days in culture, well-defined and functional biliary canaliculi appear and concomitantly infectivity strongly decreases, suggesting a strong dependence of HCV entry on TJ organisation and/or polarised endocytosis capacity. Indeed, disruption of cell junctions by trypsinisation and reseeding led to the recovery of permissivity to infection. These results are in accordance with previous findings on HepG2 cells, showing that polarity alters claudin-1 localisation and limits HCV entry.28 Several studies suggest a prominent role of clathrin-dependent endocytosis and of pathways that involve the actin cytoskeleton in HCV entry.24 ,29 ,30 Recent data show that HCV particles increase CD81 and claudin-1 endocytosis in a clathrin-dependent process,31 supporting the general view that virus movements on the cell surface could facilitate the interaction of virions with sites that trigger their internalisation.32 The central role of TJ integrity was reported for baculovirus entry in rat hepatocytes, where transient calcium depletion induces intercellular linkage breakage and allows virus entry.33 Similar observations were recently reported for Hepatitis B Virus entry in human hepatocytes.34
We then show that PHH infected with HCVser of different genotypes can produce infectious viral particles, but the infection levels decrease over time, as observed in microscale cultures.18 Like in fetal liver cell cultures,17 ,35 only type III IFN was produced by adult PHH following HCV infection; however, it did not seem to directly affect the infection profile. Besides, Bauhofer et al36 recently demonstrated the persistence of HCV in quiescent hepatoma cells during type I or type III IFNs antiviral response. Thus, a combination of several factors, including PHH polarity that prevents virus entry, the sustained innate antiviral response and cytokine secretion, might restrict HCV persistence in PHH cultures.
The use of sera for HCV-infection studies is considered challenging due their low infectivity and replication. Here, we demonstrate that well-defined culture conditions can lead to the identification of HI strains, such as S310. Indeed, a full-length consensus genome was cloned from the S310 viral RNA and was used to construct a subgenomic replicon, providing a new tool for genotype 3a HCV replication studies in human hepatoma cells.25 More than 30% of the serum samples tested are infectious enough to be used in experimental protocols; 15% can be used to evaluate the potency of antiviral drugs and to determine their efficiency against viral strains with different genotypes and quasispecies.
Quantification of the serum levels of a broad range of analytes revealed that HI HCVser samples contained the lowest levels of at least 24 analytes and suggests that rather than a specific cytokine profile, combinations of these analytes could affect serum infectivity. However the precise effects of most of the analytes on HCV infection and/or hepatocyte biology remain to be determined. For instance, IFNα level was significantly lower in HI than in PI samples; however, serum samples with the highest IFNα concentrations were infectious, suggesting that the well-described antiviral effect of this cytokine is counterbalanced by other factors. Moreover, the concentration of the proinflammatory chemokine IL-8 was significantly lower in HI than in the other two groups. IL-8 displays antiviral and proviral properties, depending on the level of HCV replication and the cellular context. In vitro, IL-8 can inhibit IFN-α activity,37 but IL-8 upregulation by ribavirin might participate in enhancing IFNα antiviral effects.38 It has been also recently proposed that high IL-8 serum levels might protect injection drug users from HCV infection.39 Finally, ENA-78 and IL-8 are mitogenic in rat hepatocytes,40 suggesting that these cytokines could also act on human hepatic parenchymal cells. The relationship between cytokines and TJ regulation is crucial for HCV entry. Many ILs could affect the claudin/occludin turnover at TJ, as well as the actin cytoskeleton contraction and the endocytosis of TJ proteins.41 Similarly, growth factors have a variety of effects on paracellular permeability and could compromise HCV entry. Overall, the effects of the tested analytes on the hepatocyte biology remain largely unknown and further studies are needed to clarify their role.
Finally, our findings indicate that HCVser with low level of most of the tested cytokines were HI, particularly those from patients after liver transplantation but also from naïve patients. So far, immunosuppressive treatments and post-transplant HCV reinfection remain a major clinical challenge.42 Immunosuppressant agents decrease the blood levels of cytokines: for example, ciclosporin A decreases levels of IL-1α and IL-2,43 two cytokines significantly lower in the HI sera. Thus, our results argue that suppression of inflammation could impact on hepatocyte biology and favour HCV recurrence after liver transplantation.
Acknowledgments
Huh-7.5 cells were kindly provided by Dr Charles Rice, HLLR1-1.4 and HLL116 cells by Dr Gilles Uzé, pseudotyped particles by Dr Jane McKeating, and BILN 2061 by Dr Cyrille Ferray. The authors also thank Dr Laurent Martinez and Dr Dimitri Lavillette for their technical assistance, and Dr Sabine Gerbal-Chaloin for helpful discussions.
References
Supplementary materials
Supplementary Data
This web only file has been produced by the BMJ Publishing Group from an electronic file supplied by the author(s) and has not been edited for content.
Files in this Data Supplement:
- Data supplement 1 - Online supplement
- Data supplement 2 - Online figures
- Data supplement 3 - Online tables
Footnotes
-
Contributors CG and PM designed and planned the project. CG designed the experiments; CG, PB, CD, P-AR, FR, FH and JD performed the experiments and collected the data; DL and M-PR provided HCV-positive sera; J-MF and JR provided liver surgical samples; CG and TR analysed the data; CG, PM, E-IP and MD-C wrote the manuscript. All authors discussed the results and commented on the manuscript.
-
Funding This work was supported by the French ‘Agence Nationale de la Recherche sur le SIDA et les Hépatites Virales’ (ANRS).
-
Competing interests None.
-
Ethics approval French National Ethics Committee, French Graft Institute.
-
Provenance and peer review Not commissioned; externally peer reviewed.