Article Text

Abstract
Objective To assess in a single cohort whether annual weight and waist circumference (WC) change has varied over time.
Design Longitudinal cohort study with three surveys (1) 1999/2000; (2) 2004/2005 and (3) 2011/2012. Generalised linear mixed models with random effects were used to compare annualised weight and WC change between surveys 1 and 2 (period 1) with that between surveys 2 and 3 (period 2). Models were adjusted for age to analyse changes with time rather than age. Models were additionally adjusted for sex, education status, area-level socioeconomic disadvantage, ethnicity, body mass index, diabetes status and smoking status.
Setting The Australian Diabetes, Obesity and Lifestyle study (AusDiab)—a population-based, stratified-cluster survey of 11247 adults aged ≥25 years.
Participants 3351 Australian adults who attended each of three surveys and had complete measures of weight, WC and covariates.
Primary outcome measures Weight and WC were measured at each survey. Change in weight and WC was annualised for comparison between the two periods.
Results Mean weight and WC increased in both periods (0.34 kg/year, 0.43 cm/year period 1; 0.13 kg/year, 0.46 cm/year period 2). Annualised weight gain in period 2 was 0.11 kg/year (95% CI 0.06 to 0.15) less than period 1. Lesser annual weight gain between the two periods was not seen for those with greatest area-level socioeconomic disadvantage, or in men over the age of 55. In contrast, the annualised WC increase in period 2 was greater than period 1 (0.07 cm/year, 95% CI 0.01 to 0.12). The increase was greatest in men aged 55+ years and those with a greater area-level socioeconomic disadvantage.
Conclusions Between 2004/2005 and 2011/2012, Australian adults in a national study continued to gain weight, but more slowly than 1999/2000–2004/2005. While weight gain may be slowing, this was not observed for older men or those in more disadvantaged groups, and the same cannot be said for WC.
- Obesity
- Trends
- Cohort
This is an Open Access article distributed in accordance with the Creative Commons Attribution Non Commercial (CC BY-NC 3.0) license, which permits others to distribute, remix, adapt, build upon this work non-commercially, and license their derivative works on different terms, provided the original work is properly cited and the use is non-commercial. See: http://creativecommons.org/licenses/by-nc/3.0/
Statistics from Altmetric.com
Strengths and limitations of this study
-
Reliably measured data in a single nationally representative cohort in recent time periods.
-
Analyses adjusted and matched for age for comparison between periods to enable analysis of changes over time, rather than age.
-
Selection and response bias may limit the generalisability of the results to the broader Australian population.
Obesity in adults has increased rapidly over the past few decades, leading to prevalence of over one-quarter in many developed countries.1 There is a growing acceptance that strong preventive measures are required to stem the increasing prevalence, with a variety of approaches implemented, ranging from social marketing through whole of community interventions to regulatory strategies.
There have been some suggestions that obesity prevention interventions in children have had a positive effect, due to the observation that the prevalence of obesity is no longer increasing at the same rate.2 ,3 A recent review of 52 studies, from 25 countries, comparing obesity prevalence at two time points since 19994 concluded that, in more developed nations, a likely slowing of the rate of increase in obesity prevalence was occurring in children, with a possible turning point around 2000. However, trends in adults in this review generally appeared to be continuing to increase. Since this review, an analysis of US adults through the repeated National Health and Nutrition Examination Surveys (NHANES) between 1999 and 2010 suggested no increase in mean body mass index (BMI) or obesity prevalence over that time period in non-Hispanic white and Hispanic women, but continued increases in men and non-Hispanic black and Mexican-American women.5 In Australia, the latest reported data suggest a continued increase in obesity prevalence in adults to 2012.6 However, prevalence data are driven by a range of factors, including migration, mortality and response bias. To determine whether the degree of weight gain in the population has slowed over time, a comparison of the rates of weight change is required.
We aimed to analyse whether the degree of change in weight and waist circumference (WC) over time differed in a single cohort of adults, comparing weight and WC change in the same individuals between two consecutive time periods, adjusting for age. We used the national Australian Diabetes, Obesity and Lifestyle cohort (AusDiab),7 and compared annualised change in weight and WC between 2000 and 2005 to that between 2005 and 2012.
Methods
Setting and participants
The AusDiab is a population-based, stratified-cluster survey of 11 247 adults aged ≥25 years, recruited in 1999–2000 (AusDiab1). Methods and response rates have been described previously.7 Five-year follow-up was conducted in 2004–2005 (AusDiab2) and a 12-year follow-up was conducted in 2012 (AusDiab3). From the original cohort, 6400 and 4614 returned for physical examination and interviewer-administered questionnaire at AusDiab2 and AusDiab3, respectively. For this analysis, we excluded participants with missing data on weight or WC at any of AusDiab 1, 2 or 3, leaving 3908 participants. We further excluded those participants missing any of the variables used as covariates at AusDiab 1 or 2, resulting in a final sample size of 3351. All participants consented to participate in the study.
All study assessments followed a similar protocol.7 ,8 Data were collected by interviewer-administered questionnaires on medical history, lifestyle and health behaviour.
Outcomes
Height was measured without shoes, using a stadiometer and recorded to the nearest 0.5 cm. Weight was measured without shoes, excess clothing and items in pockets by a single measurement at each survey. Weight at AusDiab1 was measured using a mechanical beam balance. Weight at AusDiab 2 and 3 was measured using digital weighing scales. Weight was recorded to the nearest 0.1 kg. At all surveys, scales were calibrated using 5 kg weights prior to each set of measurements. BMI was obtained from the calculation of weight (kg) divided by height (m2). Annual weight change was calculated as the difference in weight between AusDiab 1 and 2 (period 1), or AusDiab 2 and 3 (period 2), divided by the follow-up time between the two consecutive surveys.
WC was measured twice, halfway between the lower border of the ribs and the iliac crest on a horizontal plane. If measurements varied by >2 cm, a third was taken; the mean of the two closest measurements was calculated. Annualised WC change was calculated as the difference in WC between AusDiab 1 and 2, or AusDiab 2 and 3, divided by the follow-up time between the two consecutive surveys.
Cofactors
Data on education, country of birth, smoking and physical activity and television viewing habits were obtained by questionnaire. Self-reported cardiovascular disease was ascertained by asking whether participants had been told by a doctor or nurse that they had angina, myocardial infarction or stroke.
Smoking status was defined as (1) current daily smoker and (2) ex-smoker (smoking less than daily for at least the last 3 months, but used to smoke daily) and non-smoker (never smoked tobacco daily) combined.7 ,9
Education level was ascertained by asking the question ‘Which of these describes the highest qualification you have received?’ Education was categorised as secondary only (comprising those with a secondary school qualification), diploma (comprising nursing or teaching qualification, trade certificate or undergraduate diploma) and degree (comprising bachelor degree, postgraduate diploma or masters degree/doctorate).10
Area-level socioeconomic disadvantage was estimated using the Index of Relative Disadvantage code from the Socioeconomic Indexes for Areas (SEIFA). The index was developed by the Australian Bureau of Statistics, to create a summary measure from a group of 20 variables (related to education, income, employment, family composition, housing benefits, car ownership, ethnicity, English language proficiency, residential overcrowding) displaying dimensions of social disadvantage.11 The index is constructed so that high values reflect areas with high socioeconomic status (relative advantage) and low values reflect areas with low socioeconomic status (relative disadvantage). Tertiles of disadvantage were calculated among the final study sample.
Physical activity was measured via an interviewer-administered Active Australia questionnaire, which considered participation in predominantly leisure-time physical activities (including walking for transport) during the previous week.12 Total physical activity time was calculated as the sum of the time spent walking (if continuous and for ≥10 min) or performing moderate-intensity activity, plus double the time spent in vigorous-intensity physical activity.13
Self-reported television viewing time was calculated as the total time spent watching television or videos in the previous week, and is considered a reliable and valid estimate of television viewing time among adults.14
Average daily energy intake was assessed using a self-administered food frequency questionnaire (FFQ),15 which included 74 items (with 10 frequency options), with additional questions on food habits, portion size and consumption of alcoholic beverages. In AusDiab 1, blood pressure was measured using a standard mercury sphygmomanometer in the state of Victoria only and by Dinamap elsewhere. To account for any effect due to differential measurement error, manual blood pressure measurements were adjusted as previously described.16 In AusDiab 2 and 3, blood pressure was measured by an Omron machine. Fasting serum total cholesterol was measured with an Olympus AU600 analyser (Olympus Optical, Tokyo, Japan) at a central laboratory.17
Classification of diabetes status has been described elsewhere.17 Briefly, participants were classified as having ‘known diabetes’ if they reported having doctor diagnosed diabetes and were either taking hypoglycaemic medication or had fasting plasma glucose (FPG) ≥7 mmol/L or a 2 h plasma glucose (PG) ≥11.1 mmol/L. Participants not reporting diabetes but with FPG ≥7 mmol/L or 2-h PG ≥11.1 mmol/L were classified as having ‘newly diagnosed diabetes’.
Statistical analysis
Baseline characteristics (means and proportions at AusDiab 1) were compared between AusDiab participants with and without complete measures at AusDiab 1, 2 and 3. Characteristics of the included population were also compared in 2000 and 2005, representing the two baseline surveys for the two weight change periods.
The difference in annualised weight and WC change in period 1 (2000–2005), compared with period 2 (2005 and 2012), was assessed using linear regression analysis. Generalised linear mixed models with random effects were used to analyse the association between study period on annual weight and WC change. This model includes random effects associated with the cluster and the units of analysis (participants) to take the clustered structure of the data into account and to allow the residuals associated with the longitudinal measures on the same unit of analysis to be correlated. Models were adjusted sequentially for age and sex (model 1), additionally adjusting for smoking, education, area level disadvantage and country of birth (model 2), additionally adjusting for baseline BMI and diabetes status (model 3) and additionally adjusting for baseline TV time, exercise time and energy intake (model 4). Baseline refers to the variables measured at AusDiab 1 for change in period 1, and AusDiab 2 for change in period 2. Adjustment for age enables the differences in weight and WC change observed between the two periods to be attributed to time rather than age. The association between study period and annualised weight and WC change was also analysed across subgroups, and interaction terms between study period with age or sex were analysed.
The primary analyses were repeated after excluding the few participants with annual weight change greater than 5 kg/year or less than –5 kg/year, and restricting participants to the overlapping age group of 30–80.
All analyses were performed in STATA (V.11.0), with statistical significance set at the 5% level.
Results
The population with complete measures was similar to the total AusDiab cohort with respect to sex and weight, but was younger, with higher educational attainment and a higher prevalence of never smoking (table 1). The population with complete measures also had a lower prevalence of chronic disease. There was no appreciable difference between the two groups for weight change in period 1 after adjustment for differences in age and sex.
Comparison of characteristics in 1999/2000 between the included and excluded population
Participant characteristics in 2000 and 2005 were compared (table 2). In 2005, in addition to being 5 years older, the population had a higher prevalence of diabetes (predominantly type 2). In both periods, the average change in weight and WC was a gain. In period 2, a smaller proportion of the population gained weight and annualised weight gain was less at 0.13 kg/year compared with 0.34 kg/year in period 1. This difference resulted from a lesser weight change across the entire distribution of weight change in period 2, with minimal difference at the 5th centile, increasing to a difference of 0.50 kg/year at the 95th centile of weight change (online supplementary appendix figure 1A). For WC, there was no difference in the crude annualised change between the two periods (table 2). In contrast to weight change, this resulted from a smaller gain in those whose WC increased and a smaller loss in those whose WC decreased (online supplementary appendix figure 1B). The correlation between weight and WC change was 0.69 (0.68 in period 1, and 0.71 in period 2).
Characteristics of the cohort in 1999/2000 and 2005
Comparison of the crude annualised weight change for matching 10-year age-groups in periods 1 and 2 indicated a smaller weight gain in period 2 for most of the age and sex groups, although these differences were only significant for men aged 35–44 and women aged 45–54 and 65–74 (table 3). Comparison of the crude annualised WC change for matching age-groups in periods 1 and 2 indicated no difference in WC gain between the two periods for women and a generally larger WC gain in period 2 for men (significant for men aged 45–54 and 55–64; table 3).
Comparison of annualised weight and waist circumference change between periods 1 and 2 for matching age groups
The difference in annualised weight and WC change in period 2, compared with period 1, was assessed using linear regression analysis (table 4). In period 2, annualised weight gain was 0.11 kg/year (95% CI 0.06 to 0.15) less than in period 1. This did not alter substantially after further adjustment for smoking status, education status, ethnicity, area-level socioeconomic disadvantage, baseline BMI and diabetes status (table 4A), nor after adjustment for TV time, exercise time and energy intake (results not shown).
Difference in annualised change in weight (kg/year) (A) and waist circumference (cm/year) (B) in period 2 compared with period 1
Annualised weight gain in period 2 was less than in period 1 for most subgroups (table 4A), with suggestions of a greater difference over time in women, and those aged under 55 years (although no interaction tests on these factors were significant). Annualised weight gain in period 2 was non-significantly less than in period 1 for those with high educational attainment (borderline significant), obesity and those from a non-English speaking background. No difference in annualised weight gain between the two periods was observed for those in the tertile of greatest area-level socioeconomic disadvantage, or for current smokers.
In period 2, annualised WC gain was 0.07 cm/year more than in period 1 (table 4B). This did not alter substantially after further adjustment for smoking status, education status, area-level socioeconomic disadvantage, ethnicity, baseline BMI and diabetes status (table 4B), or after adjustment for TV time, exercise time and energy intake (results not shown).
In stratified analyses, no difference in annualised WC gain between the two periods was observed for women, those aged <55 years, those in the highest education group, those with normal weight or ex-smokers. Annualised WC gain was less in period 2 than in period 1 for those in the tertile of least area-level socioeconomic disadvantage (–0.14 cm/year, 95% CI −0.05 to −0.23 cm/year).
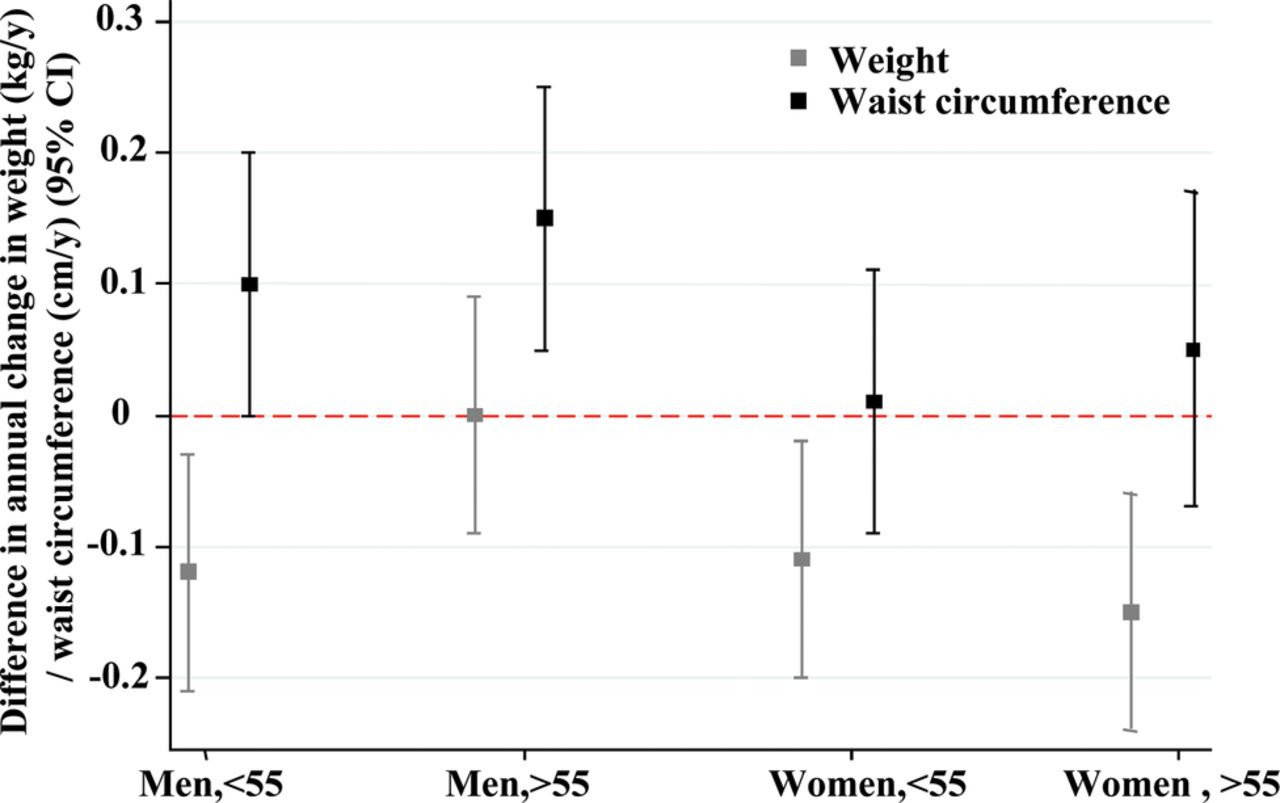
For weight and WC, there was an apparent combined sex and age effect, such that older men had the least favourable changes over time (figure 1).

Difference in annualised change in weight (kg/year) or waist circumference (cm/year) between periods 2 and 1, by age and sex. Adjusted for age.
The primary analyses were repeated after excluding the few participants with annual weight change greater than 5 kg/year or less than −5 kg/year, and restricting the participants to the overlapping age group of 30–80. No differences in results were seen.
Discussion
In this analysis of a single cohort of Australian adults, weight and WC increased in the most recent period in all population subgroups examined. Age-adjusted annualised weight gain between 2005 and 2012 was less than between 1999/2000 and 2005, but annualised WC gain was greater. Lesser weight gain over time was not seen in older men or those with greatest area-level socioeconomic disadvantage.
The lack of difference in weight and WC change between the two periods observed for current smokers, those from a non-English speaking background and those with obesity is likely to reflect small sample sizes in these groups. In general, adjustment for covariates had little effect on the observed associations between study period and weight and WC change. As time spent watching TV, exercise and energy intake might be expected to be mediating much of the observed changes, we had expected an observable reduction in the difference between study periods after adjustment for these factors. The lack of impact after adjustment likely reflects that they are relatively blunt instruments to detect small changes in behaviour over time. The self-reported nature of these behavioural questionnaires is associated with differential and non-differential errors.18 ,19 While validated, the FFQ has a limited list of foods and is affected by the inability of individuals to accurately report their food intake retrospectively over a long period of time.20 Furthermore, the Active Australia questionnaire only refers to leisure-time activity, and TV watching is only one component of sitting time.
The general observation that weight gain may be lessening over time supports the cross-sectional time series observations of a plateau in the prevalence of obesity and rate of change in BMI.4 However, these results also suggest that the general observations do not tell the whole story, with large differences between different population subgroups, and a contrasting observation for WC. The sex differences observed here are similar to the cross-sectional trends reported for American adults for whom a clear plateau in obesity prevalence has been observed for women but not for men.5 The differences we observed according to level of area-level socioeconomic disadvantage also reflect findings from the review of obesity trends in which the levelling-off of obesity was generally more pronounced in groups with higher socioeconomic position.4 It will be important to perform a similar analysis in a longitudinal children's cohort, as their experience is likely to differ from that of adults. Children have been exposed to a wide range of obesity prevention interventions, particularly in schools, and in countries such as Australia, and cross-sectional trends clearly suggest a plateauing in the prevalence of obesity in children.4
The observation that rates of WC change may be continuing to increase even as rates of weight change decrease may reflect prior findings using the NHANES data that WC increased to a greater extent than expected from changes in weight.21 ,22 While we observed changes in weight and WC to be highly correlated, these results combined suggest a preferential increase in abdominal adiposity over time, which is thought to be associated with a greater risk of cardiometabolic outcomes.23 The potential implication that the current bodyweight trends are leading to a more metabolically active obesity, with increased risks for outcomes such as diabetes, hypertension and cardiovascular disease warrants further investigation.
The key strength of the current study is that for the first time it addresses this important question through an analysis of the same cohort of adults over two distinct but recent time periods, independent of the effects of ageing. Therefore, conclusions can be drawn about the changes over time independent of unmeasurable differences in cohorts. Other strengths include the national population sampling strategy of the AusDiab cohort and the measured weight and WC at each study wave.
The potential limitation of the current study is the lack of generalisability of the included cohort. As with all cohort studies, the AusDiab cohort is a selected population, and those who attended all three waves are more select again, with a higher educational attainment and a lower prevalence of chronic disease and risk factors. It is possible that a generally more healthy and health conscious population has a stronger response to population health messages, and consequently the lesser weight gain observed here in consecutive age cohorts over time may be greater than would be observed for the general population. However, the current observations lend support to the concept that weight gain is decreasing over time in the population, even if the AusDiab cohort represents a particularly sensitive indicator. One further potential limitation is the use of different weighing scales at AusDiab 2 and 3 compared with AusDiab 1. Although all scales were calibrated in the same way at each survey wave, differences in variability between the scales may have led to more variability in the change in weight in period 1 than period 2.
The results also suggest that there is no room for complacency in obesity prevention. The rates of overweight and obesity remain high, the average change in weight and WC remains increased and there is no reduction in the rate of WC gain. Furthermore, no decrease in the rate of weight or WC change was observed in older men. Finally, the observation that no decrease in rates of weight and WC change is being seen by those living in the most socially disadvantaged neighbourhoods suggests that current trends are likely to lead to an increase in the social inequalities in obesity, and consequent ill health.24 It is critical that further studies are conducted to confirm these findings and that we work to identify the causes of the observed changes, including the differences observed in specific population subgroups.
In summary, between 2004/2005 and 2011/2012, Australian adults continued to gain weight: WC at a faster rate than between 1999/2000 and 2004/2005, and weight at a slower rate. While weight gain may be slowing, it does not appear to be affecting older men or those in more disadvantaged groups, and the same cannot be said for WC.
Acknowledgments
The authors would like to acknowledge all AusDiab participants, investigators and sponsors. The authors would like to acknowledge Parneet Sethi for useful discussions on this work.
References
Supplementary materials
Supplementary Data
This web only file has been produced by the BMJ Publishing Group from an electronic file supplied by the author(s) and has not been edited for content.
Files in this Data Supplement:
- Data supplement 1 - Online appendix
Footnotes
-
Contributors AP conceived the article, executed the analysis and writing of the article and is the guarantor for the article. JES, DJM and KB contributed to the ideas included within and writing of the article, and provision of data. PZ contributed to the writing of the article and provision of data.
-
Funding This work was supported by VicHealth (fellowship, AP), the Australian National Preventive Health Agency (Project grant) and Australia Research Council (ARC-linkage grant LP12010041). The Australian Diabetes, Obesity and Lifestyle study (AusDiab), co-coordinated by the Baker IDI Heart and Diabetes Institute, was supported in part by the Victorian Government's OIS Programme, and gratefully acknowledges the generous support given by National Health and Medical Research Council (NHMRC grant 233200), Australian Government Department of Health and Ageing. Abbott Australasia Pty Ltd, Alphapharm Pty Ltd, AstraZeneca, Bristol-Myers Squibb, City Health Centre-Diabetes Service-Canberra, Department of Health and Community Services—Northern Territory, Department of Health and Human Services—Tasmania, Department of Health—New South Wales, Department of Health—Western Australia, Department of Health—South Australia, Department of Human Services—Victoria, Diabetes Australia, Diabetes Australia Northern Territory, Eli Lilly Australia, Estate of the Late Edward Wilson, GlaxoSmithKline, Jack Brockhoff Foundation, Janssen-Cilag, Kidney Health Australia, Marian & FH Flack Trust, Menzies Research Institute, Merck Sharp & Dohme, Novartis Pharmaceuticals, Novo Nordisk Pharmaceuticals, Pfizer Pty Ltd, Pratt Foundation, Queensland Health, Roche Diagnostics Australia, Royal Prince Alfred Hospital, Sydney, Sanofi Aventis and Sanofi Synthelabo. JES is supported by a National Health and Medical Research Council Fellowship (586623).
-
Competing interests None.
-
Ethics approval Ethics approval was obtained from the International Diabetes Institute, Monash University, and the Alfred Hospital Melbourne.
-
Provenance and peer review Not commissioned; externally peer reviewed.
-
Data sharing statement No additional data are available.