Article Text

Abstract
Objective To characterise the oral microbiome, gut microbiome and serum lipid profiles in patients with active COVID-19 and recovered patients; evaluate the potential of the microbiome as a non-invasive biomarker for COVID-19; and explore correlations between the microbiome and lipid profile.
Design We collected and sequenced 392 tongue-coating samples, 172 faecal samples and 155 serum samples from Central China and East China. We characterised microbiome and lipid molecules, constructed microbial classifiers in discovery cohort and verified their diagnostic potential in 74 confirmed patients (CPs) from East China and 37 suspected patients (SPs) with IgG positivity.
Results Oral and faecal microbial diversity was significantly decreased in CPs versus healthy controls (HCs). Compared with HCs, butyric acid-producing bacteria were decreased and lipopolysaccharide-producing bacteria were increased in CPs in oral cavity. The classifiers based on 8 optimal oral microbial markers (7 faecal microbial markers) achieved good diagnostic efficiency in different cohorts. Importantly, diagnostic efficacy reached 87.24% in the cross-regional cohort. Moreover, the classifiers successfully diagnosed SPs with IgG antibody positivity as CPs, and diagnostic efficacy reached 92.11% (98.01% of faecal microbiome). Compared with CPs, 47 lipid molecules, including sphingomyelin (SM)(d40:4), SM(d38:5) and monoglyceride(33:5), were depleted, and 122 lipid molecules, including phosphatidylcholine(36:4p), phosphatidylethanolamine (PE)(16:0p/20:5) and diglyceride(20:1/18:2), were enriched in confirmed patients recovery.
Conclusion This study is the first to characterise the oral microbiome in COVID-19, and oral microbiomes and lipid alterations in recovered patients, to explore their correlations and to report the successful establishment and validation of a diagnostic model for COVID-19.
- intestinal microbiology
- lipid metabolism
- COVID-19
Data availability statement
Data are available in a public, open access repository. The raw Illumina read data for all samples were deposited in the European Bioinformatics Institute European Nucleotide Archive database (PRJNA660302).
This is an open access article distributed in accordance with the Creative Commons Attribution Non Commercial (CC BY-NC 4.0) license, which permits others to distribute, remix, adapt, build upon this work non-commercially, and license their derivative works on different terms, provided the original work is properly cited, appropriate credit is given, any changes made indicated, and the use is non-commercial. See: http://creativecommons.org/licenses/by-nc/4.0/.
Statistics from Altmetric.com
Significance of this study
What is already known on this subject?
COVID-19 has emerged as a global pandemic, resulting in over 100 million infections and over 2 million deaths.
However, as the gold standard for diagnosing COVID-19, nucleic acid testing through RT-PCR has been questioned due to a false negative rate of at least 20%, which was caused by various factors, including low virus titre, sampling error and experimental error.
The concept of the oral and faecal microbiomes serving as non-invasive diagnostic tools for specific diseases or viral diseases, including hepatocellular cancer and rheumatoid arthritis, has been demonstrated in many studies; however, it is unclear whether oral microbial markers could diagnose COVID-19.
The microbiome and lipids could affect specific disease progression; however, their characterisation and correlations in patients with COVID-19 are unknown.
Significance of this study
What are the new findings?
Oral and faecal microbial diversity were decreased from healthy controls (HCs) to patients with COVID-19, and were similar from suspected patients (SPs) to confirmed patients (CPs).
Butyric acid-producing bacteria were decreased and lipopolysaccharide-producing bacteria were increased in patients with COVID-19 versus HCs.
The optimal eight oral microbial markers (seven faecal microbial markers) were selected by fivefold cross-validation on a random forest model, and the classifier based on the optimal microbial markers was constructed and achieved an area under the curve (AUC) of 98.06% (99.74% in the faecal microbiome).
Importantly, oral microbial markers achieved cross-regional validation of COVID-19 from Central China and East China.
Oral and faecal microbial markers successfully diagnosed SPs with IgG antibody positivity as CPs, with an AUC of 92.11% (98.01% in the faecal microbiome).
The linkages among the oral microbiomes, faecal microbiomes, and serum lipid molecules contribute to CPs recovery.
How might it impact on clinical practice in the foreseeable future?
This is the first study to depict the oral microbiota in patients with COVID-19, and to characterise oral microbiomes and lipids in recovered patients through large cohort MiSeq sequencing.
Oral and gut microbial and lipid alterations may be involved in the development and recovery of COVID-19, which implies that intervention in the changed microbiome and lipids may contribute to recovery of COVID-19.
This is the first study to identify specific microbial markers and successfully construct a diagnostic model, achieving good diagnostic efficacy in three cohorts from two different regions of China. Meanwhile, based on the evidence of microbial characteristics, we first proposed and successfully diagnosed SPs with IgG positivity as COVID-19 positive using this model, suggesting that microbial markers could serve as an auxiliary tool for the non-invasive diagnosis of COVID-19.
The linkages between the microbiome and lipidomics may illustrate the mechanism of recovery of COVID-19.
Introduction
COVID-19 has rapidly spread worldwide, resulting in over 100 million infections and over 2 million deaths.1 However, as the gold standard for diagnosing COVID-19, nucleic acid testing through reverse transcription-PCR (RT-PCR) has been questioned due to a false negative rate of at least 20%.2 3 Therefore, it is urgent to search for a new diagnostic method.
ACE2 is a target of SARS-CoV-24 and is expressed in the lungs, livers, kidneys, brain, and small intestine epithelium. SARS-CoV-2 activates intestinal ACE2 receptors, inducing inflammation and causing GI symptoms and microbiome dysbiosis.5 6 The human microbiome is involved in host immunity and metabolism and is closely related to viral diseases. Alterations in the microbiome contribute to the onset and progression of H7N9 avian influenza (H7N9),7 HIV8 and HBV.9 10 Previous studies have reported gut or airway microbial characteristics in COVID-19 during hospitalisation and after recovery.11–15 However, oral microbiota in COVID-19 and recovered patients have not been reported. Moreover, microbial markers serving as a non-invasive diagnostic tool have been established in many diseases. Gu et al 16 constructed a classifier based on five gut microbial markers through 16S rRNA MiSeq sequencing. The classifier showed high accuracy for diagnosing COVID-19 with an area under the curve (AUC) of up to 0.89. Nevertheless, the diagnostic potential of the oral microbiome for COVID-19 has not been evaluated.
Metabolite changes can reflect disease progression.17 Short-chain fatty acids (SCFAs), as lipid metabolites of the microbiome, are involved in gene expression, inflammation, differentiation and apoptosis in host cells.18 In turn, SCFAs could provide energy for the microbiome, sustaining its survival. A previous study19 depicted proteomic and metabolomic characterisation of patients with COVID-19 and distinguished non-severe from severe patients. However, lipidomics in patients with COVID-19 and recovered patients has not yet been studied.
We hypothesised that the oral and gut microbiomes are involved in the development of COVID-19 and could serve as an auxiliary diagnostic tool. Moreover, the interaction between lipidomics and the microbiome may contribute to the progression and recovery of COVID-19. To test this hypothesis, we applied 16S rRNA MiSeq sequencing and lipidomics technologies in 392 tongue-coating samples, 172 faecal samples and 155 serum samples to analyse human microbiome and lipidomics of patients with COVID-19 and recovered patients.
Methods
Study profile
This research was performed based on the prospective specimen collection and retrospective blinded evaluation design principles.20
A total of 957 samples of 3 types from Central and East China were collected prospectively, including 496 tongue-coating samples, 226 faecal samples and 235 serum samples (figure 1). After rigorous inclusion and exclusion criteria, 719 samples were included for further analysis. Among them, samples from healthy controls (HCs) were collected before October 2019 in Henan, China, and samples from recovered patients were collected 2 days before discharge from isolated regions. Tongue-coating samples and faecal samples were used for 16S rRNA MiSeq sequencing, and serum samples were used for ultra-performance liquid chromatography-mass spectrometry (UPLC-MS) analysis. Clinical data and participants’ demographics were collected and analysed (table 1). The online supplemental methods showed enrolment process, inclusion, exclusion and detailed diagnostic criteria of the participants. All enrolled patients received standard treatment according to the routine treatment of ‘diagnosis and treatment programme trial V.5 (or V.6) guidelines’ issued by the National Health Commission of the People’s Republic of China.21 22
Supplemental material

Study design and flow diagram. A total of 957 samples of 3 types from Central China and East China were collected prospectively, including 496 tongue-coating samples, 226 faecal samples and 235 serum samples. After rigorous inclusion and exclusion criteria, 719 samples were included for further analysis, including 392 tongue-coating samples (72 CPs, 37 SPs, 22 CPRs, 37 paired SPRs and 150 HCs from Henan and 74 CPs from Hangzhou), 172 faecal samples (36 CPs, 23 SPs, 18 CPRs, 23 SPRs and 72 HCs from Henan) and 155 serum samples (73 CPs, 30 SPs, 22 CPRs and 30 SPRs). Oral and faecal samples were sequenced using 16S rRNA MiSeq to characterise the microbiome and construct diagnostic model, and serum samples were detected using UPLC-MS to characterise lipid molecules. HCs, healthy controls; CPs, confirmed patients; SPs, suspected patients; CPRs, confirmed patients who recovered; RFC, random forest classifier; SPRs, suspected patients who recovered; UPLC-MS, ultra-performance liquid chromatography-mass spectrometry.
Clinical characteristics of participants in the oral and stool discovery cohort
Supplemental material
Supplemental material
The collection, transportation, storage and testing of specimens were strictly managed according to highly pathogenic microorganisms of type II according to the prevention and control protocol for COVID-19 (fifth edition).23
Faecal and tongue-coating sample collection and DNA extraction
Each participant offered a fresh tail stool sample at 06:00–10:00 hours. The samples were inactivated at 70°C for 1 hour and then divided into three equal parts of 200 mg and immediately stored at −80°C. We discarded samples that were at room temperature for >2 hours.
Before taking tongue-coating samples, participants used sterile water to rinse their mouths twice. The posterior middle to anterior middle area of the tongue coating was scraped by a professional operator with a pharyngeal swab. The swab was immediately placed into a cryotube, virus was inactivated at 56°C for 30 min and then the sample was transferred to the freezer at −80°C. The DNA extraction process was performed as we described previously24 (online supplemental methods).
PCR amplification, MiSeq sequencing and data processing
PCR amplification and DNA library construction were performed according to standard protocols, and sequencing was performed on an Illumina MiSeq platform by Shanghai Mobio Biomedical Technology, China. Raw Illumina read data for all samples were deposited in the European Bioinformatics Institute European Nucleotide Archive database (PRJNA660302). The details of PCR amplification and sequence data processing are shown in the online supplemental methods.
Operational taxonomy unit clustering and taxonomy annotation
Reads with equal numbers from all samples were randomly selected, and operational taxonomy units (OTUs) were binned by the UPARSE pipeline.25 All OTUs for all samples in the discovery phase, validation phase and independent phase were collected. We set the identity threshold to 0.97. According to the developer’s documents (http://rdp.cme.msu.edu/classifier/class_help.jsp%23conf), RDP classifier V.2.626 was used to annotate sequences.26 We further analysed microbial diversity and performed taxonomic analysis (details in the online supplemental methods).
Identification of the OTU biomarkers and construction of probability of disease
The discovery OTU frequency profile, validation frequency profile and independent diagnosis frequency profile were generated by mapping reads from the discovery cohort, validation cohort and independent diagnosis cohort against these represented sequences, respectively. Then, we used the Wilcoxon rank-sum test to determine the significance (p<0.05), and OTU biomarkers in the oral and faecal microbiomes were selected for further analysis. We constructed a diagnostic model through fivefold cross-validation on a random forest model and evaluated the probability of disease (POD) index and receiver operating characteristic curve. The process was performed as we described in a previous study (online supplemental methods).24
Serum sample collection, lipidomics detection and data analysis
All collected blood samples were prepared by centrifugation at 3000 rpm for 10 min, and the upper layer was carefully collected to obtain serum. Serum samples were inactivated by adding ethanol, shaken vigorously, dried in a biosafety hood and then stored at −80°C. All samples were thawed slowly at 4°C.
We detected serum IgG against SARS-CoV-2 using standard kits and detected lipidomics through UPLC-MS analysis, and analysed the original lipid data using LipidSearch V.4.1 and metaX (online supplemental methods).
Statistical analysis
Differences between two groups were compared by using Student’s t-test for normal continuous variables, the Wilcoxon rank-sum test for non-normal continuous variables and the χ2 test or Fisher’s exact test for categorical variables. Differences among three groups were assessed by using one-way analysis of variance for normal continuous variables and the Kruskal-Wallis test for non-normal continuous variables. Differences with a p value <0.05 (two-sided) were considered statistically significant. Statistical analyses were performed using SPSS V.20.0 for Windows (SPSS, Chicago, Illinois, USA).
Results
Study design and flow diagram
After excluding, 719 samples were included for further analysis (figure 1), including 392 tongue-coating samples (72 confirmed patients (CPs), 37 suspected patients (SPs), 22 CPs who recovered (CPRs), 37 paired SPs who recovered (SPRs), 150 HCs from Henan and 74 CPs from Hangzhou), 172 faecal samples (36 CPs, 23 SPs, 18 CPRs, 23 SPRs and 72 HCs from Henan) and 155 serum samples (73 CPs, 30 SPs, 22 CPRs, and 30 SPRs).
Tongue-coating and faecal samples from CPs and HCs were randomly divided into the discovery phase and validation phase. In the discovery phase, we characterised the oral microbiome in 48 CPs and 100 HCs (faecal microbiome in 24 CPs and 48 HCs), identified the key oral or faecal microbial markers, and constructed COVID-19 classifiers by a fivefold cross-validation random forest model. In the validation phase, we verified the diagnostic efficacy of the COVID-19 classifier based on the oral microbiome in 24 CPs and 50 HCs (faecal microbiome in 12 CPs and 24 HCs). Furthermore, 74 tongue-coating samples from Hangzhou were used to validate the cross-regional diagnostic efficacy of the COVID-19 classifier. In addition, 37 tongue-coating samples (23 faecal samples) from SPs with IgG positivity were used to test whether the COVID-19 classifier could diagnose SPs as COVID-19 positive. Finally, we characterised the oral and faecal microbiomes and serum lipid molecules in patients with COVID-19 and recovered patients. Moreover, correlations between the microbiome and lipids and between the microbiome and clinical parameters were analysed.
Characteristics of the participants
In the discovery cohort, the clinical characteristics of CPs and HCs were shown in table 1 (online supplemental table S1). Sex and age were well matched between two groups. In the tongue-coating and faecal groups, compared with HCs, white blood cells (WBCs) (p<0.01), lymphocytes (p<0.0001) and blood platelets (p<0.0001) were decreased, while aspartate aminotransferase (p<0.05) was increased in CPs. The most common signs or symptoms at admission were fever and cough.
Non-invasive diagnostic model for COVID-19 based on the oral microbiome
Rarefaction analysis of the discovery cohort showed that OTU richness in each group approached saturation (figure 2A and online supplemental figure S1A). As estimated by the Shannon index and Simpson index, oral microbial diversity was significantly decreased in the CPs versus HCs (all p<0.001) (figure 2A and online supplemental figure S1B, online supplemental table S2). The Venn diagram showed that 1392 of 2407 OTUs were common to both groups, while 685 OTUs were unique to the CPs (online supplemental figure S1C). Principal coordinate analysis (PCoA) analysis was performed to display microbiome space between samples, and beta diversity results showed a significant distinction of oral microbial communities between both groups (figure 2B and online supplemental figure S1D).
Supplemental material
Supplemental material
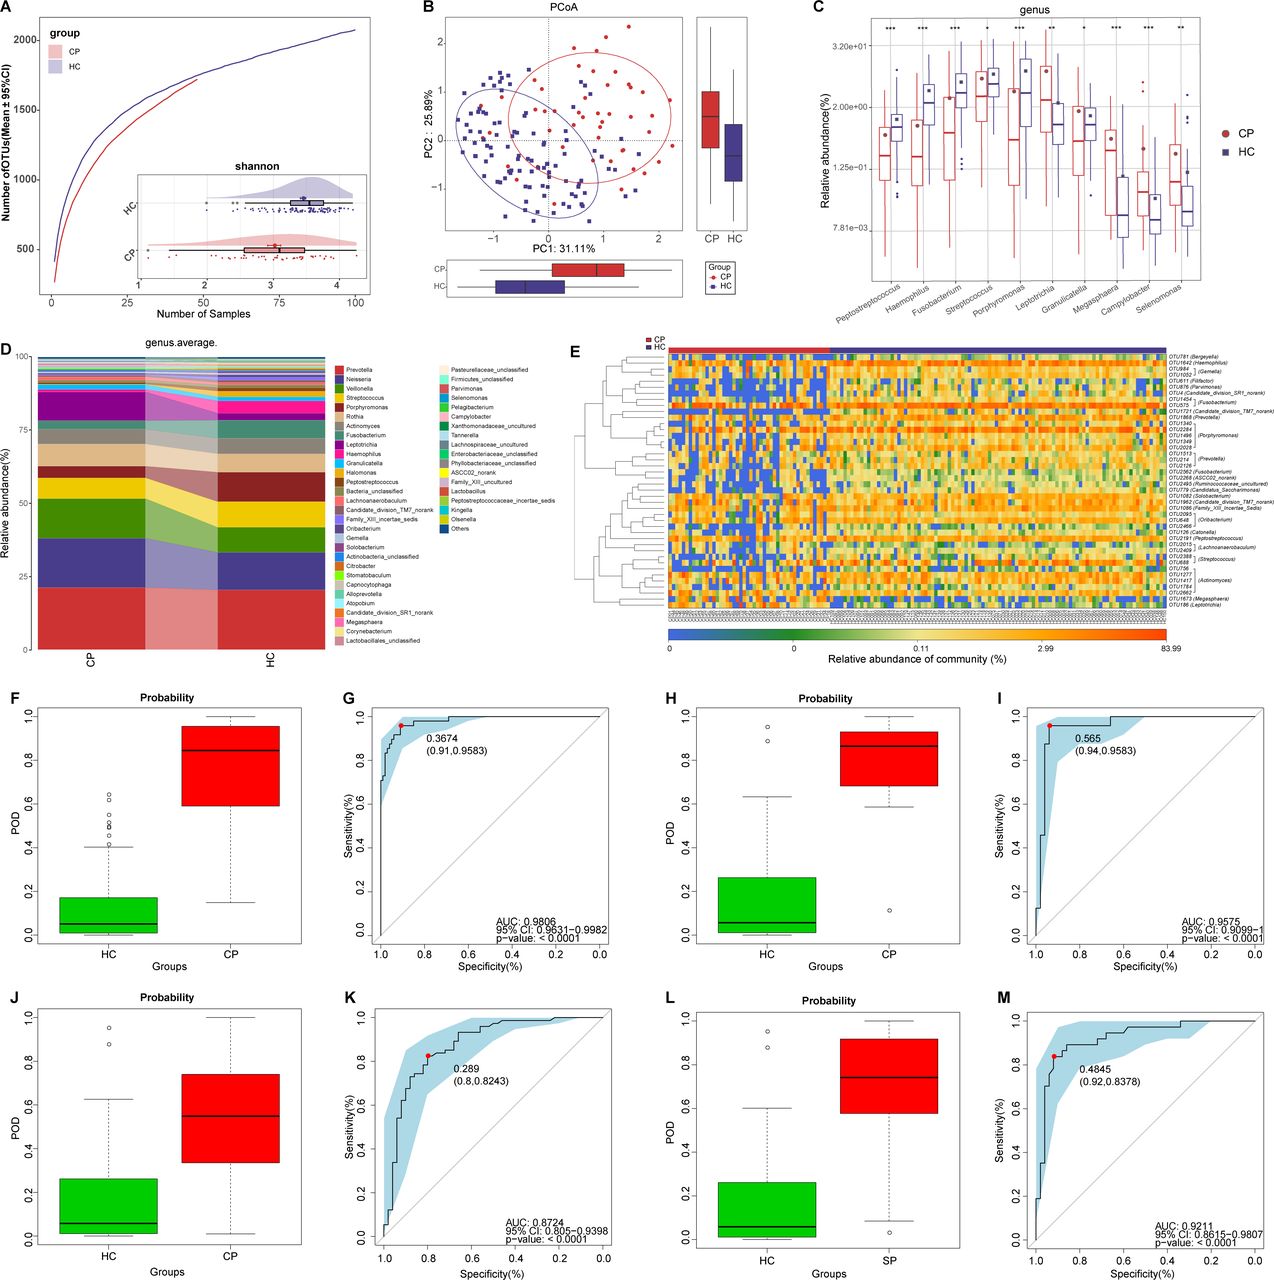
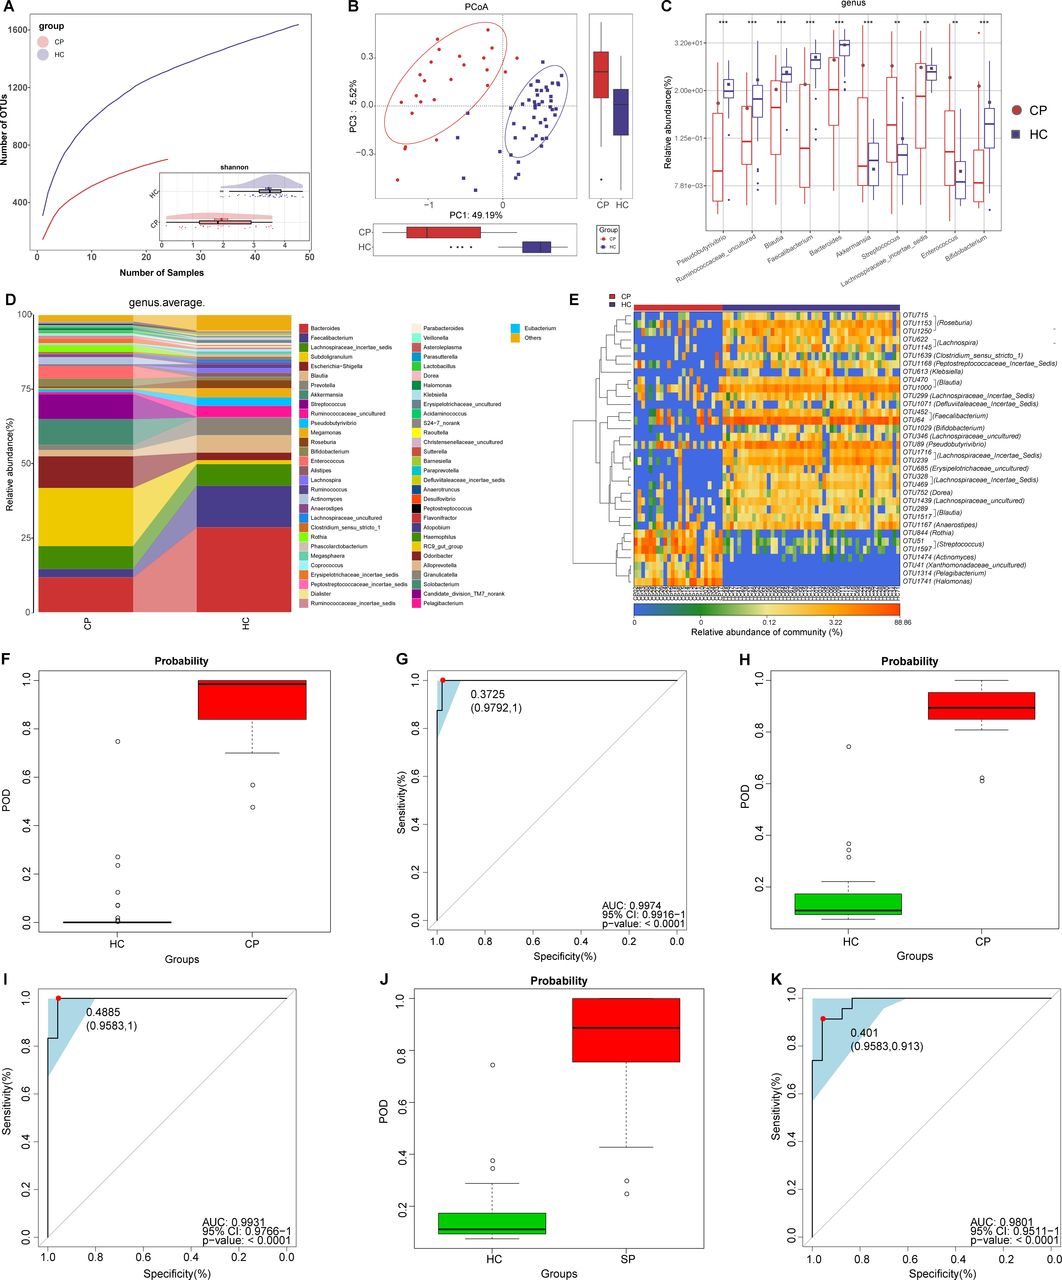
Non-invasive diagnostic model for COVID-19 based on the oral microbiome. (A) Rarefaction analysis between the number of samples and the number of OTUs. As the number of samples increased, the number of OTUs approached saturation in CPs (n=48) and HCs (n=100). Compared with the HCs, the number of OTUs in CPs was decreased. As estimated by the Shannon index, oral microbial diversity was significantly decreased in CPs compared with HCs. (B) The PCoA based on OTU distribution showed that the oral taxonomic composition was significantly different between both groups. (C) Compared with HCs, five genera were significantly enriched, while five genera were significantly reduced in CPs. (D) Average compositions and relative abundance of the bacterial community in both groups at the genus level. (E) Heatmap of the relative abundances of differential OTUs for each sample in both groups. The POD value was significantly increased in CPs compared with HCs, and achieved good diagnostic efficacy in the discovery cohort (F and G), the validation cohort (H and I) and the independent cohort (J and K). Compared with HCs, the POD value was significantly increased in SPs (L), achieving an AUC value of 0.9211 (M). *P<0.05, **p<0.01, ***p<0.001. AUC, area under the curve; CPs, confirmed patients; HCs, healthy controls; OTUs, operational taxonomy units; PCoA, principal coordinate analysis; POD, probability of disease; SPs, suspected patients. Centerline, median; box limits, upper and lower quartiles; circle or square symbol, mean; error bars, 95% CI.
At the genus level (figure 2D), five dominant bacteria, Prevotella, Neisseria, Veillonella, Streptococcus and Porphyromonas, together accounted for 60% on average in both groups (online supplemental table S3). The average composition and relative abundance of the oral microbiome at the genus and phylum levels are displayed in figure 2D and online supplemental figure S1F. Different analyses at the phylum level are presented in online supplemental figure S1E (online supplemental table S4).
Compared with HCs, five genera including Porphyromonas and Fusobacterium were depleted, while five genera including Leptotrichia and Selenomonas were increased in CPs (all p<0.05) (figure 2C) (online supplemental table S4). Among them, Porphyromonas and Fusobacterium belong to butyrate-producing bacterial families,27 while Leptotrichia and Selenomonas produce lipopolysaccharides. As a SCFA, butyric acid plays an important anti-inflammatory role.18 Moreover, lipopolysaccharide could activate the nuclear factor kappa B (NF-κB) pathway and toll-like receptor, promote proinflammatory cytokines and activate immunoreactions.28 Therefore, the decrease in butyric acid-producing bacteria and the increase in lipopolysaccharide-producing bacteria may be involved in the inflammatory response in patients with COVID-19.
The heatmap shows that 3 OTUs were enriched in CPs, while 45 OTUs were enriched in HCs (figure 2E, online supplemental table S5). We further performed linear discriminant analysis (LDA) effect size (LEfSe) analysis and selected the most representative genera closely correlated with CPs based on LDA (online supplemental figure S1G and table S6).
To assess the diagnostic value of oral microbial markers for COVID-19, we constructed a random forest classifier model between 100 HCs and 48 CPs. Initially, 8 OTUs that could accurately identify differences between both groups were selected as the optimal marker set through fivefold cross-validation in the random forest model (online supplemental figure S1H,I). Then, we calculated the POD index of the discovery cohort by using an 8-OTU set (online supplemental tables S7–S10). The POD index was markedly higher in CPs than in HCs (figure 2F), and it reached an AUC of 98.06% (95% CI 96.31% to 99.82%, p<0.0001) (figure 2G). These data showed that oral microbial markers could specifically identify patients with COVID-19 from HCs.
Meanwhile, 24 CPs and 50 HCs in the validation cohort were used to verify the diagnostic efficacy of microbial biomarkers for CPs. The POD index (figure 2H) was significantly higher in CPs than in HCs, with an AUC value of 95.75% (95% CI 90.99% to 100%) between both groups (p<0.0001) (figure 2I). Additionally, we further collected 74 tongue-coating samples from Hangzhou CPs, which served as an independent diagnostic. The POD index (figure 2J) was markedly high in 74 Hangzhou CPs versus HCs, with an AUC value of 87.24% (95% CI 80.5% to 93.98%) between both groups (p<0.0001) (figure 2K). These results suggested that this classifier based on the oral microbiome for COVID-19 has powerful diagnostic efficacy.
Oral microbial characterisation among CPs, SPs and HCs
Nucleic acid testing by RT-PCR is recognised as the gold standard for COVID-19.3 However, the high false negative rate caused by various factors, including low virus titres and sampling mistakes, missed many CPs, thereby increasing the transmission range. Thus, it is urgent to search for a new auxiliary tool for the non-invasive diagnosis of COVID-19. We collected samples from 79 SPs and their matched SPRs, and after excluding patients with IgG antibody negativity during recovery, samples from 37 SPs and matched SPRs were used to validate the diagnostic value. The POD index (figure 2L) was markedly high in SPs versus HCs, with an AUC of 92.11% (95% CI 86.15% to 98.07%) between SPs and HCs (p<0.0001) (figure 2M), suggesting that this classifier may serve as an auxiliary tool for the non-invasive diagnosis of COVID-19. Moreover, serum IgG levels among 22 CPs, 37 SPs and 6 HCs were measured (figure 3A). IgG in CPs and SPs was significantly increased compared with that in HCs (p<0.0001, online supplemental table S11) and was higher than the upper limit of normal detection.

Oral microbial characterisation among CPs, SPs and HCs. (A) Levels of antibodies against SARS-CoV-2 in CPs (n=22), SPs (n=37) and HCs (n=6) during recovery. The positive judgement value of the kit was 10 U/mL (value >10 U/mL was defined as positive, and value <10 U/mL was defined as negative). The antibody levels in the figure were calculated as log2(value). (B) Rarefaction analysis between the number of samples and the number of OTUs. As the number of samples increased, the number of OTUs approached saturation in CPs (n=72), SPs (37) and HCs (n=150). Compared with the HCs, the number of OTUs in CPs and SPs was decreased. As estimated by the Shannon index, the oral microbial diversity of CPs and SPs was similar but significantly decreased compared with that of the HCs. (C) The PCoA based on OTU distribution showed that the oral microbial communities in the CPs and SPs were similar but significantly different from those in the HCs. (D) Average compositions and relative abundances of the bacterial communities in the three groups at the genus level. (E) Heatmap for the relative abundances of differential OTUs for each sample in the three groups. The PCoA showed that there was no significant difference in the oral microbiome distribution between CPs and SPs (F) or between CPRs and SPRs (G). (H) Average compositions and relative abundance of the bacterial community in the four groups at the genus level. CPs, confirmed patients; CPRs, confirmed patients who recovered; HCs, healthy controls; OTUs, operational taxonomic units; PCoA, principal coordinate analysis; SPs, suspected patients; SPRs suspected patients who recovered. Centerline, median; box limits or upper and lower lines, upper and lower quartiles; circle or square symbol, mean; error bars, 95% CI.
Each disease has its own unique oral microbial characteristics.24 We speculated that the same microbial characteristics may be derived from the same disease and analysed oral microbial characteristics among CPs, SPs and HCs to demonstrate the feasibility of identifying SPs with IgG positivity as CPs from the perspective of the microbiome.
The oral microbial diversity of CPs (n=72) and SPs (n=37) was similar (p>0.05) but significantly decreased versus HCs (n=150) (p<0.001) (figure 3B and online supplemental figure S2A and table S12). PCoA and heatmap showed that the oral microbiomes in CPs and SPs were similar but different from those in HCs (figure 3C,E and online supplemental figure S2B and table S14). A Venn diagram showed that 1280 of 2184 OTUs were shared between CPs and SPs (online supplemental figure S2C). The average compositions of the microbial genera and phyla are displayed in figure 3D and online supplemental figure S2D (online supplemental figure table S13). These results indicated that the oral microbial abundances and composition in SPs were basically consistent with those in CPs and different from those in HCs.
Supplemental material
PCoA showed that there was no significant difference in the oral microbiome distribution between CPs and SPs, as well as CPRs and SPRs (figure 3F,G). Furthermore, at the genus level (figure 3H, online supplemental table S15), oral microbiome variation between CPs and CPRs was approximately consistent with that between SPs and SPRs. These data indicated that oral microbial characteristics in SPs with positive IgG were consistent with those in CPs, and diagnosing SPs with positive IgG as COVID-19 by oral microbiome is feasible.
Oral microbial restoration along with recovery of patient with COVID-19
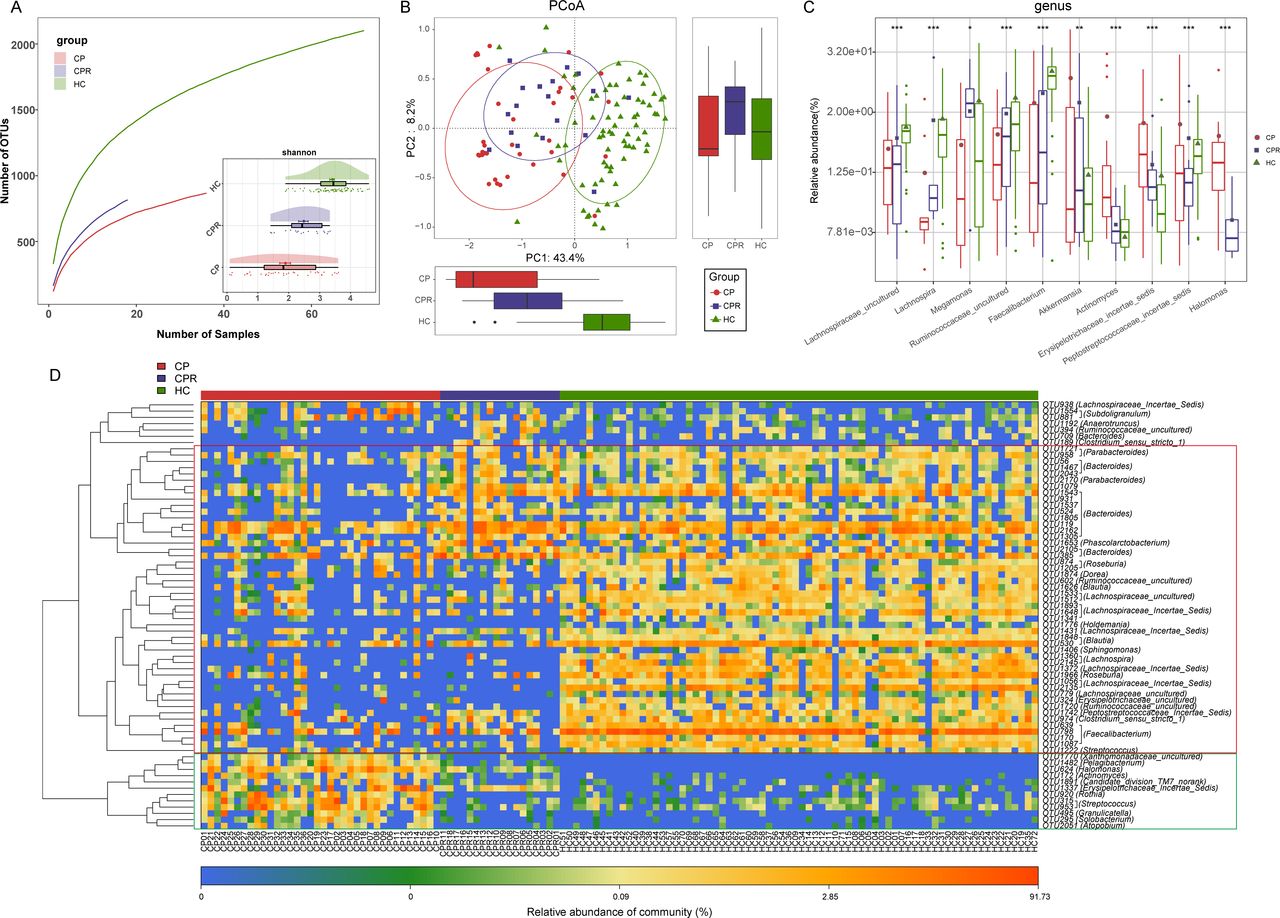
The oral microbial diversity in the CPRs was similar to that in the CPs but significantly decreased compared with that in the HCs (p<0.001) (figure 4A and online supplemental figure S2E and table S16). PCoA showed that the oral microbial distribution in CPRs was different from that in CPs and HCs (figure 4B, online supplemental figure S2F). A Venn diagram showed that 985 of 1012 OTUs in CPRs were shared with HCs, and 953 OTUs were shared with CPs (online supplemental figure S2G).

Oral microbial restoration along with recovery of patient with COVID-19. (A) Rarefaction analysis between the number of samples and the number of OTUs. As the number of samples increased, the number of OTUs approached saturation in CPs (n=72), CPRs (22) and HCs (n=150). Compared with the HCs, the number of OTUs in CPs and CPRs was decreased. As estimated by the Shannon index, oral microbial diversity in the CPRs was similar to that in the CPs but significantly decreased compared with that in the HCs. (B) The PCoA based on OTU distribution showed that the oral microbial communities in the CPRs were different from those in the CPs and HCs. (C) Along with the recovery of COVID-19, the relative abundances of five genera gradually increased and were significantly different among the three groups, while the abundances of five genera gradually decreased and were significantly different among the three groups. (D) Heatmap for the relative abundances of differential OTUs for each sample in the three groups. The red box represents a gradual increase in abundance of OTUs from left to right and the green box represents a gradual decrease in abundance of OTUs from left to right. *P<0.05, **p<0.01, ***p<0.001. CPs, confirmed patients; CPRs, confirmed patients who recovered; HCs, healthy controls; OTUs, operational taxonomic units; PCoA, principal coordinate analysis. Centerline, median; box limits, upper and lower quartiles; circle or square symbol, mean; error bars, 95% CI.
The average composition and relative abundance of the oral microbiome for three groups at the phylum and genus levels are displayed in online supplemental figure S2H,J (online supplemental table S17). Difference analysis at the phylum and genus levels is shown in online supplemental figure S2I and figure 4C (online supplemental table S18). Along with the recovery of COVID-19, the abundances of five genera such as Porphyromonas, Haemophilus and Family_XIII_incertae_sedis were persistently increased (p<0.001), while five genera including Leptotrichia, Megasphaera and Selenomonas were persistently decreased (p<0.01). Notably, Megasphaera was increased with dental caries progression.29 These similar results indicated that intervention with these bacteria may have an impact on patient outcomes. The heatmap also showed that oral microbial communities in CPRs were different from those in CPs and HCs, and the abundances of discrepant OTUs in CPRs ranged between CPs and HCs (figure 4D and online supplemental table S19). We performed LEfSe analysis and selected the most representative genera among three groups on LDA (online supplemental figure S2K and table S20). These data indicated that oral microbiome may be involved in the recovery of patients with COVID-19.
Gut microbiome as non-invasive diagnostic model for COVID-19
In addition to the oral microbiome, the gut microbiome is also closely related to viral diseases, such as HBV,9 HCV30 and HIV.31 Thus, we sequenced 24 CPs and 48 HCs in the discovery cohort. Faecal microbial diversity was significantly decreased in CPs versus HCs (p<0.001, figure 5A and online supplemental figure S3A,B and table S21). A Venn diagram showed that 1003 of 1704 OTUs were unique to CPs (online supplemental figure S3C). PCoA and non-metric multidimensional scaling (NMDS) revealed an evident distinction in faecal microbial communities (figure 5B and online supplemental figure S3D).
Supplemental material

Gut microbiome as non-invasive diagnostic model for COVID-19. (A) Rarefaction analysis between the number of samples and the number of OTUs. As the number of samples increased, the number of OTUs approached saturation in CPs (n=24) and HCs (n=48). Compared with the HCs, the number of OTUs in CPs was decreased. As estimated by the Shannon index, gut microbial diversity was significantly decreased in CPs compared with HCs. (B) The PCoA based on OTU distribution showed that the gut taxonomic composition was significantly different between both groups. (C) Average compositions and relative abundances of the bacterial communities in both groups at the genus level. (D) Compared with HCs, five genera were significantly enriched, while five genera were significantly reduced in CPs. (E) Heatmap for the relative abundances of differential OTUs for each sample in both groups. The POD value was significantly increased in CPs compared with HCs, achieving good diagnostic efficacy in the discovery cohort (F and G), validation cohort (H and I). Compared with HCs, the POD value was significantly increased in SPs (J), achieving an AUC value of 0.9801 (K). **P<0.01, ***p<0.001. AUC, area under the curve; CPs, confirmed patients; HCs, healthy controls; OTUs, operational taxonomy units; PCoA, principal coordinate analysis; POD, probability of disease; SPs, suspected patients. Centerline, median; box limits, upper and lower quartiles; circle or square symbol, mean; error bars, 95% CI.
The average composition and relative abundance of the faecal microbiome for both groups at the genus and phylum levels are displayed in figure 5D and online supplemental figure S3F (online supplemental table S22). Difference analyses at the phylum and genus levels are presented in online supplemental figure S3E and figure 5C (online supplemental table S23). Compared with HCs, five genera were depleted, while five genera were increased in CPs (p<0.05). The heatmap shows that 7 OTUs were enriched in CPs, while 27 OTUs were enriched in HCs (figure 5E and online supplemental table S24). We further selected the most representative genera correlated with CPs based on LEfSe analysis (online supplemental figure S3G and table S25).
To assess the diagnostic value of faecal microbial markers for COVID-19, we constructed a random forest classifier model between 48 HCs and 14 CPs based on 7 optimal marker sets (online supplemental figure S3H,I and tables S26–S28). Then, we calculated the POD index of the discovery and validation cohorts. The POD index was markedly high in CPs versus HCs (figure 5F), with an AUC of 99.74% (95% CI 99.16% to 100%, p<0.0001) (figure 5G). In the validation phase, the POD index (figure 5H) was markedly high in CPs (n=12) versus HCs (n=24), with an AUC of 99.31% (95% CI 97.66% to 100%, p<0.0001) (figure 5I). These results demonstrated the great diagnostic potential of this classifier for COVID-19.
Gut microbial alterations in different groups
Next, we collected and sequenced samples from 23 SPs and matched SPRs who were positive for IgG during recovery. The POD index (figure 5J) was significantly increased in SPs versus HCs, with an AUC of 98.01% (95% CI 95.11% to 100%, p<0.0001, figure 5K), suggesting that this classifier could also serve as an auxiliary tool for the non-invasive diagnosis of COVID-19. Moreover, serum IgG levels among 18 CPs, 23 SPs and 6 HCs were measured (figure 6A). IgG levels during recovery were significantly increased in CPs and SPs versus HCs (p<0.0001, online supplemental table S18).
Gut microbial alterations among CPs, SPs and HCs. (A) Levels of antibodies against SARS-CoV-2 in CPs (n=18), SPs (n=23) and HCs (n=6) during recovery. The positive judgement value of the kit was 10 U/mL (a value >10 U/mL was defined as positive, and a value <10 U/mL was defined as negative). The antibody levels in the figure were calculated as log2(value). (B) Rarefaction analysis between the number of samples and the number of OTUs. As the number of samples increased, the number of OTUs approached saturation in CPs (n=36), SPs (n=23) and HCs (n=72). Compared with the HCs, the number of OTUs in CPs and SPs was decreased. As estimated by the Shannon index, the faecal microbial diversity of CPs and SPs was similar but significantly decreased compared with that of the HCs. (C) The PCoA based on OTU distribution showed that the gut microbial communities in the CPs and SPs were similar but significantly different from those in the HCs. (D) Average compositions and relative abundances of the bacterial communities in the three groups at the genus level. (E) Heatmap of the relative abundances of differential OTUs for each sample in the three groups. The PCoA showed that there was no significant difference in the faecal microbiome distribution between CPs and SPs (F) or between CPRs and SPRs (G). (H) Average compositions and relative abundances of the bacterial communities in the four groups at the genus level. HCs, healthy controls; CPs, confirmed patients; SPs, suspected patients; OTUs, operational taxonomy units; PCoA, principal coordinate analysis; CPRs, confirmed patients who recovered; SPRs, suspected patients who recovered. Centerline, median; box limits or upper and lower lines, upper and lower quartiles; circle or square symbol, mean; error bars, 95% CI.
Similar gut microbiota characteristics may be derived from the same disease. Thus, we analysed faecal microbial characteristics among CPs (n=36), SPs (n=23) and HCs (n=72). Faecal microbial diversity in CPs and SPs was similar but significantly decreased versus HCs (p<0.001, figure 6B and online supplemental figure S4A and table S29). PCoA and NMDS (figure 6C and online supplemental figure S4B) showed similar faecal microbiota between CPs and SPs but differed from HCs. A Venn diagram showed that 722 of 1421 OTUs were shared between CPs and SPs (online supplemental figure S4C). The average composition of the faecal microbiome at the genus and phylum levels is displayed in Figure 6D and online supplemental figure S4D (online supplemental table S30). The heatmap (figure 6E, online supplemental table S31) showed that 18 OTUs were enriched, while 30 OTUs were depleted in CPs and SPs versus HCs. PCoA showed that there was no significant difference in faecal microbiome distribution between CPs and SPs or between CPRs and SPRs (figure 6F,G). Furthermore, at the genus level (figure 6H, online supplemental table S32), faecal microbial variation between CPs and CPRs was approximately consistent with those between SPs and SPRs. These results indicated that faecal microbial characterisation from SPs was basically consistent with that from CPs.
Supplemental material
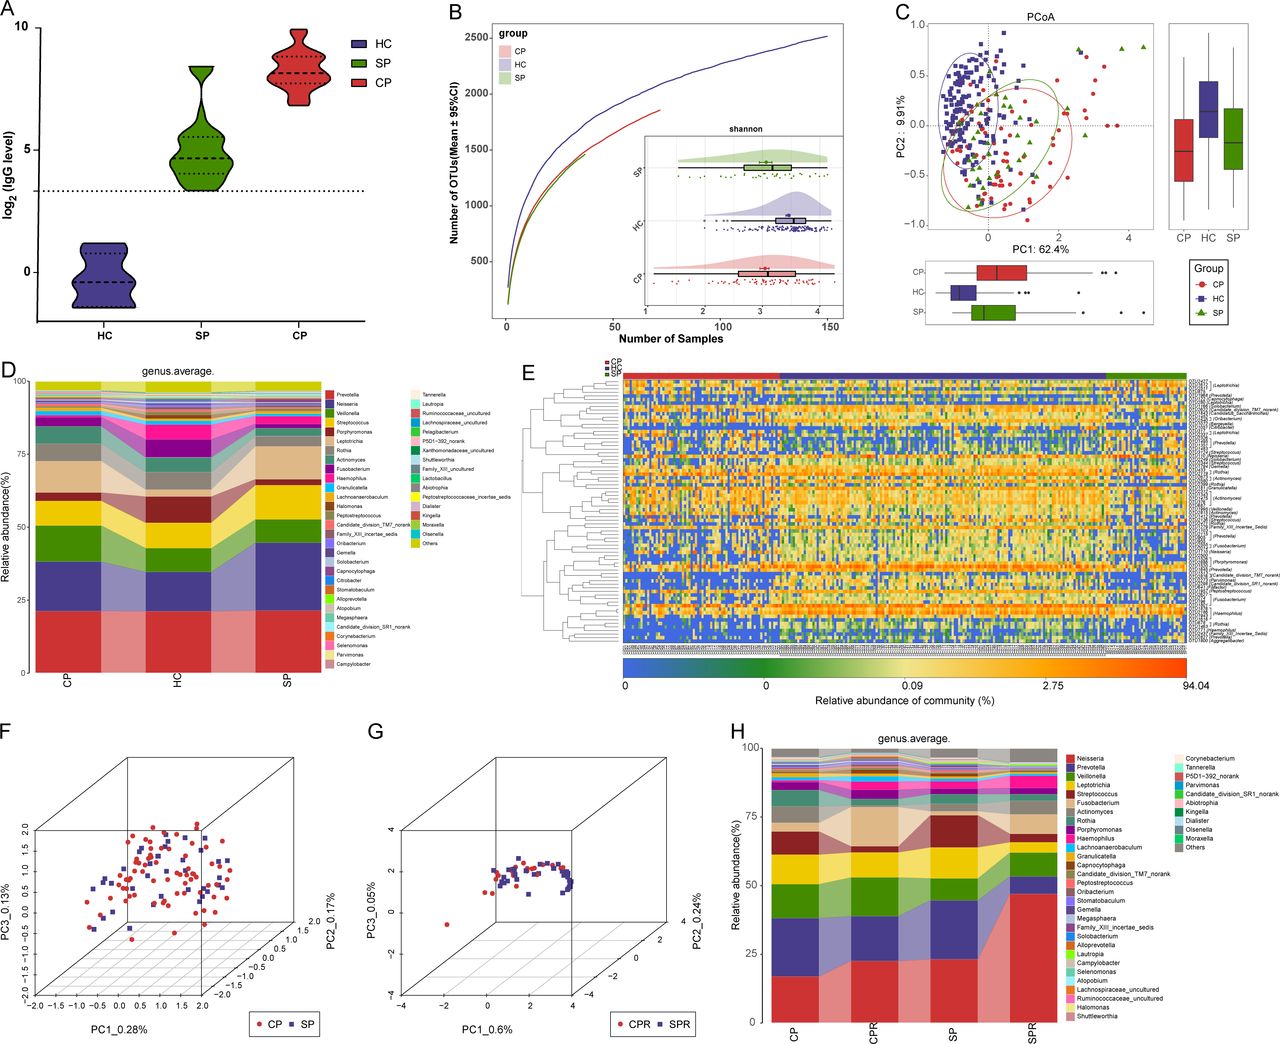
Faecal microbial diversity in CPRs (n=18) was increased versus CPs (n=36) (Shannon index, p<0.05) but significantly decreased versus HCs (n=72) (p<0.001) (figure 7A and online supplemental figure S4E and table S33). PCoA and NMDS (figure 7B and online supplemental figure S4F) showed that faecal microbial communities in CPRs were different from those in CPs and HCs. A Venn diagram showed that 769 of 816 OTUs in CPRs were shared with HCs, and 615 OTUs were shared with CPs (online supplemental figure S4G).
Gut microbial restoration along with recovery of patients with COVID-19. (A) Rarefaction analysis between the number of samples and the number of OTUs. As the number of samples increased, the number of OTUs approached saturation in CPs (n=36), CPRs (n=18) and HCs (n=72). Compared with the HCs, the number of OTUs in CPs and CPRs was decreased. As estimated by the Shannon index, faecal microbial diversity in CPRs was increased versus CPs but significantly decreased versus HCs. (B) The PCoA based on OTU distribution showed that the faecal microbial communities in the CPRs were different from those in the CPs and HCs. (C) Along with the recovery of COVID-19, the relative abundances of five genera gradually increased and were significantly different among the three groups, while the abundances of five genera gradually decreased and were significantly different among the three groups. (D) Heatmap of the relative abundances of differential OTUs for each sample in the three groups. The red box represents a gradual increase in abundance of OTUs from left to right and the green box represents a gradual decrease in abundance of OTUs from left to right. *P<0.05, **p<0.01, ***p<0.001. HCs, healthy controls; CPs, confirmed patients; OTUs, operational taxonomy units; PCoA, principal coordinate analysis; CPRs, confirmed patients who recovered. Centerline, median; box limits, upper and lower quartiles; circle or square symbol, mean; error bars, 95% CI.
The average composition and abundance of the faecal microbiome for three groups at the phylum and genus levels are displayed in online supplemental figure S4H,J (online supplemental table S34). Difference analyses at the phylum and genus levels are presented in online supplemental figure S4I and figure 7C (online supplemental table S35). Along with the recovery of COVID-19, five genera were persistently increased (p<0.05), while five genera were persistently decreased (p<0.01). Among them, Lachnospira can produce SCFAs by fermenting fibre,32 and Faecalibacterium has anti-inflammatory properties by inhibiting NF-κB and interferon-gamma and has been recognised as a potential biomarker for human health.33 Therefore, these bacteria may contribute to patient recovery by reducing inflammatory cytokine storms and promoting immune system improvement.34
The heatmap showed that the faecal microbial community in CPRs was different from that in CPs and HCs, and the abundances of discrepant OTUs in CPRs ranged between CPs and HCs (figure 7D, online supplemental table S36). We performed LEfSe analysis and selected the most representative genera among three groups on LDA (online supplemental figure S4K and table S37).
Linkages between the microbiome and lipidomics contribute to CPs recovery
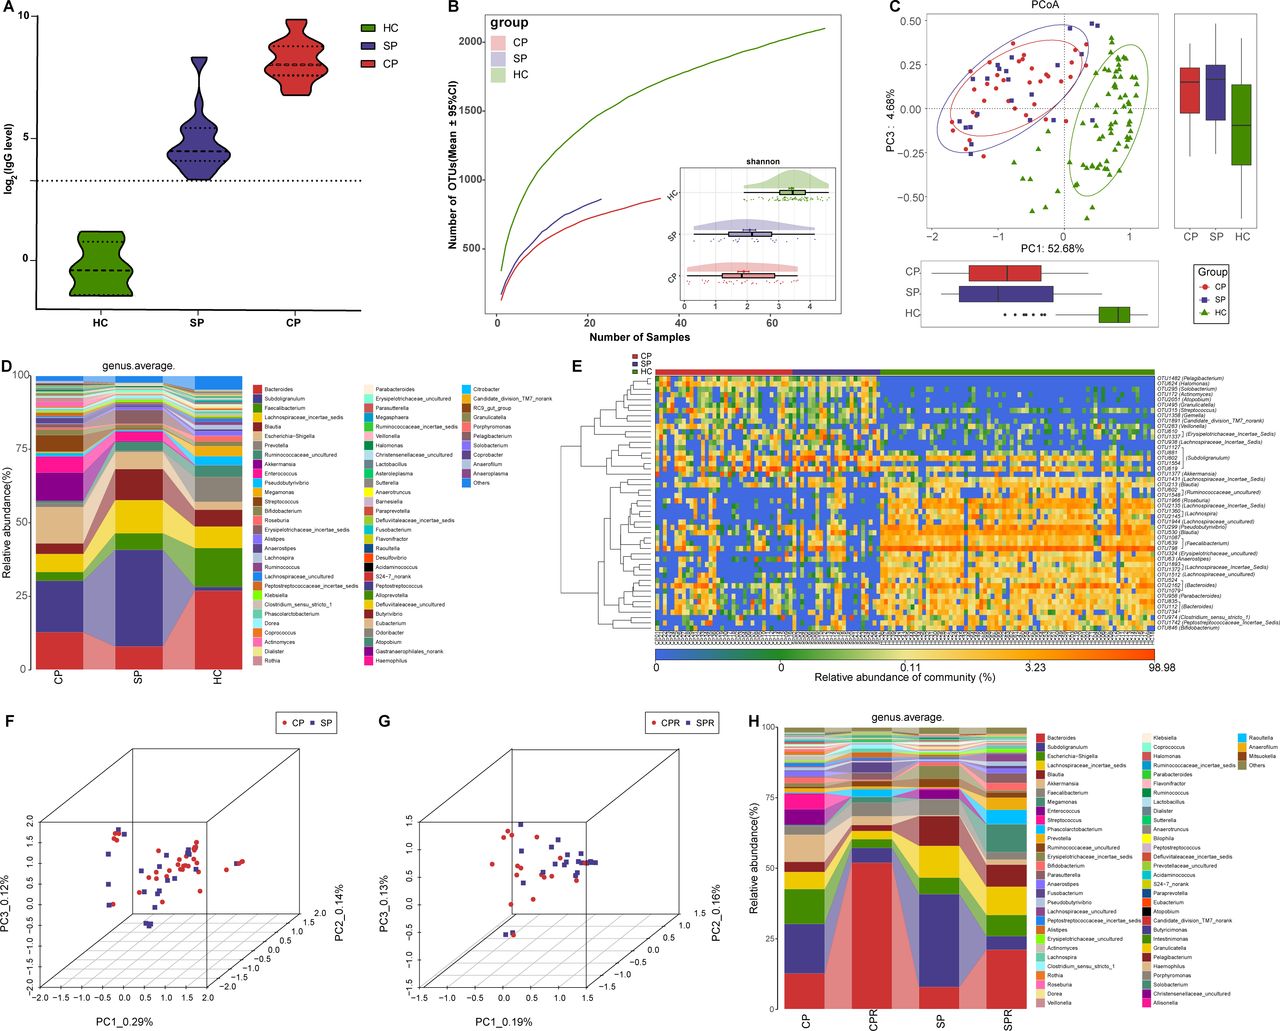
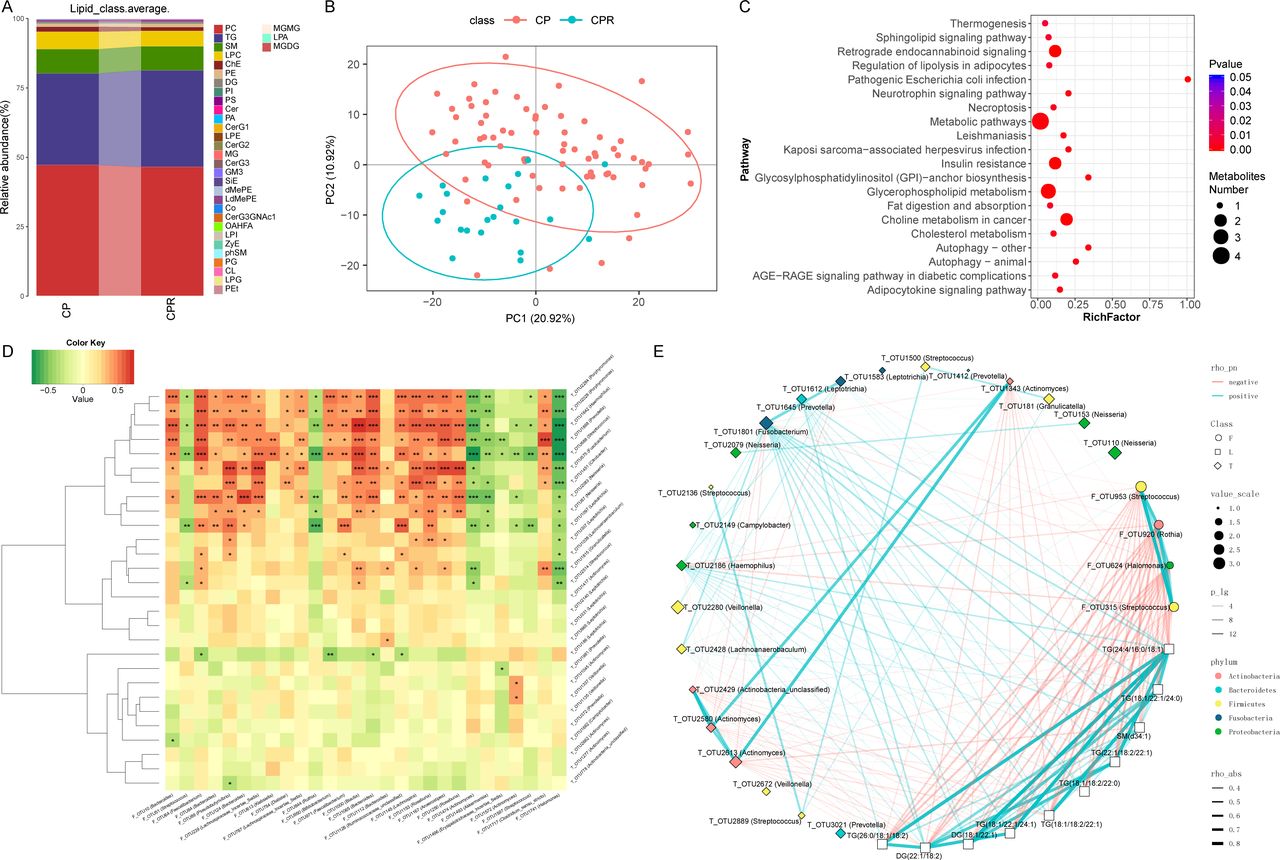
Metabolites play an important role in COVID-19 progression.17 However, lipidomics characterisation of COVID-19 and recovered patients has not been reported, nor has the role it plays in the rehabilitation process. Thus, we detected 155 samples using a UPLC-MS untargeted lipidomics approach, including samples from 73 CPs, 30 SPs, 22 CPRs and 30 SPRs. We acquired good quality data (online supplemental figure S5A–D). A total of 808 lipid molecules were identified and quantified (online supplemental table S38). At the subclass level, phosphatidylcholine (PC), triglyceride (TG) and sphingomyelin (SM) accounted for 80% on average in four groups (figure 8A, online supplemental figure S5E and table S39).
Supplemental material

Linkages between the microbiome and lipidomics contribute to CPs recovery. (A) Average compositions and relative abundance of lipids in the CPs (n=73) and CPRs (n=22) at the subclass level. (B) The PCA showed that the lipid distribution in the CPRs (n=22) was different from that in the CPs (n=73). (C) Twenty enriched pathways with the most significant differences between the CPs (n=73) and CPRs (n=22) were identified based on KEGG. The size of the points represents the metabolite number. (D) Heatmap showing the partial Spearman’s correlation coefficients among 28 distinctive oral OTUs and 28 distinctive gut OTUs between CPs (n=11) and HCs (n=18). Red colour represents positive correlations and green colour represents negative correlations. (E) The relationship among the 22 discriminative oral microbial OTUs, 4 discriminative faecal microbial OTUs and 10 discriminative lipid molecules in CPs (n=36) and CPRs (n=18). The colours of points show the different phyla of the genera. The size of the points of each genus shows the mean relative abundance. The circle points represent the faecal microbiome, square points represent the lipid molecule and diamond points represent the tongue-coating microbiome. The transparency of the lines represents the negative logarithm (base 10) of the p value of correlation (Spearman’s), red lines represent negative correlations, blue lines represent positive correlations and the width of the lines represents the size of the correlation (Spearman’s). HCs, healthy controls; CPs, confirmed patients; OTUs, operational taxonomy units; CPRs, confirmed patients who recovered.
PCA and heatmap (figure 8B and online supplemental figure S6A and table S40) showed that there was an evident difference between CPs and CPRs, where 47 lipid molecules, including SM(d40:4), SM(d38:4) and monoglyceride(33:5), were depleted, and 122 lipid molecules, including PC(36:4p), PE(16:0p/20:5) and diglyceride(20:1/18:2), were enriched in CPRs. Furthermore, 20 enriched pathways with the most significant differences between CPs and CPRs were identified (figure 8C), including thermogenesis and necroptosis. The results of SPs and SPRs are presented in online supplemental figure S5F–G and S6B.
Supplemental material
We analysed the correlations of 28 oral and 28 faecal distinctive microbial OTUs between CPs and HCs. Among them, 11 oral microbiomes such as OTU2284 (Porphyromonas), OTU1642 (Haemophilus) and OTU1868 (Prevotella) were positively correlated with HC-enriched OTU1153 (Roseburia) but negatively correlated with CP-enriched OTU1741 (Halomonas) (p<0.05) (figure 8D, online supplemental table S41).
The human microbiome participates in the occurrence and development of disease by secreting metabolites into the blood.35 36 Thus, the correlations among the oral and faecal microbiomes and lipidomics were analysed in the CPs and CPRs. Spearman’s correlation analysis showed correlations among 4 faecal microbial OTUs, 22 oral microbial OTUs and 10 lipid molecules (figure 8E). CPR-enriched TGs (26:0/18:1/18:2) were negatively correlated with 4 CP-enriched faecal OTUs, including OTU953 (Streptococcus), OTU920 (Rothia) and OTU624 (Halomonas) (p<0.05), and positively correlated with CPR-enriched oral OTU1801 (Fusobacterium) (p<0.05). Interestingly, CPR-enriched OTU1801 (Fusobacterium) was positively related to 10 CPR-enriched lipid molecules and negatively related to OTU624 (Halomonas), OTU920 (Rothia) and OTU953 (Streptococcus), which are enriched in faecal samples from CPs.
Additionally, we performed Spearman’s correlation analysis (online supplemental figure S5H) between 7 clinical indicators and 68 OTUs and found that WBCs were positively correlated with 25 OTUs, including OTU2628 (Porphyromonas) and OTU2247 (Neisseria) (p<0.05), and negatively correlated with 5 OTUs, including OTU1135 (Veillonella) and OTU186 (Leptotrichia) (p<0.05). Lymphocytes were positively correlated with 37 OTUs, including OTU1891 (Neisseria) and OTU2628 (Porphyromonas) (p<0.05), and negatively correlated with 4 OTUs, including OTU1135 (Veillonella) and OTU390 (Megasphaera) (p<0.05). Correlations between the faecal microbiome and clinical indicators are presented in online supplemental figure S5I. Altogether, these results showed that distinctive lipid molecules were closely related to oral and gut microbiome variation, and distinctive lipids and microbiomes were closely related to COVID-19 recovery.
Discussion
Our study first found compositional and functional alterations in the COVID-19-associated oral microbiome, identified specific microbial markers and constructed a diagnostic model, achieving good diagnostic efficacy in three cohorts from two different regions of China. Compelling studies have demonstrated that the oral microbiome is closely related to viral diseases and could serve as a non-invasive diagnostic tool for specific diseases or viral diseases. Zhang et al 37 presented an oral microbial diagnostic model and validated its diagnostic efficacy in rheumatoid arthritis (RA). Flemer et al 38 studied oral microbiome alterations in colorectal cancer and established a diagnostic model based on 16 oral microbial markers, achieving good diagnostic efficacy. Thus, we first proposed that oral microbial markers may be a potential non-invasive diagnostic tool for COVID-19. Meanwhile, we first proposed and successfully diagnosed SPs with IgG positivity as patients with COVID-19 by using our diagnostic model.
Each disease has its own unique oral and gut microbial alterations.24 Oral microbiota dysbiosis in RA manifests as an increase in Lactobacillus salivarius and depletion of Haemophilus spp.37 Porphyromonas, Tannerella and Fusobacterium were enriched in periodontitis.39 In our study, we found that microbial alterations in SPs with IgG positivity were consistent with CPs, which supports our idea of using a microbial model to diagnose SPs as CPs from the perspective of the microbiome. Microbial markers combined with RT-PCR may further improve detection efficacy for patients with potential COVID-19 in the population, reducing infection sources and transmission ranges.
The microbiome is closely related to disease recovery. Oral microbiome dysbiosis in RA and periodontitis were partly normalised after treatment,37 40 suggesting that the microbiome plays an important role in recovery. We first reported the characterisation of oral microbiota and lipidomics in convalescent patients with COVID-19 and found key bacteria and lipid molecules that may be involved in the development and prognosis of COVID-19. The microbiota may affect COVID-19 progression by secreting lipid molecules into the blood. The correlations between the microbiome and lipids were reported in our work. The oral and gut microbiomes were correlated with clinical indexes such as WBCs and lymphocytes, respectively. With further study of the possible mechanism of the microbiome affecting diseases, the use of microbial-assisted diagnosis, treatment and prognosis is promising for COVID-19.
Data availability statement
Data are available in a public, open access repository. The raw Illumina read data for all samples were deposited in the European Bioinformatics Institute European Nucleotide Archive database (PRJNA660302).
Ethics statements
Ethics approval
This study was approved by the Institutional Review Board from the First Affiliated Hospital of Zhengzhou University (2020-KY-055) and Guangshan County People’s Hospital (2020-001). The study was performed in accordance with the Helsinki Declaration and Rules of Good Clinical Practice. All participants signed written informed consent after the study protocol was fully explained.
Acknowledgments
The authors would like to thank all the generous volunteer subjects who enrolled in the study. The authors would like to thank all clinical doctors who participated in fighting COVID-19 from Guangshan County People’s Hospital and the First Affiliated Hospital of Zhengzhou University in China.
References
Supplementary materials
Supplementary Data
This web only file has been produced by the BMJ Publishing Group from an electronic file supplied by the author(s) and has not been edited for content.
Supplementary Data
This web only file has been produced by the BMJ Publishing Group from an electronic file supplied by the author(s) and has not been edited for content.
Footnotes
ZR, HW, GC, HL and LW contributed equally.
Correction notice This article has been corrected since it published Online First. The equal contribution statement has been updated.
Contributors ZR, LL and ZY designed the study. ZR, HL, LW, HL, XW, BR, HZ, XL, HC, CY and XC collected clinical samples. HR and JS extracted the bacterial DNA. HL and XL performed MiSeq sequencing. GC, XC, WL and ZW completed lipidomics detection and analysis. HW, GC, CL, RS, AL, CY and QK analysed the data. HW, ZR and BL wrote the manuscript. All authors reviewed and approved the manuscript.
Funding This study was sponsored by grants from the National S&T Major Project of China (2018ZX10301201), China Postdoctoral Science Foundation (2020T130609 and 2020T130109ZX), National Key Research and Development Program of China (2018YFC2000500), National Natural Science Foundation of China (U2004121, 82070643 and U1904164), Henan Province Science and Technology Project (202102310055), the COVID-19 Prevention and Control Program of International Peace Maternity and Child Health Hospital, School of Medicine, Shanghai Jiao Tong University (2020-COVID-19-01) and the opening foundation of the State Key Laboratory for Diagnosis and Treatment of Infectious Diseases and Collaborative Innovation Center for Diagnosis and Treatment of Infectious Diseases, the First Affiliated Hospital, College of Medicine, Zhejiang University (SKLID2019KF03).
Competing interests None declared.
Provenance and peer review Not commissioned; externally peer reviewed.
Supplemental material This content has been supplied by the author(s). It has not been vetted by BMJ Publishing Group Limited (BMJ) and may not have been peer-reviewed. Any opinions or recommendations discussed are solely those of the author(s) and are not endorsed by BMJ. BMJ disclaims all liability and responsibility arising from any reliance placed on the content. Where the content includes any translated material, BMJ does not warrant the accuracy and reliability of the translations (including but not limited to local regulations, clinical guidelines, terminology, drug names and drug dosages), and is not responsible for any error and/or omissions arising from translation and adaptation or otherwise.