Article Text

Abstract
Background There is indirect evidence that T cell responses can control the metastatic spread of colorectal cancer (CRC). However, an enrichment of CD4+Foxp3+ regulatory T cells (Tregs) has also been documented.
Objective To evaluate whether CRC promotes Treg activity and how this influences anti-tumour immune responses and disease progression.
Methods A longitudinal study of Treg activity on a cohort of patients was performed before and after tumour resection. Specific CD4+ T cell responses were also measured to the tumour associated antigens carcinoembryonic antigen (CEA) and 5T4.
Results Tregs from 62 preoperative CRC patients expressed a highly significant increase in levels of Foxp3 compared to healthy age-matched controls (p=0.007), which returned to normal after surgery (p=0.0075). CD4+ T cell responses to one or both of the tumour associated antigens, CEA and 5T4, were observed in approximately two-thirds of patients and one third of these responses were suppressed by Tregs. Strikingly, in all patients with tumour recurrence at 12 months, significant preoperative suppression was observed of tumour-specific (p=0.003) but not control CD4+ T cell responses.
Conclusion These findings demonstrate that the presence of CRC drives the activity of Tregs and accompanying suppression of CD4+ T cell responses to tumour-associated antigens. Suppression is associated with recurrence of tumour at 12 months, implying that Tregs contribute to disease progression. These findings offer a rationale for the manipulation of Tregs for therapeutic intervention.
- Regulatory T cells
- colorectal cancer
- imaging
- T lymphocytes
- colorectal cancer
- colorectal diseases
- histopathology
- cancer immunobiology
- hepatitis
- immunoregulation
- hepatitis C
- α β T cells
- hepatitis B
This is an open-access article distributed under the terms of the Creative Commons Attribution Non-commercial License, which permits use, distribution, and reproduction in any medium, provided the original work is properly cited, the use is non commercial and is otherwise in compliance with the license. See: http://creativecommons.org/licenses/by-nc/2.0/ and http://creativecommons.org/licenses/by-nc/2.0/legalcode.
Statistics from Altmetric.com
- Regulatory T cells
- colorectal cancer
- imaging
- T lymphocytes
- colorectal cancer
- colorectal diseases
- histopathology
- cancer immunobiology
- hepatitis
- immunoregulation
- hepatitis C
- α β T cells
- hepatitis B
Significance of this study
What is already known on this subject?
Infiltration of colorectal cancer (CRC) with certain lymphocytes correlates with prognosis.
Increased peripheral blood Foxp3+ regulatory T cell (Treg) frequencies are associated with several carcinomas.
An increase in the ratio of CD3+ T cells:Tregs within CRC has been associated with increased disease free survival.
What are the new findings?
The presence of CRC is associated with higher expression levels of Foxp3 in Tregs. These Tregs inhibit anti-tumour immune responses.
Inhibition of anti-tumour immune responses prior to resection is associated with tumour recurrence at 12 months. Excision of the primary CRC leads to a normalisation of the Treg population.
How might it impact on clinical practice in the foreseeable future?
Targeting Tregs may offer an important therapeutic strategy as an adjunct to treatment of patients.
Introduction
Colorectal cancer (CRC) is the fourth most commonly diagnosed cancer, with an estimated 500 000 deaths per annum. Treatment involves surgical excision of malignant bowel and local lymph nodes. Histopathological staging of CRC correlates with prognosis and determines whether the patient receives postoperative chemotherapy. Despite advances in preoperative imaging, surgical technique and neoadjuvant chemotherapy, approximately 40–50% of patients have disease recurrence following potentially curative surgery, highlighting the demand for better treatment.
One possibility is to utilise the host's immune system to target residual tumour after surgery. Immunohistological staining has shown that a high infiltration of T cells into colorectal tumours correlates with an improved 5-year survival and serves as a better predictor of prognosis than conventional histopathological staging. These data support the premise that cellular immunity can eliminate residual malignant cells following surgery.1
In the case of tumours amenable to surgery, strategies to enhance anti-tumour immunity may complement surgical excision. The antigens 5T4 and carcinoembryonic antigen (CEA) are expressed highly in CRCs, with low expression in normal tissue, and hence represent excellent candidate antigens for immunotherapy.2–4 Naturally occurring CD8+ and to a lesser extent CD4+ T cell responses to these antigens have been observed in both CRC patients and healthy controls.5–8
Attempts to boost anti-tumour immunity have been disappointing, with a low rate of objective responses to immunotherapy measured in clinical trials.9 Research focused on understanding why immunotherapeutic strategies fail indicates that while T cell responses can be effective at destroying tumour cells, their efficacy is limited by immunosuppressive influences. A prominent candidate is a population of naturally occurring regulatory T cells characterised by the surface expression of CD4+ and nuclear expression of the transcription factor Foxp3 (Tregs). Tregs play a key role in suppressing autoimmunity and mutation of Foxp3 induces lethal immunopathology in humans10 and mice.11 Many laboratories have shown that a partial and transient depletion of Tregs is sufficient to reject transplanted tumour cell lines,12 ,13 and reduce de novo tumour development.14 ,15 In humans, Tregs are often elevated in patients with malignancies,16 including CRC.17 A recent report suggests that the ratio of tumour intraepithelial effector CD3+ T cells to Foxp3+ T cells influences CRC patient prognosis.18 Furthermore, it has been reported that Tregs from peripheral blood of CRC patients can be stimulated with long synthetic peptides derived from certain tumour antigens.19
Investigations of the relationship between Tregs and cancer have been largely observational and cross sectional in nature. While useful, these studies omit potentially significant information relating to fluctuations in Treg activity due to tumour progression or treatment. To address this we examined anti-tumour immune responses in CRC patients before and at multiple time-points post-surgery, enabling us to specifically address whether Tregs are influenced by the presence of tumour. We also addressed whether the presence of tumour is associated with suppression of tumour-specific immune responses. For this purpose, CD4+ T cell responses specific for the tumour-associated antigens, CEA and 5T4, and control unrelated antigens were analysed pre- and postoperatively in the same group of patients, and the impact of Tregs on these responses was analysed.
Materials and methods
Sample groups
Sixty-two CRC patients identified with the first presentation of an adenocarcinoma (TNM stage II–III; Duke's stage A–C) and no reported distant metastases were recruited to the study, approved by the local research ethics committee. A breakdown of the pre- and postoperative samples collected from these patients and laboratory analysis of samples is indicated in individual figures. Samples were collected from age-matched controls and patients (age range 29–95) prior to surgery and then during follow-up at 12 weeks, 6 months and 12 months. Clinical details of patients who had surgery are provided in supplementary table 1.
Antigens
Purified protein derivative (PPD) (Statens Serum Institute, Denmark), influenza haemagglutinin (HA; Dr John Skehel, NIMR, UK), 5T420 (Oxford Biomedica, Oxford, UK) and carcinoembryonic antigen (CEA; Calbiochem, Darmstadt, Germany), were used at a final concentration of 1 μg/ml.
Purification of lymphocytes
Usually 30–50 ml of blood was drawn from patients or controls and heparinised (10 U/ml). Peripheral blood mononuclear cells (PBMCs) were extracted by centrifugation over Lymphoprep (Axis-Shield, Oslo, Norway) and washed before further use.
Flow cytometric analysis of lymphocytes from blood
Frozen lymphocytes, taken at different time-points from patients and controls, were thawed on the same day for phenotypic analysis. Antibodies were as follows: CD4 APC (clone M-T466), CD25 PE (clone 4E3) and CD3 APC (clone BW264/56; Miltenyi Biotech, Auburn, California, USA); integrin β7 PE (clone FIB504, BD PharMingen, San Diego, California, USA), CD49d PE (clone 9F10) and Foxp3 FITC (clone PCH101; eBioscience, San Diego, California, USA). Surface staining was performed in phosphate buffered saline (PBS), 2.5% foetal calf serum (FCS) and 5 mM EDTA. Flow cytometry was performed on a BD FacsCalibur and analysed using FlowJo V.7.2.2.
Cognate CD4+ T cell responses measured by ex-vivo interferon-γ ELISpot assay
Assays were performed as described previously.17 Briefly, MAHA-S-4510 ELISpot Plates (Millipore, Moslheim, France) were coated with an anti-interferon (IFN)-γ antibody (Mabtech, Nakta, Sweden) and washed in PBS. CD25hi cells were depleted from PBMC using magnetic separation with MACS CD25 microbeads (Miltenyi Biotec, Bergisch Gladbach, Germany). PBMC (1.5×10⁷) were incubated with 15 μl of anti-CD25 coated beads in total reaction volume of 150 μl of buffer (1×PBS, 0.5% bovine serum albumin (BSA), 5 mM EDTA) at 4°C for 15 min. An MS column was subsequently used and the efficacy of depletion confirmed by flow cytometry (supplementary figure 1). Assays were set up using either 3.5×10⁵ undepleted or CD25hi-depleted cells in RPMI 1640 supplemented with 5% heat-treated FCS, 100 U/ml penicillin, 100 μg/ml streptomycin, 2 mM L-glutamine and 1 mM sodium pyruvate per well in a total reaction volume of 100 μl/well. Cells were subsequently incubated in duplicate in 5% FCS with 1 μg/ml CEA, 5T4, PPD and HA antigens or media alone. Following an 18-h incubation, ELISpot plates were developed and spots were counted with an automated plate reader. Responders were identified as having at least five spot-forming cells (sfc) per 106 PBMC, after subtraction of the background, and an increase of at least 50% above background as described before.17 ,21 A response was considered suppressed by Tregs if the number of sfc was at least 50% greater after removal of the CD25hi population.
Immunohistochemistry
Formalin-fixed, paraffin-embedded human colorectal tumours were obtained. Sections (5 μm) were cut and mounted on Superfrost Plus slides (Thermo Scientific), dewaxed in xylene and hydrated using graded alcohols to tap water. After performing antigen retrieval by microwaving in 10 mM Tris, 1 mM EDTA buffer pH 9, sections were equilibrated in PBS. Peroxidase activity was quenched with 1% hydrogen peroxide in methanol, endogenous biotin was blocked using the avidin–biotin kit (VectorLabs, Orton Southgate, Peterborough, UK) and non-specific antibody binding was blocked by incubating sections with 2.5% horse serum (VectorLabs). Samples were then triple-stained by incubating sections sequentially with antibodies against Foxp3 (clone PCH101; eBioscience), CD8 (cloneC8/144B; DAKO, Glostrup, Denmark) and CD3 (clone UCHT1; DAKO) diluted in 1% BSA/PBS. Equivalent concentrations of rabbit IgG and rat IgG2a were used as negative control antibodies. Foxp3 was detected with biotinylated-anti-rat followed by the Vectastain ABC kit (VectorLabs) and visualised with DAB. CD8 was detected with anti-mouse/rabbit Immpress (VectorLabs) and visualised using Vector VIP (VectorLabs). CD3 was detected with anti-mouse/rabbit Immpress (VectorLabs) and visualised using Vector SG (VectorLabs). Sections were dehydrated and mounted in DPEX (VWR, Lutterworth, Leicestershire, England). The number of Foxp3 and CD3+CD8− (CD4+) cells in 10 high power fields of view was counted, and the percentage CD4+ cells expressing Foxp3 calculated. Photomicrographs were taken using a NIKON microscope and digital camera.
Statistical analysis
Tests to examine differences between populations included analyses of proportions (χ2 test and Fisher exact test), the non-parametric Wilcoxon signal rank test on paired data, and the Student t test on unpaired data. Statistical analyses used SPSS V.11, Excel 2003 and GraphPad Prism V.4.
Results
Evaluating the impact of CRC on CD4+Foxp3+ T cells
The first question we sought to address was whether the presence of tumour impinges on the activity of Tregs. Thus, Tregs from the blood of controls were compared with those of CRC patients at pre- and postoperative time-points.
Analysis of FoxP3 expression in CRC patients and healthy controls
Tregs, identified as CD4+CD25hi cells, were examined by flow cytometry: CD3+ peripheral blood leucocytes (PBL) were gated and CD4+CD25hi Tregs were identified as CD3+CD4+ cells with CD25 staining intensity above that observed in CD3+CD4− cells (figure 1A) as described previously.17 ,22 CD4+Foxp3+ cells were gated (figure 1B) and the percentage of cells expressing Foxp3 in the CD4+CD25hi, CD4+CD25int and CD4+CD25− populations was examined. The vast majority of Foxp3+ cells resided in the CD3+CD4+ population (>95%). Of 35 patients studied in this way, 94% (±5.7%) of the CD4+CD25hi population expressed Foxp3 compared to 12% (±5.7%) of CD4+CD25int cells and 1.3% (±0.96%) of CD4+CD25− cells (figure 1A); these frequencies were comparable in healthy age matched controls (data not shown).

Analysis of regulatory T cells (Tregs) in colorectal cancer (CRC) patients. Peripheral blood mononuclear cells (PBMC) were stained with CD3, CD4, CD25 and Foxp3 specific abs. CD3 gated cells were examined for CD4 and CD25 expression (A) and CD4 and Foxp3 expression (B). The percentage of CD4+CD25hi, CD4+CD25int and CD4+CD25− cells of total CD4+ cells and proportion of each population expressing Foxp3 is indicated (A). The MFI of Foxp3 expression on CD4+CD25hi, CD4+CD25int and CD4+CD25− cells CD3+CD4+CD25hiFoxp3+ is shown (C).
It is clear from our own observations and those of others that Foxp3 expression levels correlate with suppressive capacity.23 With this in mind, we examined the mean fluorescent intensity (MFI) of Foxp3 in our samples (figure 1C). We found, in preoperative blood samples, that CD4+CD25hi cells expressed significantly higher levels of Foxp3 compared to the CD4+CD25int cells, and a further reduction in expression levels was identified in the small number of Foxp3+ cells in the CD4+CD25neg cell population (figure 1C). When Foxp3 expression levels were compared between CRC patients and healthy controls, the level of Foxp3 expression was markedly higher in the CRC group (figure 2A,B). This was observed when both the CD25hi population (p=0.025, figure 2A) and the total CD4+ population (p=0.007, figure 2B) were compared. In keeping with reports relating levels of Foxp3 expression to suppressor activity,24 these data imply an increase in the suppressive capacity of Tregs in CRC patients compared to age matched healthy controls.
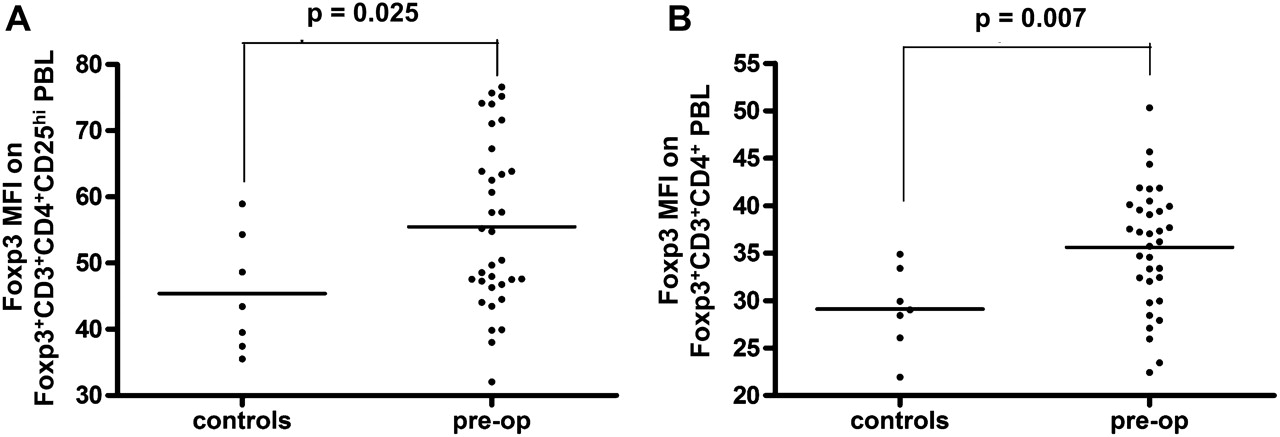
Comparison of Foxp3 expression by regulatory T cells (Tregs) in colorectal cancer (CRC) patients and healthy controls. (A) The mean fluorescent intensity (MFI) of Foxp3 staining on CD3+CD4+CD25hiFoxp3+ and (B) total CD3+CD4+ Foxp3+ PBL was analysed by flow cytometry using peripheral blood samples obtained from healthy controls and CRC patients collected preoperatively.
Tregs are enriched within colorectal tumours
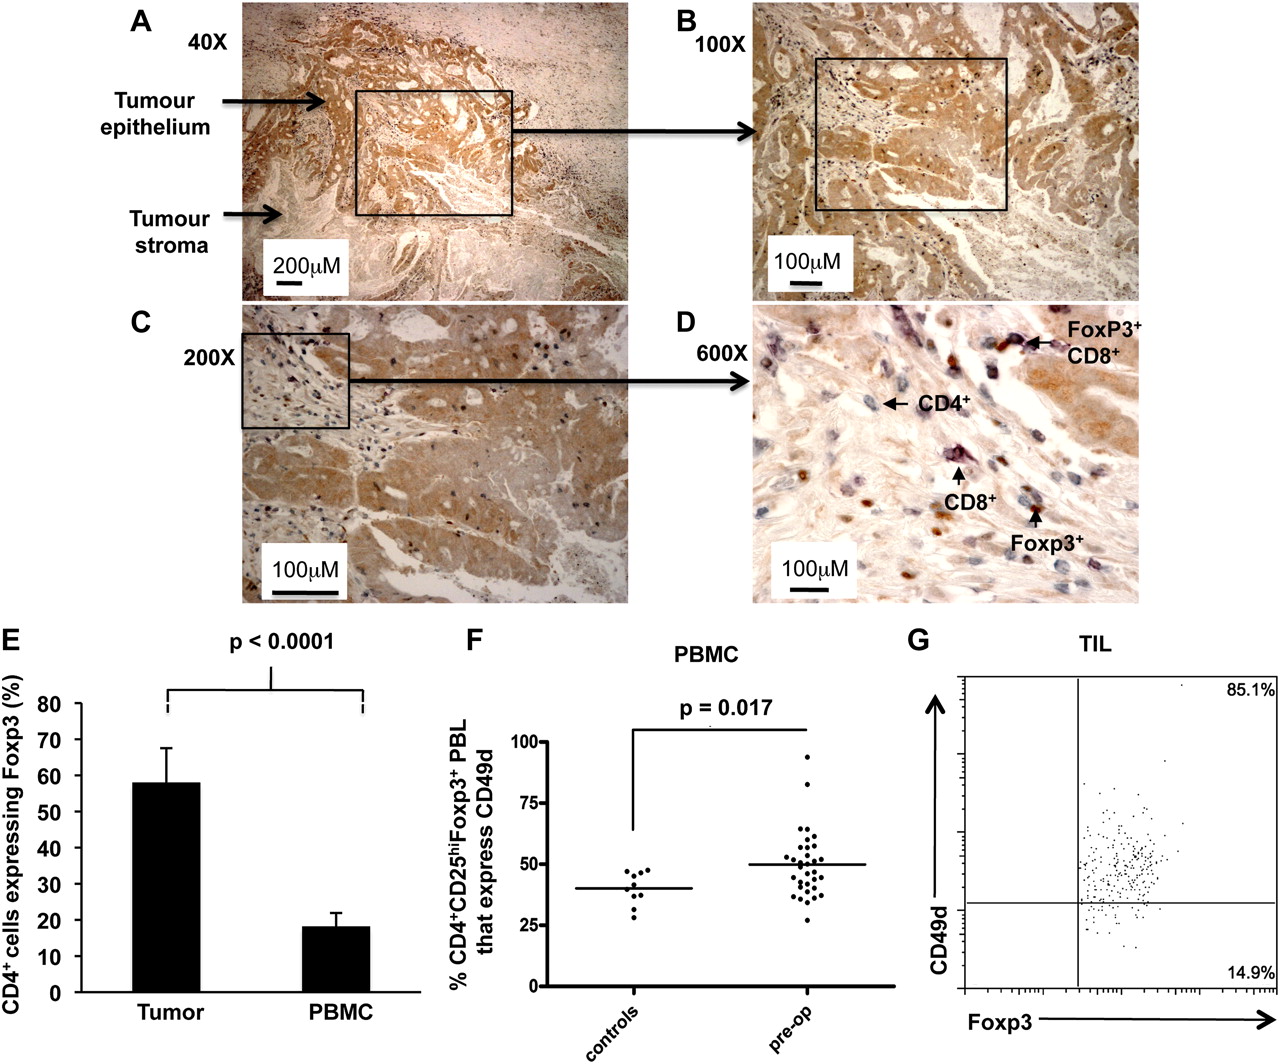
Immunohistochemistry identified striking influxes of Tregs into the tumour. Most of these were found within the tumour stroma and in association with other CD4+ and CD8+ T cells (figure 3A–D). An analysis of over 40 tumours indicated that Foxp3+ cells reach an approximately equal ratio with CD4+ T cells, demonstrating a significant enrichment of Tregs within the tumour compared to PBMCs (figure 3E). High expression of certain markers has been associated with Tregs that actively migrate to sites of inflammation. Although the role of CD49d in facilitating migration of T cells to colorectal tumours has not, to our knowledge, been elucidated, expression of this homing receptor has been linked with recruitment of Tregs to inflamed tissues and also with T cell infiltration of tumours in patients with metastatic melanoma, following administration of low-dose interleukin-12.25 ,26 We compared CD49d expression on Tregs in CRC patients with those of healthy controls (figure 3F). While we observed no overall difference in the expression level of CD49d among the two groups (data not shown), the percentage of CD4+CD25hiFoxp3+ gated Tregs that expressed CD49d was significantly higher in patients than controls (p=0.017), implying that a greater proportion of Tregs in CRC patients are able to migrate to sites of immune activity. Indeed, the majority of tumour infiltrating CD4+Foxp3+ cells expressed CD49d (figure 3G). We compared this to the expression of the integrin CD103 (αEβ7) which has also been associated with Tregs,27 however very few tumour-infiltrating Tregs expressed this marker (data not shown). Although we did not examine the functional significance of CD49d expression in our study, others have reported that CD49d+ Tregs exhibit a distinct phenotype.28 The cells, which can be enriched through isolation of MHC class II+ Tregs, are potently suppressive in vitro, and furthermore can induce secondary suppressor cells that produce the immunosuppressive cytokine, TGFβ.29 With these studies in mind, our data further support the premise that Tregs derived from CRC patients are more active than those in the control group.

Proportions of CD4 cells expressing Foxp3 in tumours and blood of colorectal cancer (CRC) patients. A representative example of a paraffin-embedded human colorectal tumour triple-stained with Foxp3 (brown), CD8 (purple) and CD3 (grey) specific antibodies. CD4+ cells are defined as those CD3 cells which do not stain for CD8 that is, they stain grey. The same area is shown at different magnifications: (A) 40×, (B) 100×, (C) 200× and (D) 600× final magnification. Arrows show areas of tumour epithelium (stained weakly brown) and tumour stroma (unstained). The majority of T cells including Foxp3+ cells are found within the tumour stroma and sometimes Foxp3+ T cells are seen in association with other T cells, as shown in (D). (E) The percentage of CD4 cells expressing Foxp3 was determined in the tumours by immunohistochemistry (n=67) and in the blood by flow cytometry (n=17). Results are expressed as mean±SD. (F) Expression of CD49d on CD4+CD25hiFoxp3+ cells from peripheral blood leucocytes of CRC patients and healthy controls was analysed by flow cytometry. (G) Representative example of CD49d expression on CD4+Foxp3+ tumour-infiltrating T cells. PBMC, peripheral blood mononuclear cells; TIL, tumour-infiltrating lymphocyte.
Comparison of CD4+Foxp3+ T cells in patients following surgery
Foxp3 expression levels were compared in CRC patients preoperatively and at different time-points following surgical excision of the tumour. This analysis revealed a significant decline in levels of Foxp3 expression by 12 weeks post-surgery (figure 4A, p=0.037; figure 4B, p=0.0075) which was sustained over a 12-month follow-up period and similar to Foxp3 expression in controls. This pattern persisted when patients who received postoperative chemotherapy were excluded from the analysis (p<0.05). PBMCs from three healthy controls were examined weekly for 12 weeks and Foxp3 expression levels compared at a single time-point. No significant fluctuation was observed in either individual over the entire period (Foxp3 MFI in three individuals over nine separate time-points was 30.64±2.3, 30.84±1.8 and 30.65±2). Since Foxp3 levels correlate with suppressive capacity, the conclusion from these data is that the tumour is influencing Treg activity.

Longitudinal analysis of Foxp3 expression by regulatory T cells (Tregs) in colorectal cancer (CRC) patients. (A) The mean fluorescent intensity (MFI) of Foxp3 expressed on CD3+CD4+CD25hiFoxp3+ and (B) total CD3+CD4+Foxp3+ peripheral blood leucocytes (PBL) was analysed by flow cytometry on peripheral blood samples obtained from healthy controls and CRC patients collected preoperatively and at 12 weeks and 6 and 12 months following surgery. Foxp3 expression of cells in each CRC patient sample was standardised to the mean Foxp3 expression observed in the control group. Error bars represent SE of the mean.
CEA- and 5T4-specific CD4+ T cell responses in CRC patients pre- and post-surgery
Tumours utilise a variety of immunosuppressive strategies to dampen effective anti-tumour immune responses.30 To investigate the impact of CRC on the immune system, we asked whether removal of malignant bowel altered immune responses to tumour antigens (CEA and 5T4) or control antigens (HA and PPD). IFN-γ-producing CD4+ T cells from PBMC were measured ex-vivo by ELISpot in 58 patients preoperatively and in a follow-up group at 3 months, 6 months and 12 months postoperatively. We postulated that responses to the tumour-specific antigens, measured postoperatively would be less subject to suppression by Tregs than those measured preoperatively. To address this, all ELISpot assays were set up at each time-point using whole PBMC and PBMC depleted of CD25hi cells. This approach enabled us to determine whether responses were altered by partial depletion of Tregs.
Use of the highly sensitive ELISpot assay enables accurate identification of low frequencies of antigen-specific CD4+ T cells ex vivo.17 ,21 This assay was used to measure responses to 5T4 and CEA antigens. A positive response was defined by at least 5 sfc per 106 PBMC, after subtraction of the background, and an increase of at least 50% above background as described previously.21 The magnitude of the tumour antigen-specific response ranged from 5 to 222 sfc/million PBMC. If the response increased by at least 50% after depletion of Tregs (CD25hi cells), this was considered a positive effect of depletion. Examples of 5T4- and CEA-specific responses in individual patients are shown in figures 5A and 6A. The overall patterns of responses to these tumour antigens, pre- and post-surgery are shown in figures 5 and 6. There was a trend for an increase in the percentage of patients responding postoperatively at 6 and 12 months to both tumour antigens (figures 5B and 6B). When we compared only paired patient data at the preoperative and the 6 month postoperative time-points, we found that neither the magnitude of the CEA-specific responses (figure 5C) nor the overall proportion of CEA responders (figure 5D) was significantly altered by surgery. In the case of CEA, around 50% of responses were observed only after partial Treg depletion; this proportion did not change significantly after surgery (figure 5E). This contrasts to the pattern of anti-tumour responses measured using the tumour-specific antigen 5T4. The overall number of responders increased after surgery (figure 6B) and again when looking at paired data on subjects (figure 6D); the magnitude of the responses increased along with the number of responders (figure 6C). Interestingly, of the seven patients who responded to 5T4 preoperatively, 5/7 (71%) of these responses were observed only after partial depletion of Tregs. In contrast, of the 14 patients who responded to 5T4 6 months after surgery, suppression by Tregs was only observed in 7/14 (50%) individuals (figure 6E), a pattern that showed no correlation with chemotherapy. This observation implies that the ‘unmasking’ of responses to 5T4 observed after tumour resection can be attributed, at least in part, to a reduction in the suppressive influence of Tregs. Overall, these data strongly support the premise that the tumour is an inhibitory influence on 5T4-specific responses.
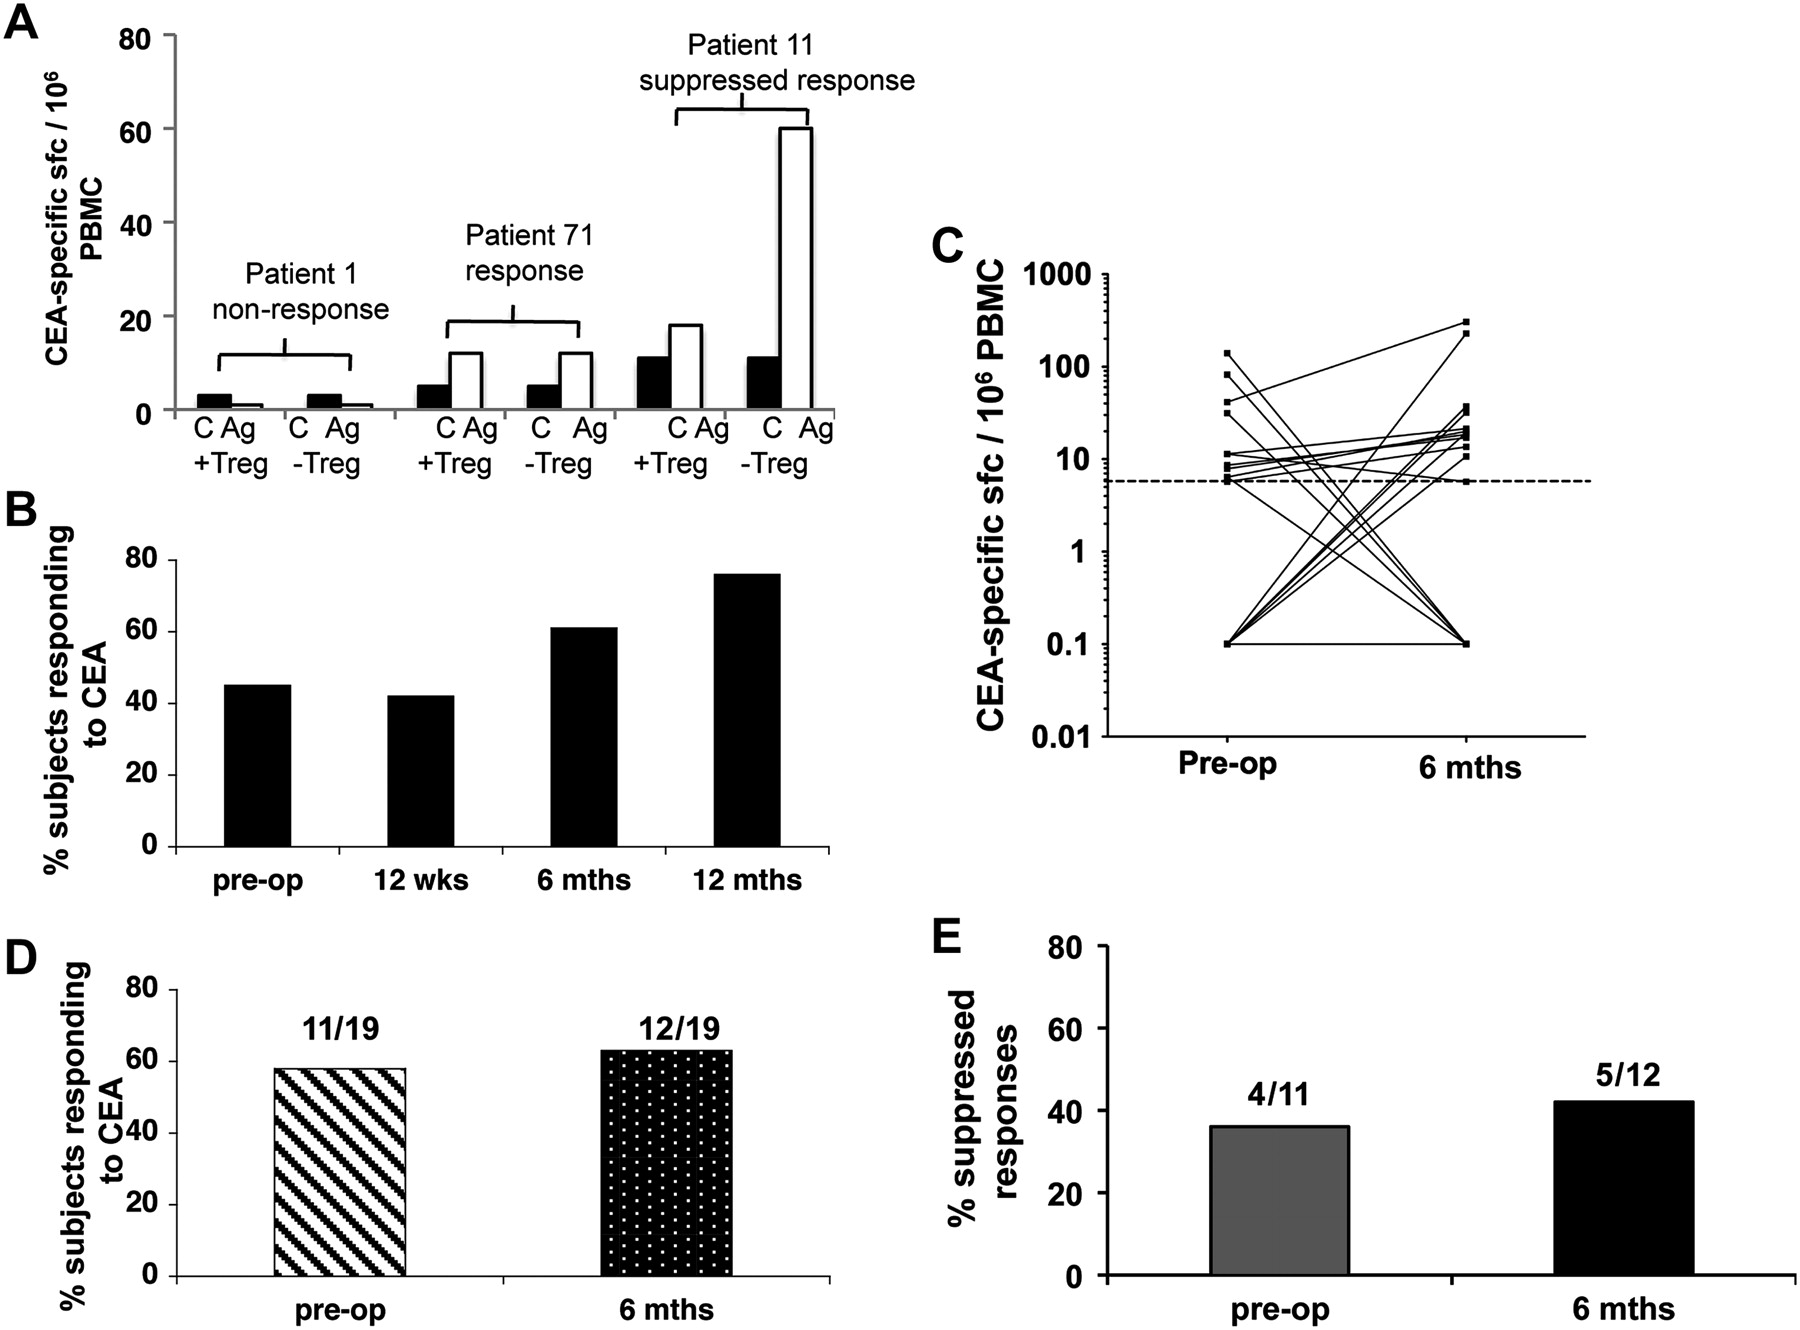
Analysis of longitudinal ex-vivo carcinoembryonic antigen (CEA) specific ELISpot responses by colorectal cancer (CRC) patients. Peripheral blood mononuclear cells (PBMC) were purified from CRC patients pre- and postoperatively. Whole PBMC and regulatory T cell (Treg) depleted PBMC were stimulated with CEA and ex-vivo interferon-γ release was measured in an ELISpot assay. (A) Examples of a non-responder (patient 1), a responder (patient 71) and a response that could only be detected after depletion of CD4+CD25hi cells (patient 11). C, control wells; Ag, CEA containing wells; +Treg, undepleted cultures; –Treg, cultures depleted of CD4+CD25hi cells. (B) The total percentage of patients that responded to the antigen, including responses that were either partially or completely suppressed by Treg is displayed for each time point. (C) The number of CEA-specific sfc/106 PBMC observed both preoperatively and 6 months after surgery is shown as well as (D) the percentage, and number, of patients, measured both pre- and 6-months postoperatively, responding to CEA. (E) Whole PBMC and Treg depleted PBMC were stimulated with CEA and ex-vivo interferon-γ release measured in ELISpot assays. The percentage of responses suppressed by Tregs is shown for patients whose responses were measured both preoperatively and 6 months postoperatively.
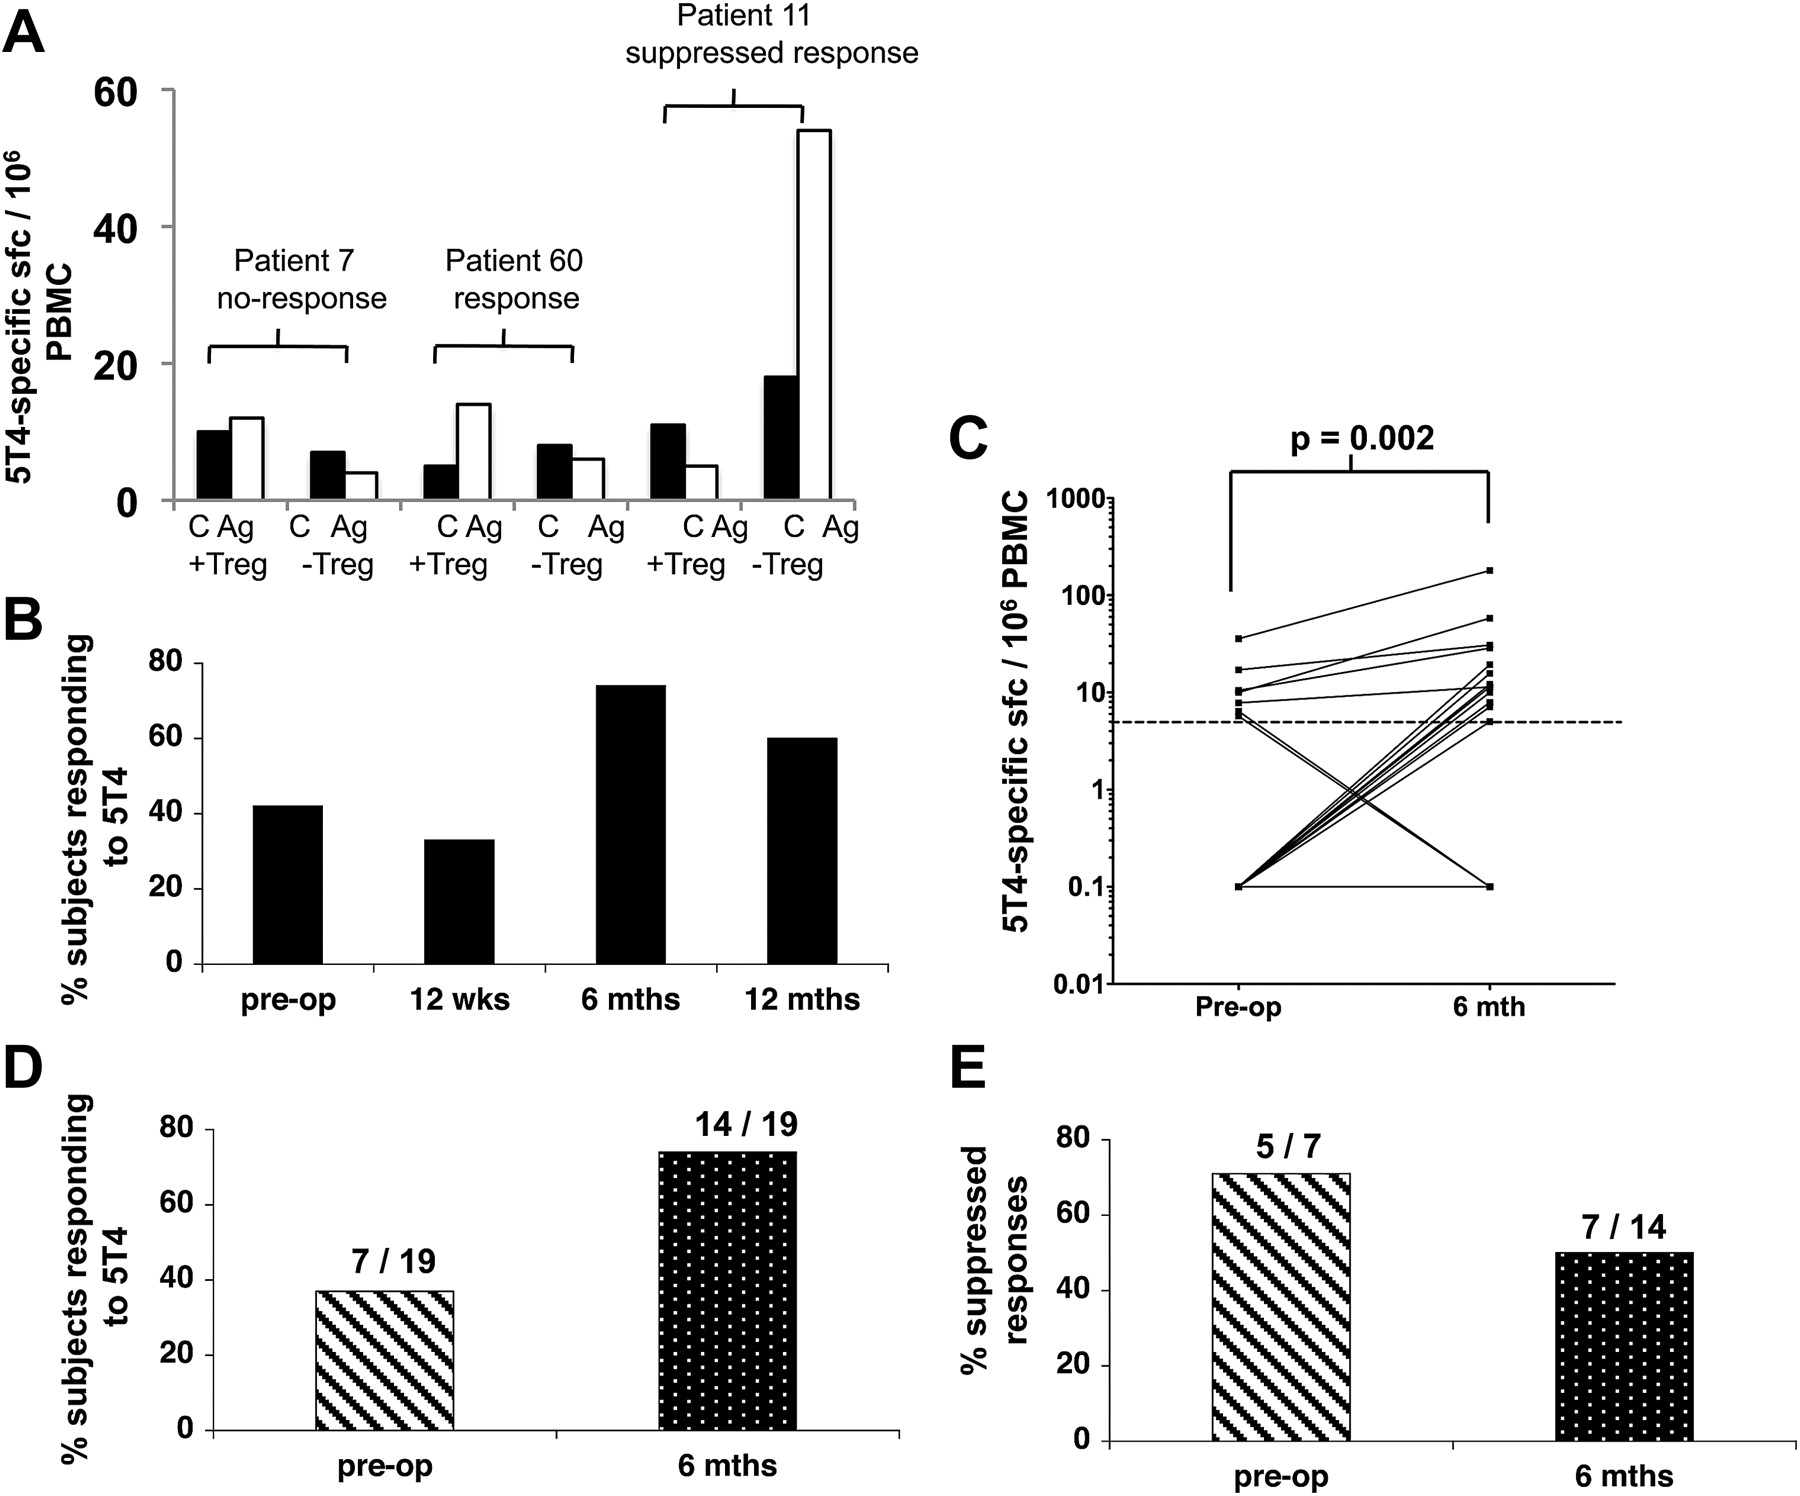
Analysis of longitudinal ex-vivo 5T4-specific ELISpot responses by colorectal cancer (CRC) patients. Peripheral blood mononuclear cells (PBMC) were purified from CRC patients pre- and postoperatively. Whole PBMC and regulatory T cell (Treg) depleted PBMC were stimulated with 5T4 and ex-vivo interferon-γ release was measured in an ELISpot assay. (A) Examples of a non-responder, (patient 7), a responder (patient 60) and a response that could only be detected after depletion of CD4+CD25hi cells (patient 11). C, control wells; Ag, 5T4 containing wells; +Treg, undepleted cultures; −Treg, cultures depleted of CD4+CD25hi cells. (B) The total percentage of patients that responded to 5T4, including responses that were either partially or completely suppressed by Treg is displayed for each time point. (C) The number of 5T4-specific sfc/106 PBMC observed both preoperatively and 6 months postoperatively is shown as well as (D) the percentage and number of patients, measured both pre- and 6-month postoperatively, responding to 5T4. (E) The percentage of responses suppressed by Tregs is shown for patients whose responses were measured both preoperatively and 6 months postoperatively.
There was no evidence of generalised non-specific immunosuppression before surgery as 96% of the patients demonstrated strong responses to one or both control antigens HA and PPD preoperatively. In 19 patients with paired pre- and postoperative data, there was a slight increase in responses to control antigens in three of them (figure 7A,C). However, comparatively few responses were actually unmasked after Treg depletion at any of the time-points tested (figure 7B,D).

Analysis of longitudinal ex-vivo haemagglutinin (HA) and purified protein derivative (PPD) specific ELISpot responses by colorectal cancer (CRC) patients. Peripheral blood mononuclear cells (PBMC) were purified from CRC patients pre- and postoperatively. Whole PBMC and regulatory T cell (Treg) depleted PBMC were stimulated with HA or PPD and ex-vivo interferon-γ release was measured in an ELISpot assay. The total percentage of patients that responded to HA (A) or PPD (C) pre- and 6-months postoperatively are shown. The percentage of HA (B) and PPD specific (D) responses completely unmasked by Tregs is shown for patients whose responses were measured both preoperatively and 6 months postoperatively.
Comparison of 12-month tumour free survival with anti-tumour immune responses
We addressed whether preoperative suppression of tumour specific immune responses by Tregs was more likely to be associated with tumour recurrence. Follow-up data were available on 44 patients who had reached the 12-month postoperative time-point. Of these, 34 patients remained tumour free (group A) while tumour recurrence was observed in 10 individuals (group B). As expected, recurrent disease did correlate with the stage of disease at operation as all those with recurrent disease at 12 months were diagnosed with Duke's C or B tumours. Anti-tumour CD4+ T cell responses (5T4 and CEA) were compared to control antigen CD4+ T cell responses (PPD and HA) preoperatively, and in particular whether these responses were subject to suppression by Tregs (table 1).
Regulatory T cell (Treg) suppression of ex-vivo interferon (IFN)-γ responses to tumour antigens and 12-month tumour status
In both groups A and B there was no difference in responses to control antigens or in the effects of suppression on these responses. However, when the anti-tumour responses were compared there is a clear difference between groups A and B. In group A, which remained tumour-free at 12 months, 73% of 5T4- and 50% of CEA-specific responses were suppressed. In contrast, in group B, 100% of responses that were measured to either antigen were suppressed preoperatively (p=0.003). Thus, while suppression of anti-tumour responses was observed in both groups with no obvious correlation between tumour suppression and tumour stage, the data nevertheless suggest a close relationship between the presence of anti-tumour specific Tregs and the recurrence of tumour at this time-point.
Discussion
There is a need to improve treatment of CRC patients to reduce the high rate of disease recurrence following potentially curative surgery. In many cases malignant cells may seed other organs and expand following surgery to cause patient death. Removing these relatively small numbers of cells that remain after surgery is difficult and is currently only partially aided by postoperative chemotherapy when indicated by histological staging of resected malignant bowel. There is strong indirect evidence that T cells can be effective at controlling CRC metastases.1 How the activity of these cells can be harnessed for the purpose of immunotherapy is not yet understood. Indeed, several early phase trials of vaccination in CRC have been disappointing,31 possibly reflecting the persistence of regulatory mechanisms which serve to down-modulate otherwise effective anti-tumour immune responses.
The current study was undertaken to gain insight into the impact of tumours on the immune response and in particular, on Tregs. For this purpose we compared anti-tumour immune responses and Tregs in patients pre- and postoperatively. This longitudinal analysis revealed that Foxp3 expression levels are higher in CRC patients compared to healthy controls and strikingly, that in most subjects expression levels realign with those observed in healthy controls, following tumour excision. This finding may point to an effect of tumours in driving the suppressive capacity of Tregs. In support of this premise, detailed functional characterisation of Treg subsets and our own findings (data not shown) indicate that Tregs expressing high levels of Foxp3 have higher suppressive capacity than those expressing lower levels.23 Tumour recurrence was however observed in some of the patients studied despite a decrease in Foxp3 expression levels. Prior to surgery, the tumour represents a large bulk of tissue that may have developed over several years, leading to an increase in Tregs. On the other hand, relatively small deposits of metastatic tissue may not lead to detectable differences in Treg phenotype when assessed in whole PBMC. Thus, in the case of disease recurrence, it may not be possible to measure alterations in Tregs, particularly when detected at an early stage such as 12 months postoperatively.
Our study also demonstrated that Treg proportions within the CD4+ T cell population differ markedly in PBMCs compared to tumour stroma. Data indicating that a significantly higher proportion of Foxp3+ cells express CD49d in cancer patients compared to healthy controls support this finding as CD49d expression implies that the cells are actively migrating to a site of immune activity. Deng et al, demonstrating a similar highly significant increase of Foxp3+ cells in the tumour draining lymph nodes and particularly the tumours of CRC patients compared to PBMCs, corroborate these findings.32 Overall, the enrichment of Tregs within tumour-infiltrating leucocytes strongly implies that this is an important site of tumour immunosuppression.
Previous studies have documented 5T4- and CEA-specific responses in CRC patients.17 ,33 ,34 However, these studies did not take the effect of surgery into account. Thus, the second part of this study examined longitudinal effector T cell responses to CEA and 5T4 pre- and postoperatively and measured the impact of Tregs on these responses at the same time-points. The data demonstrate that at least two thirds of patients studied responded to one or both of the antigens under study but that Tregs suppressed these responses in the majority of cases. When the preoperative 5T4-specific responses of individual patients were compared to responses 6 months after surgery, a significant elevation of 5T4 responses was observed at the latter time-point, suggesting that removal of the tumour burden facilitates the unmasking of a previously suppressed CD4+ T cell response. Our data imply that Tregs are at least partly responsible for this suppression as a lower proportion of 5T4-specific responses were suppressed postoperatively. Overall these data support the earlier findings of the study, which indicate that tumours expand the Treg population, driving suppression of CD4+ T cell responses to tumour-associated antigens. Furthermore, the results offer some insight into Treg specificity. Since suppression was assessed in assays using 5T4 (and CEA) pulsed PBMCs as stimulators, it suggests that both the effector cells and the Tregs recognise the same protein antigen. The pattern of responses to CEA was similar to 5T4. However, the extent to which Tregs suppressed CEA responses did not alter after surgery. It is possible that CEA-specific Tregs are maintained by influences other than the tumour for the purpose of limiting self-reactivity in the healthy host, as CEA, unlike 5T4, is expressed at low levels in normal tissue. While some degree of non-specific immunosuppression was detected, overall the data indicate that the greatest extent of suppression is observed when measuring responses to tumour antigens.
An extremely important aspect of this study is the absolute concordance of tumour recurrence at a 12-month postoperative time-point and Treg-mediated suppression of CEA- and 5T4-specific responses, measured preoperatively. No such concordance was observed within the group of patients remaining tumour-free or with respect to Treg mediated suppression of responses to unrelated control antigens. Recent studies have however, reported that high numbers of intratumoural Foxp3+ T cells are associated with better survival of CRC patients.18 ,35 More than one explanation can account for these seemingly contradictory findings. The role of Tregs may depend on the type of immune response present in the tumour microenvironment. When inflammatory cells that promote tumour progression dominate the immune response, Tregs may be beneficial in suppressing this process.36 However, in the case where the immune response is dominated by T cells, Tregs may promote disease progression by suppressing their anti-tumour effects. More simplistically, Treg numbers may accumulate in parallel with the conventional T cell response, thus their presence could just reflect robust anti-tumour T cell activity known to correlate with an improved prognosis.1 The data presented here underpin the importance of conducting further studies of CRC patients to include more antigens and larger patient groups in order to identify T cell specificities involved in controlling tumour growth and those that might be involved in promoting tumour growth. A better understanding of the relationship between tumours and Tregs may prove instrumental to the success of anticancer immunotherapy.
References
Supplementary materials
Supplementary Data
This web only file has been produced by the BMJ Publishing Group from an electronic file supplied by the author(s) and has not been edited for content.
Files in this Data Supplement:
- Download Supplementary Data (PDF) - Manuscript file of format pdf
Footnotes
The authors Awen Gallimore and Andrew Godkin contributed equally to this work.
Funding This work was supported by grants from the Tenovus Cancer Charity and Cancer Research Wales and an MRC grant awarded to AG (G0801190). AG is supported by a Wellcome Trust University Award (086983/Z/08/Z). This work was also supported by kind donations from Sir Stanley and Lady Shirley Thomas.
Competing interests None.
Ethics approval Ethics approval was provided by South East Wales Ethics Committee.
Provenance and peer review Not commissioned; externally peer reviewed.