Article Text

Abstract
Objective To develop gene expression profiles that characterise KRAS-, BRAF- or PIK3CA-activated- tumours, and to explore whether these profiles might be helpful in predicting the response to the epidermal growth factor receptor (EGFR) pathway inhibitors better than mutation status alone.
Design Fresh frozen tumour samples from 381 colorectal cancer (CRC) patients were collected and mutations in KRAS, BRAF and PIK3CA were assessed. Using microarray data, three individual oncogenic and a combined model were developed and validated in an independent set of 80 CRC patients, and in a dataset from metastatic CRC patients treated with cetuximab.
Results 175 tumours (45.9%) harboured oncogenic mutations in KRAS (30.2%), BRAF (11.0%) and PIK3CA (11.5%). Activating mutation signatures for KRAS (75 genes), for BRAF (58 genes,) and for PIK3CA (49 genes) were developed. The development of a combined oncogenic pathway signature-classified tumours as ‘activated oncogenic’, or as ‘wildtype-like’ with a sensitivity of 90.3% and a specificity of 61.7%. The identified signature revealed other mechanisms that can activate ERK/MAPK pathway in KRAS, BRAF and PIK3CA wildtype patients. The combined signature is associated with response to cetuximab treatment in patients with metastatic CRC (HR 2.51, p<0.0009).
Conclusion A combined oncogenic pathway signature allows the identification of patients with an active EGFR-signalling pathway that could benefit from downstream pathway inhibition.
- Colorectal cancer
- KRAS
- BRAF
- PIK3CA
- EGFR-inhibitor resistance
- cancer
- colorectal metastases
- drug resistance
- gene expression
- molecular oncology
- colorectal neoplasia
- cancer genetics
- cancer syndromes
- colorectal adenomas
- pancreatic cancer
This is an open-access article distributed under the terms of the Creative Commons Attribution Non-commercial License, which permits use, distribution, and reproduction in any medium, provided the original work is properly cited, the use is non commercial and is otherwise in compliance with the license. See: http://creativecommons.org/licenses/by-nc/3.0/ and http://creativecommons.org/licenses/by-nc/3.0/legalcode
Statistics from Altmetric.com
- Colorectal cancer
- KRAS
- BRAF
- PIK3CA
- EGFR-inhibitor resistance
- cancer
- colorectal metastases
- drug resistance
- gene expression
- molecular oncology
- colorectal neoplasia
- cancer genetics
- cancer syndromes
- colorectal adenomas
- pancreatic cancer
Significance of this study
What is already known about this subject?
-
The EGFR pathway became the focus of therapy development over the last few years, as the activated pathway drives cancer progression.
-
Anti-EGFR inhibitors, like cetuximab and panitumumab, have shown clinical benefit in metastatic colorectal cancer.
-
Activating KRAS mutations are established as negative predictor for response.
-
Activating KRAS mutations, or mutations in other key molecules (BRAF, PI3KCA), cannot fully explain the extent of non-response in the patient population and, therefore, other causes for non-response need to be identified.
What are the new findings?
-
Combined transcriptional profiling of oncogenic mutations allows the identification of patients with an active EGFR-signalling pathway that could benefit from downstream pathway inhibition.
-
Patients with a BRAF mutation display a distinct expression pattern.
-
Mechanisms other than oncogenic mutations can cause a similar activation of the pathway and result in a similar transcriptional pattern.
-
The development of activated pathway signature, as described here, allows the identification of all patients who have a similar phenotype as patients with oncogenic mutations. The signature is, therefore, more comprehensive and predictive than the mutation status alone.
Significance of this study
How might it impact on clinical practice in the foreseeable future?
-
A better understanding of the underlying mechanism of response to anti-EGFR therapies will help to further personalise medicine and increase benefit.
-
Our findings, and other published reports, demonstrate that expression signatures measuring pathway activation can identify patients who are sensitive to a pathway inhibition, and these signatures seem superior to measuring the mutation status alone. This observation should be confirmed in additional clinical studies.
-
The development and use of such signatures might be of special interest when less well-characterised pathways are targeted, and knowledge about predictive markers is limited.
Introduction
The epidermal growth factor receptor (EGFR) is a member of the ERBB family of receptors that plays a key role in cell proliferation, adhesion and migration.1–3 The EGFR downstream intracellular signal transduction pathways include components of the RAS/mitogen-activated protein kinase (MAPK), phosphatidyl inositol 3-kinase (PI3K), signal transducer and activator of transcription, protein kinase C and phospholipase D pathways.4
Antibodies aimed directly at EGFR, such as cetuximab5 and panitumumab,6 have shown clinical benefit in metastatic colorectal cancer (CRC). However, only 20%–30% of these patients respond to EGFR inhibitors. The lack of clinical response to the EGFR pathway inhibitors in many patients has been partially attributed to downstream or parallel activation of the pathway.7 Notably, KRAS and PIK3CA pathways can also be activated by other upstream receptors.
Molecular alterations that constitutively activate EGFR signal transduction have been associated with lack of response to cetuximab or panitumumab. KRAS mutations account for only 30%–40% of non-responders to EGFR targeting in colorectal cancer.8–13 Patients with activating mutations in BRAF,14 PIK3CA 15 ,16 and NRAS 17 might also not respond to these antibodies. Finally, loss of PTEN protein expression, a phosphatase that inactivates the PI3KCA downstream signalling, may associate with the lack of response to cetuximab.18
DNA microarray-based gene expression signatures can define cancer subtypes, recurrence of disease and response to specific therapies using.19 ,20 Also, they have proved useful for the analysis of the activation of oncogenic pathways in cancer samples.21 ,22 It has recently been demonstrated that an RAS pathway signature is superior to KRAS mutation status for the prediction of dependence on RAS signaling, and can predict response to PI3KCA and RAS pathway inhibitors.23
We hypothesised that analysing independent gene expression profiles of diverse oncogenic mutations in BRAF, KRAS or PIK3CA may uncover signatures of activated EGFR pathway signalling. In this study, we analysed the gene expression pattern of a large number of patients, and built a model for identifying patients with activated EGFR-signalling pathways. Since detection of signalling deregulation can be linked to sensitivity to targeted therapies,21 we posit that such profiles may be helpful in predicting the response of individual patients to EGFR pathway inhibitors.
Material and methods
Patients
For the training set, 381 fresh frozen tumour samples from patients with CRC were collected at four different hospitals (Institut Català d'Oncologia, Leiden University Medical Center, Netherlands Cancer Institute, Slotervaart General Hospital). Most patients had stage II (n=205) and stage III (n=116) CRC; 51 patients had stage I and 8 patients stage IV cancer. Main characteristics of the patients are depicted in table 1 and have also been described in reference24 The validation study was performed on 80 tumour samples, 50 stage II and 30 stage III with similar patient characteristics as the training set (table 1). All tissue samples were collected from patients with appropriate informed consent. The study was carried out in accordance with the ethical standards of the Helsinki Declaration and was approved by the Medical Ethical Board of the participating medical centres and hospitals.
Clinico-pathological information and mutation status
Mutational analysis
Mutations in BRAF V600, KRAS codons 12, 13 and 61, and PIK3CA exons 9 and 20 were assessed in cDNA by Sanger sequencing of PCR products using primers with M13 tails after RT-PCR. (ServiceXS BV). V600E BRAF mutation were analysed after amplification of exon 15, using primers 5′-TGATCAAACTTATAGATATTGCACGA (upstream) and 5′- TCATACAGAACAATTCCAAATGC (downstream). KRAS whole coding region was analysed using primers 5′-AGGCCTGCTGAAAATGACTG (upstream) and 5′-TGGTGAATATCTTCAAATGATTTAGT (downstream). For PIK3CA the primers used were 5′-CCACGCAGGACTGAGTAACA (upstream) and 5′-GGCCAATCTTTTACCCAAGCA (downstream) for exon 9, and 5′-TGAGCAAGAGGCTTTGGAGT (uptstream) and 5′-AGTGTGGAATCCAGAGTGAGC (downstream) for exon 20. The Mutation Surveyor Software (SoftGenetics LLC) was used for sequence analysis.
Gene expression profiling and signature development
RNA isolation, amplification, labelling, the hybridisation to Agilent full-genome microarrays and data processing was performed as previously described.24 Since all samples contained at least 40% tumour cells, we assumed that they were informative for tumour cell status. The reference comprised a pool of 44 CRC specimens and was processed and labelled in the same manner as the test samples.
Normalised gene expression ratios for every hybridisation were combined to produce a single gene expression profile per patient, using Matlab software (MathWorks, Inc, Natick, Massachusetts, USA). Development of each of the three oncogenic signatures was performed according to a 10-fold cross-validation strategy (CV10).24 For each of the CV10 iteration, 10% of samples with an activating mutation and 10% of the wildtype samples were randomly excluded from the gene selection procedure and used for testing of the identified gene signatures. Using the remaining 90% of samples, each gene was scored for its association with the mutation status in the training procedure (table 1). Only genes with a p value <0.05 (two-sided Student's t test) and a differential expression >1.25 were ranked-ordered based on their p value, and used for subsequent signature construction. For increasing gene set (2, 3…500) a nearest centroid classification model was constructed and tested on the initially excluded 10% of samples.25 Signature performance and individual gene p values were recorded, and the complete CV10 procedure was repeated a thousand times. The final optimal set of genes was determined by combing all CV10 results and selection of the minimal number of genes with the higher overall accuracy (combined sensitivity and specificity).
The selected set of optimal gene probes was used to score all tumour samples for their correlation with the KRAS, the BRAF and the PI3KCA signature (Suppl Table S1). Depending on whether the signature score exceeded a predefined threshold, a sample was classified as activated oncogenic or as wildtype-like. The signature thresholds were based on an optimal sensitivity to correctly identify all known oncogenic mutation carriers and all other samples that harboured the activating oncogenic signatures. For a comprehensive identification of tumours that harbour activating oncogenic mutation(s) in the EGFR-signalling pathway, the three individual KRAS, BRAF and PIK3CA oncogenic signatures were combined. In this combined model, the gene expression pattern of each tumour is scored for its association with all the three oncogenic mutation signatures and placed into a 3D plot. All signature-related gene expression data are available on the Agendia Research web site (https://research.agendia.com).
Signature validation in cetuximab-treated patients
Publicly available Affymetrix gene expression and clinical data from 80 samples from metastatic colon cancer patients who have been treated with cetuximab12 were downloaded via the Gene Expression Omnibus with accession number GSE5851. Using all probes, the unsupervised K-means clustering with cityblock distance measurement can partition these 80 tumours into two groups: one group with 33% of samples and the other group with 67% of them. Clinical data regarding cetuximab treatment response were available for 68 patients. We could identify 49 of the 75 KRAS signature genes, 37 of the 59 BRAF signature genes and 34 of the 49 PIK3CA signature genes. The genes found on the Affymetrix arrays are highlighted in the Suppl Table S1. Readout of the signature scores on the Affymetrix data by the nearest centroid classifier methods was done in a similar fashion as used for the in-house Agilent microarray data. Samples were ranked according to the signatures scores and classified as activating oncogenic (n=22) and wildtype-like (n=46) based on the 33-percentile.
Additional analysis
Ingenuity Pathways Analysis (IPA) software (Ingenuity Systems, Inc, Redwood City, California, USA), was used for gene ontology analysis and to analyse the profile genes for their potential-enriched biological and/or molecular function and signalling pathway involvement. A comparison was made between tumours harbouring no oncogenic mutations in BRAF, KRAS and PI3KCA, but classified as activating oncogenic (n=79) and tumours harbouring no oncogenic mutations in BRAF, KRAS and PI3KCA that were classified as wildtype-like (n=127). The false discovery rates-adjusted p values by Benjamini and Hochberg linear step-up procedure were calculated using a Student's t test. Differentially expressed genes (Benjamini and Hochberg-adjusted p value <0.05) were input into IPA. To eliminate false protein–protein interactions in the pathway, only experimentally observed direct inhibitions and direct activations were considered. The area under Receiver Operating Characteristics (ROC) curve analysis was performed using MedCalc for Windows, version 9.6.4.0 (MedCalc Software, Mariakerke, Belgium).
Results
Mutational analysis
Three hundred and eighty-one primary colorectal tumours for which we have recently reported full genome gene expression analysis were analysed.24 KRAS mutations were detected in 115 out of 381 cases (30.2%), PIK3CA mutations in 44 cases (11.5%) and BRAF mutations in 42 cases (11%) (table 1). Altogether, 175 tumours (45.9%) harboured at least one oncogenic mutation. The majority of KRAS mutations was found at codon 12 (22%), while 6.8% had mutation at codon 13, and 1.9% of patients harboured a mutation at codon 61. For PI3KCA, mutations were analysed in two previously reported ‘hotspot’ regions in exons 9 and 20, corresponding to the accessory (helical) and catalytic domains of PIK3CA, respectively. Mutations E542K/L, E545K/G, Q546K and D549E in exon 9 and mutations M1043I, A1046A and H1047L/R/Y in exon 20 were considered activating.26 The majority of patients had mutations in exon 9 (7.1%) and only 4.7% in exon 20. One sample showed mutations in both exons. A limited overlap of mutations in different genes was observed. BRAF and PIK3CA mutations coexisted in nine cases (2.4%) and KRAS and PI3KCA mutations coexisted in 16 (4.2%) cases.
Development and validation of mutation signatures
KRAS, BRAF and PIK3CA mutation status was used to capture their gene-specific expression patterns. Using a 10-fold cross-validation procedure, three sets of genes were identified (Suppl Table S1) that were optimally suited for constructing an activating oncogenic signature for KRAS (75 genes, figure 1A), for BRAF (58 genes, figure 1B) and for PIK3CA (49 genes, figure 1C). None of the signatures correlated with disease relapse after a median follow-up time of 59.9 months (p values 0.572, 0.383, 0.441 for KRAS, BRAF and PIK3CA-signatures, respectively) indicating that the signatures are not prognostic. The KRAS oncogenic signature correctly classified 105 of the 115 tumours with a KRAS mutation (sensitivity 91.3%), and showed a specificity of 62% for an overall accuracy of 72.3% (table 2). No differences were evident between tumours harbouring codon 12 KRAS mutations or those harbouring codon 13 mutations (data not shown). The BRAF oncogenic signature correctly classified 38 of the 42 BRAF(+) tumour samples (sensitivity 90%), and classified 189 of the 206 tumours with no mutation as non-mutation-like (specificity 92%) resulting in an overall accuracy of 91% (table 2). BRAF mutations have been reported to be more frequent in patients with microsatellite instability (MSI-H).27 Indeed, a correlation (Matthews correlation MCC=0.48) was observed between BRAF signature and the presence of MSI-H status. MSI status was known for 269 patients of whom 29 were classified as MSI-H (28). Fourteen (14/29=48.3%) of the MSI-H patients had a BRAF mutation and 20 (20/29=69%) were classified as BRAF-oncogenic by the signature (figure 1B). The PIK3CA signature showed a sensitivity of 75% with a specificity of 80% and an overall accuracy of 79% (table 2). Again, no evident differences were observed between exon 9 and exon 20 mutations (data not shown).

KRAS, BRAF and PIK3CA-activating oncogenic gene signatures. Gene expression signatures specific for activating oncogenic mutations in (A) KRAS (75-gene signature), (B) BRAF (58-gene signature) or (C) PIK3CA (49-gene signature) genes. The heatmap represents relative gene expression levels of the signature genes across 381 colon tumour samples. Tumours are sorted according to the signature outcome (score). High gene expression is coloured in red, low expression in green. Score: tumour classified as activating oncogenic by the profile score are displayed as black boxes, tumours that are classified as wildtype-like are displayed as white boxes. KRAS, BRAF and PIK3CA: presence of the respective oncogenic mutations as measured by sequence analysis is indicted by corresponding black boxes. Any mutation: tumours carrying any of KRAS/BRAF/PIK3CA mutation are indicated by black boxes. AREG, EREG: expression levels of AREG and EREG. MSI, tumours with known MSI-H status.
Performance of KRAS, BRAF and PIK3CA mutation signatures in training and validation set
The three signatures were validated in an independent dataset of 80 tumour samples (table 2). In this validation set, the performance of the signatures was in very good agreement with results from the training set.
The heatmap of the three tumour classification signatures (figure 1) suggested that the oncogenic signatures of the different mutations might have some degree of overlap. The proportion of overlapping genes in the minimal optimal gene sets (Suppl Tables S1, S2 and S3) was higher than chance (p value<0.00001; hypergeometric statistics). Twenty-one overlapping genes for the KRAS+PK3CA signatures represent 28% of the components of the 75 KRAS gene signature and 43% of PIK3CA 49-gene signature are shared. The 11-gene overlap between BRAF and PIK3CA represents 22% of PIK3CA 49-gene signature, and 19% of the BRAF 58-gene signature. The overlap for KRAS + BRAF is lower: six genes (8% of KRAS 75 gene, 10% of BRAF 58 gene) (Table Suppl S3).
Values of area under the ROC calculated from all 381 samples for all mutations displayed highly significant values when compared with all mutations (p=0.0001; binomial exact test) suggesting that any mutation signature is able, to partially discriminate other types of mutations (supplementary table S4). Concordance analysis using κ statistics point to a modest overlapping of BRAF signature with PIK3CA mutations (AUC PIK3CA 0.65, κ=0.141) and of KRAS signature with BRAF mutations (AUC BRAF 0.76, κ=0.124).
Combined oncogenic pathway signature
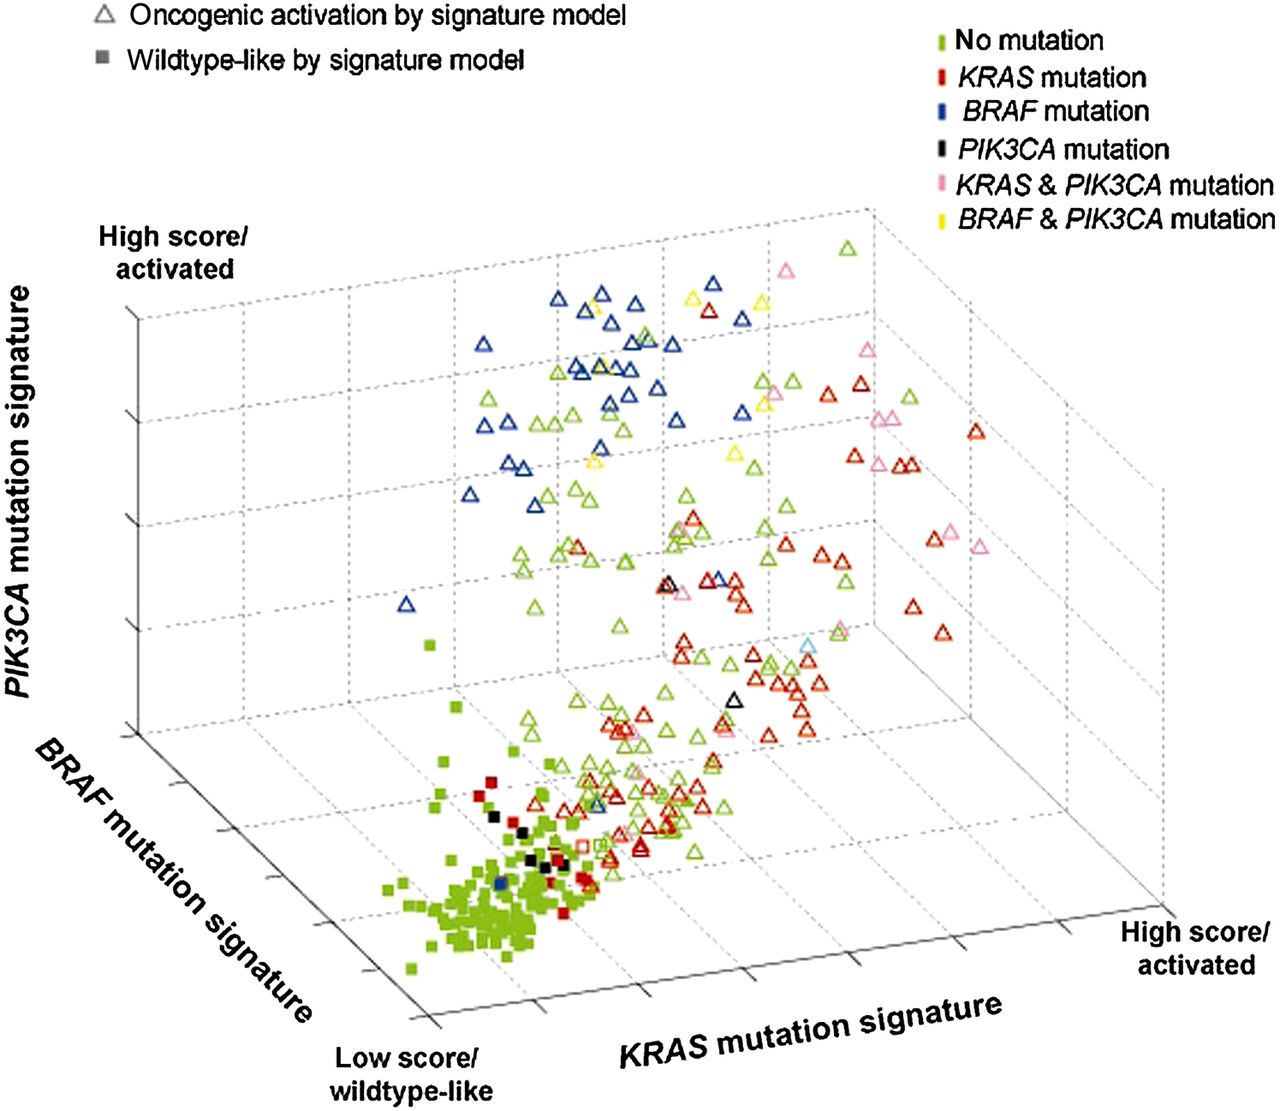
When using a multidimensional classification model (or combined oncogenic pathway signature), tumours displaying a gene expression pattern similar to any of the three oncogenic signatures were classified as ‘activating oncogenic’, while tumours with a gene expression pattern that is negatively associated with all three oncogenic signatures are classified as wildtype-like and showed a KRAS/BRAF/PIK3CA wildtype profile (figure 2). The combined oncogenic pathway signature correctly predicted the presence of a mutation in KRAS, BRAF and/or PIK3CA for 158 of the 175 known mutation carriers (sensitivity of 90.3%) in the training set, and 37 of 40 known mutation carriers (sensitivity of 92.5%) in the validation set.

Combined oncogenic pathway signature. Signature model for classification of 381 colon tumour samples based within a 3D space based on its association with the developed gene expression oncogenic signatures for KRAS (x-axis), BRAF (y-axis) and PIK3CA (z-axis). Each point represents a single tumour sample and is coloured according to its mutation status as measured by sequence analysis. The shape of the point represents that classification outcome based on the developed model in which triangles indicate tumours that are classified as mutation-like for the EGFR pathway by either KRAS, BRAF and/or PIK3CA; squares indicate tumours that are classified as non-mutation-like.
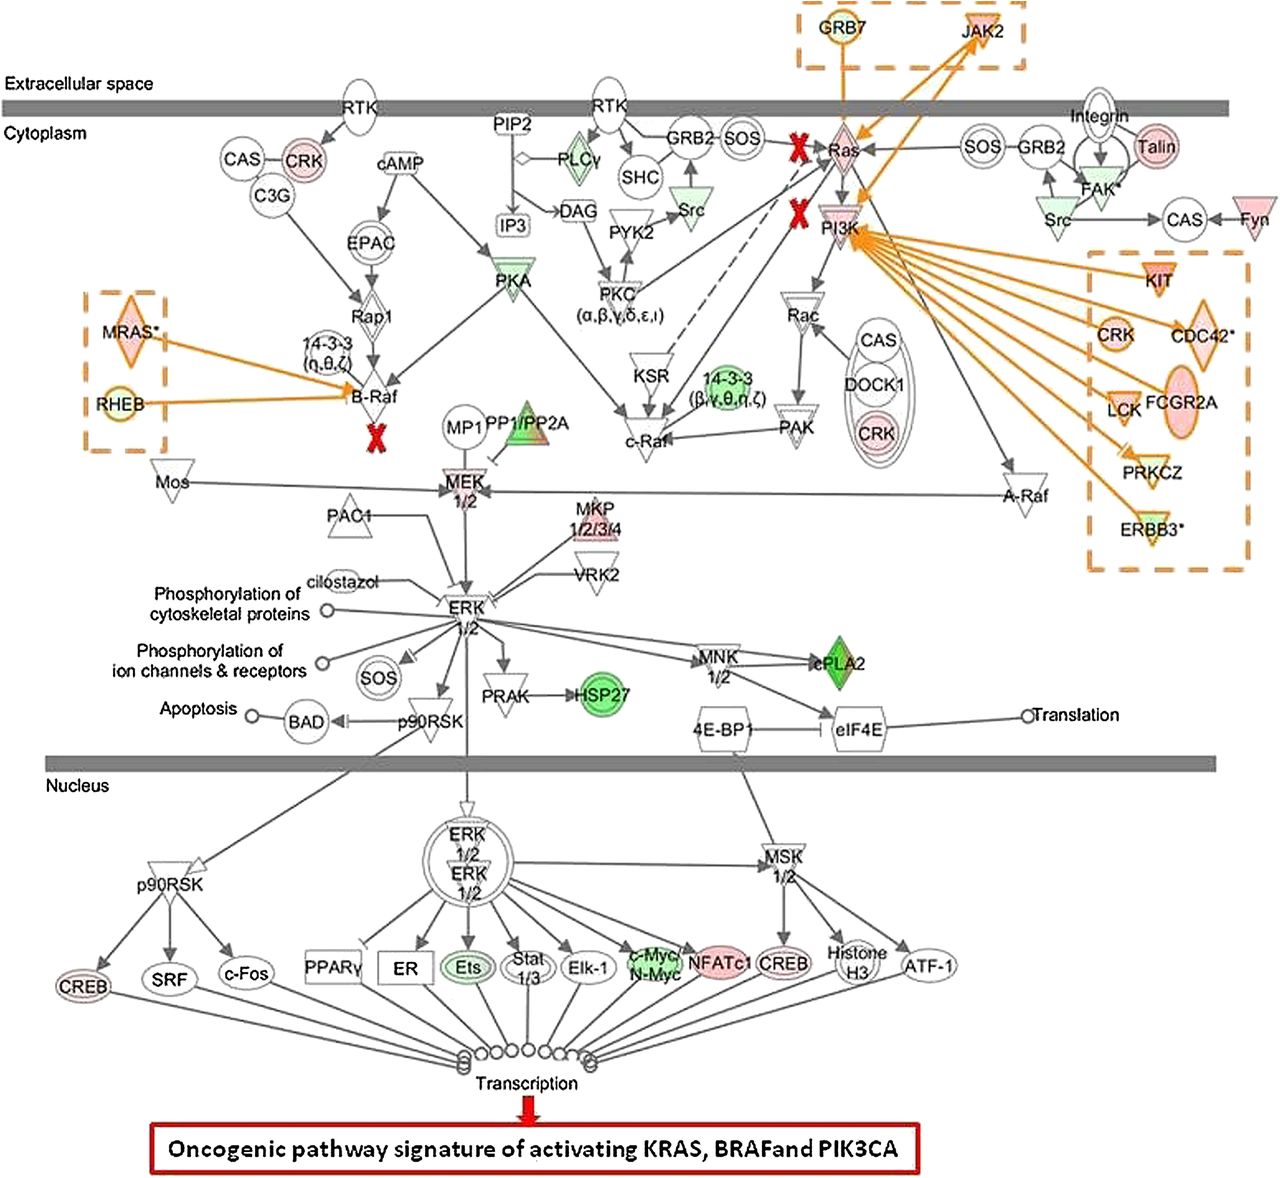
Interestingly, 79 of the 206 tumours that had no oncogenic mutations in BRAF, KRAS and PI3KCA were also classified as oncogenic based on their gene expression signatures (specificity of 61.7%) indicating that many KRAS, BRAF and PI3KCA wildtype patients share the same phenotype of an activated EGFR pathway as the patients with at least one activating mutation. To better understand why patients with no activating mutation in KRAS, BRAF and PI3KCA (n=79) were classified as activating oncogenic, we compared their gene expression pattern with the pattern of those patients who also had no detected oncogenic mutations in KRAS, BRAF and PIK3CA, but were classified as wildtype-like (n=127). IPA revealed that genes belonging to the ERK/MAPK pathway were significantly enriched in the combined signature (p=0.027). A more detailed analysis showed that there may be up to three alternate activating mechanisms in the set of wildtype patients having an oncogenic phenotype (figure 3). First, activation can occur directly through overexpression of key molecules in the pathway; indeed overexpression of RAS, PI3K and MEK 1/2 is observed (see red nodes in figure 3). Second, known activators of the ERK/MAPK pathway, such as KIT, CDC42, MRAS, CRK, FCGR2A, JAK2 and LCK are frequently overexpressed (activator genes coloured in red). Third, downregulation of proteins that are known to directly or indirectly inhibit molecules of the pathway (ie, RHEB) is observed as well (inhibitor genes coloured in green).

Ingenuity Pathway Analysis of differentially expressed genes of patients with no activating mutation in KRAS, BRAF and PI3KCA classified as oncogenic by the combined model (n=79) versus patients classified as wildtype-like (n=127) The ERK/MEK pathway can be activated by mutations in KRAS, BRAF or PIK3CA (marked with red crosses). In tumours harbouring no activating mutation, the ERK/MEK pathway can be activated by (1) upregulation of RAS, PI3K and mitogen-activated protein kinase family genes (red nodes), (2) upregulation of activator genes (coloured in red) and (3) downregulation of inhibitor genes (coloured in green).
Interestingly, tumours with high expression levels of amphiregulin (AREG) and epiregulin (EREG), two ligands that can activate EGFR and have shown clinical relevance for the treatment of CRC patients,12 clustered in the groups of patients with wildtype-like signatures (figure 1) showing an inverse correlation with the scores of the three KRAS, BRAF and PIK3CA oncogenic signatures (AREG: Pearson correlations −0.39, −0.42 and −0.47; EREG: −0.51, −0.53 and −0.58, respectively).
Association of the combined oncogenic pathway signature with response to cetuximab
The high proportion of mutation-negative cases that were displaying an oncogenic signature gave rise to the possibility that the signature could have some predictive value in the response to cetuximab beyond the mutation status. We explored whether the signatures have predictive value in the response to cetuximab (Erbitux) treatment in patients with metastatic CRC using a publicly available dataset of 80 metastatic colon cancer patients.12 Of these, information available was useful in 68 cases, 20 of them KRAS mutation positive. No patient had a BRAF mutation, and the PI3KCA mutation status was unknown. Tumour samples were analysed in silico for the KRAS, BRAF and PIK3CA signatures, and the combined signature was used to assess the association with response. As shown in the original publication,17 KRAS mutation status is an indicator of response with wildtype patients having a better outcome than patients with activating mutations (figure 4A). The 68 tumours were ranked according to their correlation with the gene signatures and classified as activating oncogenic or wildtype-like, based on the 33-percentile. Kaplan–Meier survival analysis resulted in a significant better survival of patients classified as wildtype (n=46) compared with patients classified as oncogenic (n=22) by the gene signatures (KRAS signature, HR=2.62 p=0.004, logrank test; BRAF signature, HR=2.08 p=0.018; PIK3CA, HR=2.67 p=0.003; Suppl figure 1). The combined oncogenic pathway signature also showed a strong predictive value (HR=2.51 p=0.0009, figure 4B).
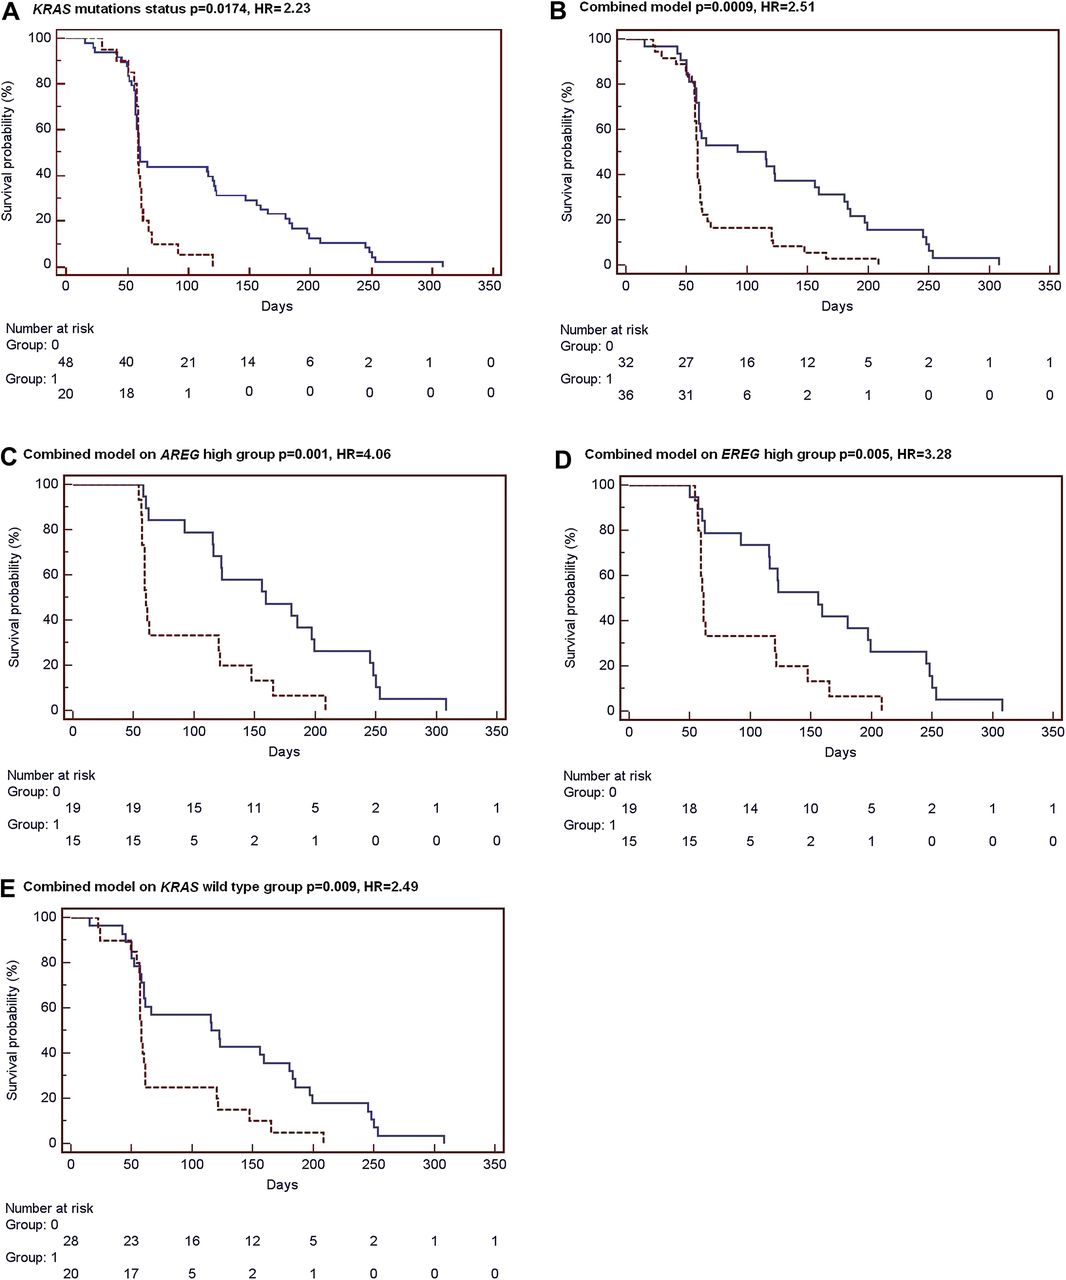
Classification by the combined signature is associated with response to cetuximab treatment. Kaplan–Meier survival analysis of 68 metastatic colorectal cancer patients who have received cetuximab treatment.12 Tumour samples have been classified in silico as wildtype-like (Group 0, blue solid line) or as oncogenic (Group 1, red dashed line) by the (A) KRAS mutation status, by (B) the combined signature model. In addition, survival curves are shown for classification by the combined signature model of AREG-high (C) and EREG-high (D) samples groups, and for KRAS wildtype patients only (E).
We further evaluated whether the association of the combined signature with cetuximab response was independent of amphiregulin (AREG) and epiregulin (EREG) expression levels as these two ligands have been shown to have predictive value for cetuximab response.12 For this purpose, the 68 tumours were split into an AREG-high (n=34) and an AREG-low (n=34) group based on the median AREG expression level. Within the AREG-high group, the oncogenic pathway signature remained significantly associated with survival of treated patients (HR=4.06 p=0.001, figure 4C). This analysis was repeated for EREG expression, and also within the EREG-high patient group the combined signature was able to identify patients who benefited more from cetuximab treatment (HR=3.28 p=0.005, figure 4D). In contrast, classification using the combined signature showed no association with survival within the AREG-low (p=0.99) and EREG-low groups (p=0.35). These results indicate that, although classification by the gene signature model is associated with AREG/EREG expression, it likely holds additional predictive value to further stratify patients that benefit most from anti-EGFR-targeted therapies.
We investigated whether the predictive power of the combined oncogenic pathway signature is independent of KRAS mutation status. The combined classification model showed a significant performance within KRAS wildtype patients (HR=2.49 p=0.009, figure 4E), indicating an association with survival beyond KRAS wildtype status. As expected, almost all samples with a KRAS mutation were classified as mutation-like by the combined signature (16 of 20), and within this group the gene signature model showed no association with treatment response (p=0.63). Finally, KRAS status is not predictive in the 36 patients with activated oncogenic pathway (data not shown).
Discussion
Three signalling pathway signatures were developed to characterise specific types of oncogenic mutations in colon cancer (KRAS, BRAF or PIK3CA). The results indicate that, in spite of widespread effects, tumours with these mutations display a partially shared gene expression pattern captured by our signature. The combined oncogenic pathway signature model has led to the classification of ‘activating oncogenic’ tumours with a significant proportion of mutation-negative cases.
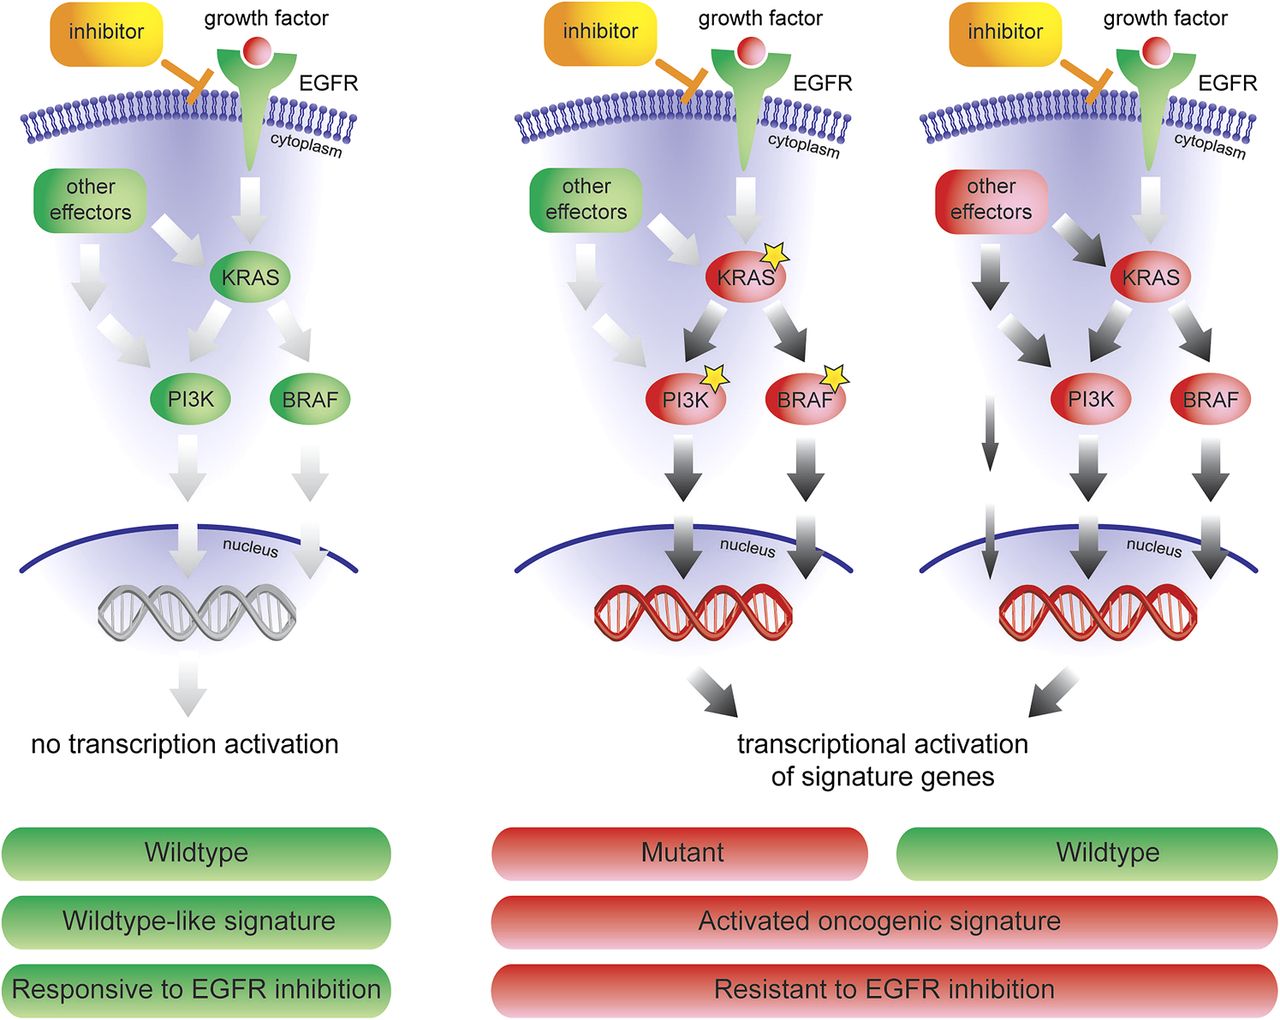
The combined oncogenic pathway signature identifies tumours with one specific mutation, but also patients with an activated EGFR pathway caused by other aberrations or by unknown activation mechanisms (figure 5). A variety of mechanisms can activate the EGFR/ERK/MAPK pathway in wildtype patients: (1) directly by upregulation of RAS, PI3K and mitogen-activated protein kinase family genes; (2) indirectly by up-regulation of activator genes, like KIT, CDC42, MRAS, CRK, FCGR2A, LCK and JAK2 or (3) by downregulation of inhibitor genes. These mechanisms of activation can only by detected by a signature that measures the effect of any downstream activation. Taken together, our data reveals novel underlying mechanism as to why a colorectal tumour with no known activating mutations in KRAS, BRAF or PIK3CA can display a shared gene expression pattern with mutation carriers, and explains resistance to the treatment of anti-EGFR drugs, such as cetuximab.

Mechanism of response to anti-EGFR inhibitors. The combined oncogenic pathway signature can not only identify tumours with one specific mutation, but also patients with an activated EGFR pathway caused by other aberrations, or by unknown activation mechanisms.
In line with this observation, no particular enrichment for members of the canonical EGFR-signalling pathways is evident in the individual and combined signatures. However, a reduced number of these genes is shared, such as the members of the dual-specificity phosphatases (DUSPs) family DUSP6 and DUSP18. Genes associated with the same response (ie, DKK1, PHLDA1 and SLC7A) are also part of them. DUSP proteins shut down MAPK signalling and are involved in the late response to EGF. They play a relevant role in the negative feedback regulation of EGFR--signalling pathway attenuating the response to EGF.28 DUSP4 and DUSP6 were originally identified as top resistance markers to cetuximab in unselected patients12 ,29 and have also been highlighted in in vitro systems.30 The use of a four-gene model, including AREG, EREG, DUSP6 and SLC26A3, has been shown to improve the identification of responders among preselected KRAS wildtype patients.29 As there is a clear association between cetuximab response and mutation status, it is not surprising that we find DUSP6 and members of the SLC family also in the mutation signatures. Interestingly, DUSP6 and SLC7A have also been shown to correlate to response to MEK inhibitors31 and PI3K pathway inhibitors.23
Among the individual signatures, the BRAF oncogenic-specific signatures showed the most distinct gene expression pattern, and had the best performance with an overall accuracy of 91%. The more explicit BRAF signature identified two large distinctive groups and showed no ambiguous region when compared with KRAS (figure 1A) and PIK3CA profiling (figure 1C). As expected, a strong correlation was observed with MSI-H status. BRAF mutations have been described to be more frequent (40%–50%) in MSI-H patients.27 The better accuracy of the BRAF signature may reflect its more downstream position within the EGFR-signalling transduction pathway. KRAS and PIK3CA are located more upstream in the EGFR-signalling cascade and may, therefore, signal to a wider range of downstream signal transduction pathways and transcriptional effects. In contrast, the further downstream-located BRAF may signal to a more limited number of signal transduction pathways, resulting in a more discrete gene expression pattern. In spite of its high specificity, BRAF signature still captures a proportion of KRAS mutant cases in line with the recent description of a population of BRAF mutated-like KRAS mutants.32
This combined model is associated with response to cetuximab treatment in patients with metastatic CRC with better performance than each of the three single mutation signatures and using the KRAS mutation status alone. This combined signature has independent value from KRAS mutation and AREG and EREG expression status, which are currently the major determinants of response. It can be speculated that these patients might benefit more from downstream inhibitors like MEK, AKT or PIK3CA inhibitors. In fact, signatures measuring pathway activation can identify patients who are sensitive to the pathway inhibition, and the signatures are superior to measuring the mutation status alone.23 ,31
The finding that the signatures and the combined model are in good agreement with known markers of response to cetuximab, but offer additional information beyond those markers, confirms our hypothesis that a genomic signature might be a more comprehensive solution to identify the patients who are most likely to benefit. This might be of special interest when less well-characterised pathways are targeted, and knowledge about predictive markers is limited.
The large numbers of well-annotated early stage tumours that have been profiled have provided us with adequate power to develop and validate the signatures. The use of Sanger sequencing with RNA as a starting material is a robust and reasonably sensitive option when analysing tumour cell-enriched samples. While we are aware that some KRAS-positive cases may have been misclassified, we do not think that this affects the validity of our observations. The excellent correlation between the training and validation set and the strong biological plausibility of the signature genes has confirmed the potential of using simple predictors and simple reporter-selection strategies.33 The utility of the profile still needs further validation in patients treated with EGFR-pathway inhibitors. Finally, it will be of interest to know whether these profiles will be useful in the prediction of response of the novel compounds that inhibit the EGFR pathway further downstream, that is, at the level of PI3K, BRAF, MEK or mTOR.
Acknowledgments
We would like to thank Leiden University Medical Center, The Netherlands Cancer Institute, the Slotervaart General Hospital in The Netherlands, Institut Català d'Oncologia and Hospital Vall d'Hebron in Spain for their patient samples. We also thank Miguel Angel Pujana for deep insight and help in the early stages of this work.
References
Supplementary materials
Supplementary Data
This web only file has been produced by the BMJ Publishing Group from an electronic file supplied by the author(s) and has not been edited for content.
Files in this Data Supplement:
- Data Supplement 1 - Online Supplementary
- Data Supplement 2 - Online Figure
Footnotes
ST and IS contributed equally to this work.
Funding This study was partially supported by grants SAF 09-07319 SAF 06-6084 from the Spanish Ministry of Education and Science, from Fondo de Investigación Sanitaria (FIS 07/0475), F05-01 from the Fundació Gastroenterologia Dr. Francisco Vilardell, RCESP C03/09 and RTICCC C03/10, RTICCRD06/0020/050, Acción Transversal contra el Cáncer, the Instituto de Salud Carlos III (FIS PI08/1635, FIS PI08/1359, PS09/01037, CB07/02/2005 CIBERESP) and European Commission grant FP7-COOP-Health-2007-B ‘HiperDart’. We are especially grateful to the Asociación Española contra el Cáncer.
Competing interests Employment or Leadership Position at Agendia: TS, IS, PR, MS, LvV and RB. Stock Ownership Agendia: LvV and RB. Honoraria: none. Research funding: none. Expert testimony: none. Other remuneration: TS, IS and PR are inventors on a patent relevant to the presented work.
Patient consent Obtained.
Ethics approval Ethics approval was provided by the Medical Ethical Board of the participating medical centres and hospitals.
Provenance and peer review Not commissioned; externally peer reviewed.
Data sharing statement All signature-related gene expression data are available on the Agendia Research web site (https://research.agendia.com).