Article Text

Abstract
Objective The number of colonoscopies required to reach competency is not well established. The primary aim of this study was to determine the number of colonoscopies trainees need to perform to attain competency, defined by a caecal intubation rate (CIR) ≥90%. As competency depends on completion, we also investigated trainee factors that were associated with colonoscopy completion.
Design The Joint Advisory Group on GI Endoscopy in the UK has developed a trainee e-portfolio from which colonoscopy data were retrieved. Inclusion criteria were all trainees who had performed a total of ≥20 colonoscopies and had performed ≤50 colonoscopies prior to submission of data to the e-portfolio. The primary outcome measure was colonoscopy completion. The number of colonoscopies required to achieve CIR ≥90% was calculated by the moving average method and learning curve cumulative summation (LC-Cusum) analysis. To determine factors which determine colonoscopy completion, a mixed effect logistic regression model was developed which allowed for nesting of patients within trainees and nesting of patients within hospitals, with various patient, trainee and training factors entered as fixed effects.
Results 297 trainees undertook 36 730 colonoscopies. By moving average analysis, the cohort of trainees reached a CIR of 90% at 233 procedures. By LC-Cusum analysis, 41% of trainees were competent after 200 procedures. Of the trainee factors, the number of colonoscopies, intensity of training and previous flexible sigmoidoscopy experience were significant factors associated with colonoscopy completion.
Conclusions This is the largest study to date investigating the number of procedures required to achieve competency in colonoscopy. The current training certification benchmark in the UK of 200 procedures does not appear to be an inappropriate minimum requirement. The LC-Cusum chart provides real time feedback on individual learning curves for trainees. The association of training intensity and flexible sigmoidoscopy experience with colonoscopy completion could be exploited in training programmes.
- Colonoscopy
This is an Open Access article distributed in accordance with the Creative Commons Attribution Non Commercial (CC BY-NC 3.0) license, which permits others to distribute, remix, adapt, build upon this work non-commercially, and license their derivative works on different terms, provided the original work is properly cited and the use is non-commercial. See: http://creativecommons.org/licenses/by-nc/3.0/
Statistics from Altmetric.com
Significance of this study
What is already known on this subject?
-
The caecal intubation rate (CIR) of 90% is a standard in routine use in colonoscopy practice and is a key indicator of competency.
-
The number of colonoscopies required to achieve a CIR of ≥90% is not well established, yet a set number of procedures forms part of training certification criteria both in the UK and USA.
-
Previous studies investigating the number of colonoscopies required to achieve competency have been limited to small groups of trainees, mostly from single centres.
-
Cumulative summation (Cusum) charts are widely used in healthcare to monitor processes of care, but requirements of monitoring during training/learning periods are not adequately reflected in standard Cusum charts.
What are the new findings?
-
Our study interrogated the Joint Advisory Group (JAG) e-portfolio which includes data from all training centres in the UK. This provided a unique opportunity to analyse colonoscopy data submitted by 297 trainees in the early stages of their training.
-
Two statistical methods were employed to determine the number of colonoscopies required to achieve a CIR of ≥90%. By moving average analysis, the cohort of trainees reached a CIR of 90% at 233 procedures. By LC-Cusum analysis, 41% trainees were competent after 200 procedures.
-
The association between training intensity and previous flexible sigmoidoscopy experience with colonoscopy completion has not been reported previously.
How might it impact on clinical practice in the foreseeable future?
-
Our study lends support to the current colonoscopy certification criteria in the UK. The visual feedback provided by LC-Cusum charts could form part of a future composite measure designed to define competency.
-
This large study of UK endoscopy trainees will allow future trainees to benchmark their competency progression against a UK national average.
-
Trainees should aim to have periods of intense focused colonoscopy training to increase their rate of competency acquisition and not be concerned about gaps in their training.
Introduction
Colonoscopy training programmes are required to assess the competency of trainees performing colonoscopies.1 ,2 Although competency can be assessed by a range of factors, including patient comfort, appropriate sedation, adenoma detection rate and polyp retrieval rate, the caecal intubation rate (CIR—the extent to which the colon is examined) remains an important parameter3 and is the focus of this study. It is accepted that not all colonoscopies can be completed to the caecum for reasons including poor bowel preparation, diverticular disease, strictures and patient discomfort.4 Therefore, a target CIR of 90% has been set by the Joint Advisory Group (JAG) on Gastrointestinal Endoscopy in the UK.3 Stipulation of the target CIR is necessary but insufficient without specifying the minimum number of procedures over which the target CIR of ≥90% is to be achieved—too few and we risk trainees being certified prematurely, too many and we risk delaying the certification of otherwise competent trainees. Nevertheless, the minimal number of procedures that need to be performed to reach this standard is not well established. The American Board of Surgery have recommended that a minimum number of 50 colonoscopies be performed during training5 whereas the UK JAG stipulates 200.6
Previous studies have tried to determine the number of colonoscopies required to achieve a CIR of ≥90% by following groups of inexperienced trainees through their training at individual centres.7–15 These studies reported discordant results, with some suggesting that a CIR of ≥90% can be achieved after 150 procedures7 ,9 while others stipulate a requirement for more than 275 procedures.14 ,15 These differences may be explained by the small cohorts of trainees assessed (n=8–41), variation in competency progression and quality of training. Our primary aim was to determine, more definitively, the minimum number of colonoscopies that should be performed during training to reach competency and thereby enable national training bodies to make more informed decisions on colonoscopy training.
JAG has developed an e-portfolio for trainees to record their endoscopic experience—the JAG endoscopy training system (JETS) e-portfolio16 which is used by all endoscopy training units in the UK. We made use of this large database to overcome the shortcomings associated with small sample sizes. The JETS e-portfolio allows all UK endoscopy trainees to demonstrate their endoscopic experience, and facilitates both formative and summative assessments. Use of the JETS e-portfolio is a prerequisite for JAG certification. The e-portfolio was rolled out in 2009 and contains procedure data for over 2000 trainees. The database also allows for the investigation of factors associated with colonoscopy completion—a secondary aim of this study.
Determination of the minimum number of colonoscopies can be undertaken using two statistical (graphical) approaches—the moving average method17 and the learning curve cumulative sum (LC-Cusum) method.18 We adopted both approaches. The moving average method produces an empirical learning curve for the cohort of trainees by taking data available from all trainees. The LC-Cusum analysis18 involves an adaptation of the cumulative sum method widely used in healthcare19 ,20 to the learning context. The LC-Cusum produces a learning curve for each trainee, and when this curve crosses a predefined threshold, the trainee is deemed to have reached an acceptable level of performance.
Methods
Subjects
The JETS e-portfolio database was interrogated to retrieve all colonoscopy records from the date of the portfolio's release on 1 September 2009 to 5 December 2012. The following fields were retrieved: endoscopist identifier, date of procedure, patient age and gender, diagnosis at colonoscopy, extent of procedure and extent completed by trainee.
The database was used to return details on all its registered users who had entered colonoscopy data. The following fields were retrieved: number of different trainers, completion of a JAG colonoscopy course, and flexible sigmoidoscopy and oesophagogastric duodenoscopy experience. Some users had entered the number of baseline colonoscopies they had performed prior to submitting the data to the JAG e-portfolio, although this was not a mandatory requirement. This baseline number was categorised as ‘none’, ‘1–20’, ‘21–50’, ‘51–100’ and ‘more than 100’. All users were surveyed to determine their number of baseline colonoscopies, training posts and any breaks in their training. Two reminders were sent.
Trainees who had submitted fewer than 20 colonoscopies to the database were excluded from further analysis, as this was the minimum number required to calculate a moving average completion rate. To ensure that learning curves were assessed only for trainees in the early stage of their endoscopy training, all users with a baseline number >50 were excluded from further analyses.
Primary outcome measure
The primary outcome measure was colonoscopy completion. For a colonoscopy to be defined as complete, two criteria had to be met. Firstly, the colonoscopy had to be performed either with trainer observation but no physical assistance from the trainer or independently without trainer observation. Secondly, the extent of the colonoscopy performed by the trainee had to be classified as ‘caecum’, ‘terminal ileum’, ‘ileo-colon anastomosis’ or ‘neoterminal ileum’.
Statistical analyses
Two approaches (moving average and LC-Cusum) are available to determine the minimum number of procedures, and we used both. We report the proportion of trainees deemed competent by both methods.
Moving average analysis
The mean CIR was calculated for each trainee over blocks of 20 procedures, mirroring the methods of a recent study.14 The mean CIR for all trainees was calculated and plotted against the number of procedures performed. A trainee was deemed competent by this method if the moving average CIR exceeded 90%.
LC-Cusum analysis
Calculation of LC-Cusum scores has been described in detail elsewhere.18 Unlike other Cusum techniques, the LC-Cusum is designed for the learning/training environment and so for its null hypothesis (H0), the LC-Cusum assumes that the process under scrutiny is unacceptable (ie, learning phase) while the alternative hypothesis (H1) is that the process is in control (ie, competent phase). The LC-Cusum considers each procedure in sequence one at a time and does not penalise the trainee for early unsuccessful procedures because it has a holding barrier at zero. When the LC-Cusum crosses a predefined threshold (h), we conclude that sufficient evidence has been accumulated to indicate that the procedure has been learned (ie, the trainee is now competent) and hence H0 is rejected in favour of H1. When the LC-Cusum does not exceed the threshold, monitoring should continue because competency has not yet been demonstrated.
Application of the LC-Cusum technique (like any Cusum plot) requires setting of four parameters to determine threshold values: (1) p0 the acceptable failure rate, (2) p1 the unacceptable failure rate, (3) the probability of rejecting H0 when it is true (type I error) and (4) the probability of rejecting H1 when it is true (type II error). Choices of these four parameters vary with context and are often a matter of judgment and/or consensus from experts.21 A p0 value in our case is defined as 0.1, as this is the performance standard set by the JAG.6 Thus for a successfully completed colonoscopy, a trainee's LC-Cusum plot will rise by 0.1 units and drop by 0.9 units (=1–0.1) for an incomplete procedure. A p1 value is usually set to twice p0,22 ,23 although we consider a range of values which reflect a spectrum of more or less plausible values (0.15, 0.2, 0.25, 0.3). Typical values for type I and type II errors are 10% and, unlike power calculations for clinical trials, in the context of performance monitoring they are typically set to be equal.24 The LC-Cusum was designed in a similar manner to the two one-sided test procedure to test for equivalence in clinical trials.25
Patient, trainee and training factors
A mixed effects logistic regression model was constructed using colonoscopy completion as the outcome variable to determine which factors were independently associated with completion. To accommodate the hierarchical nature of the data, trainees and training centres were entered into the model as random intercept terms to accommodate the clustering effects—procedures within trainees and patients within centres. The random effects were designed to ensure that trainees worked in more than one centre (ie, trainees were not nested in centres).
The following trainee and training factors were entered into the model as fixed effects: number of procedures, training intensity (number of procedures per month), trainee specialty (physician, surgeon, nurse endoscopist), breaks in training >6 months, baseline experience of ≥100 sigmoidoscopies, baseline experience of ≥100 oesophagogastric duodenoscopies and attendance at a JAG approved colonoscopy course. The total number of colonoscopies was converted into an ordinal variable of blocks of 50 procedures in order to make the calculated ORs more clinically meaningful.
These factors were all available from the JETS e-portfolio database or survey, and were chosen as the number of procedures and baseline experience,7–15 training intensity26 and breaks from training27 have all previously been shown to have an effect on competency. Patient factors (age, gender and diagnosis on colonoscopy) were entered into the model as fixed effects. These factors have also been shown to influence colonoscopy completion rates outside of the training context.28 Twenty-eight different diagnoses could be entered into the diagnosis field, and multiple diagnoses were permitted. We collapsed the diagnostic terms into five different diagnoses (colorectal cancer, polyps, inflammatory bowel disease, diverticular disease, stricture), which appear to be clinically meaningful when considering completion, as reported in previous studies.4 ,28 ,29 These five diagnoses were entered as binary (present/absent) covariates in the statistical model.
Training intensity is highly dependent on breaks from training, such as rotating into a training post where there is no opportunity to perform colonoscopy. Therefore, an adjusted training intensity was calculated by dividing the number of procedures performed by the time period of continuous training. Continuous training was defined as the time from start to end date of submitted data, minus any periods of 90 days or more during which no data were submitted. It was assumed that any breaks from training of <90 days were unlikely to be due to a change in training post.
A p value <0.05 was considered to be statistical significant. All p values and ORs are quoted from the mixed effects model.
All data computations, graphics and statistical analysis were performed using R (R foundation for Statistical Computing, Austria), and the mixed modelling used the lme4 package.30
Exploring the p1 parameter
Unlike the acceptable failure rate (p0) of 0.10, there is no set standard for the p1 parameter. LC-Cusum charts were derived using different values for the p1 parameter in order to determine the effects of p1 on defining competency.
It was thought that colonoscopists achieving an average CIR ≥90% over a 12 month period ought to cross the upper control limit and therefore be deemed competent by LC-Cusum analysis. Therefore, to further aid assessment of the p1 parameter, LC-Cusum analysis was performed using sequential colonoscopy data from 15 independent colonoscopists at the Queen Elizabeth Hospital, Birmingham (QEH) and the Gloucestershire Royal Hospital, Gloucester (GRH), by interrogating the endoscopy reporting software (Unisoft Medical Systems, Middlesex and SQLScope, Gloucestershire, UK). Prospectively collected data over a 1 year period from January 2012 to January 2013 were analysed.
Validation of data submitted to the JETS database
To assess, at least partially, whether the JETS database captured all colonoscopies performed by trainees, validation of the data submitted to JETS by a sample of trainees was performed. We were able to obtain colonoscopy data for all trainees from the local endoscopy reporting database at QEH over the most recent 2 year period. Of these trainees identified from the local database, some trainees also submitted data to JETS. The number of colonoscopies submitted to JETS was compared with the number of colonoscopies logged for the trainee in the local endoscopy reporting database over the same time period. We compared the number of procedures in the two data sources using a linear scatterplot and Pearson's correlation coefficient and a mean difference Bland–Altman plot.31
Results
A total of 169 515 colonoscopy procedures entered by 1331 different users were retrieved from the JETS e-portfolio database (figure 1). These procedures were performed in 300 different endoscopy units throughout the UK. A total of 1165 users were registered as trainees. Baseline data had been recorded by 384 trainees in the JETS e-portfolio. All trainees were invited to complete the survey: 585 responded, giving a response rate of 50.2%, although only 460 responses returned colonoscopy baseline data. Baseline data were therefore available for 844 trainees.

Study protocol. JETS, Joint Advisory Group endoscopy training system.
Trainees who had submitted fewer than 20 colonoscopies to the database were excluded from further analysis, yielding 651 trainees. Trainees with a baseline number >50 procedures were then excluded, yielding the final total number of trainees for further analysis as 297. These trainees had performed a total of 36 730 colonoscopies from 255 different training units. The median number of training units per trainee was 3 (IQR 2–4, range 1–9).
Analysis of competence
The mean CIR by the moving average method for all trainees was plotted against colonoscopy number (figure 2). The mean CIR was 67.9%, 76.2% and 84.1% after 100, 150 and 200 procedures, respectively. The mean CIR reached the standard of 90% at 233 colonoscopies.

Mean moving average caecal intubation rate (CIR) against colonoscopy number (black line), plotted with 1 and 2 SDs of the mean. The mean CIR reached 90% at 233 colonoscopies.
LC-Cusum analysis (with p0=0.10, p1=0.20) defined trainees as competent or yet to reach competence, according to whether the upper control limit was crossed or not. By this method, 36 trainees were competent with 261 trainees yet to reach competency. The median number of procedures for the group of competent trainees to reach competency (ie, cross the upper control limit) was 171 (figure 3). It is important to emphasise that 171 procedures is not the median number of procedures required to achieve competency for all trainees. The majority of trainees (261) did not cross the upper control limit. Forty-nine trainees had performed 200 procedures or more: after 200 procedures, 21 trainees had attained competency and 30 trainees were yet to reach competency, giving a proportion of competent trainees of 41%. Thirty-three trainees had performed 250 or more procedures: after 250 procedures, 28 trainees had attained competency and nine trainees were yet to reach competency, a proportion of 76%.

Median number of colonoscopies required to achieve competency for those trainees defined as competent by the learning curve cumulative summation (LC-Cusum) method.
Factors associated with colonoscopy completion
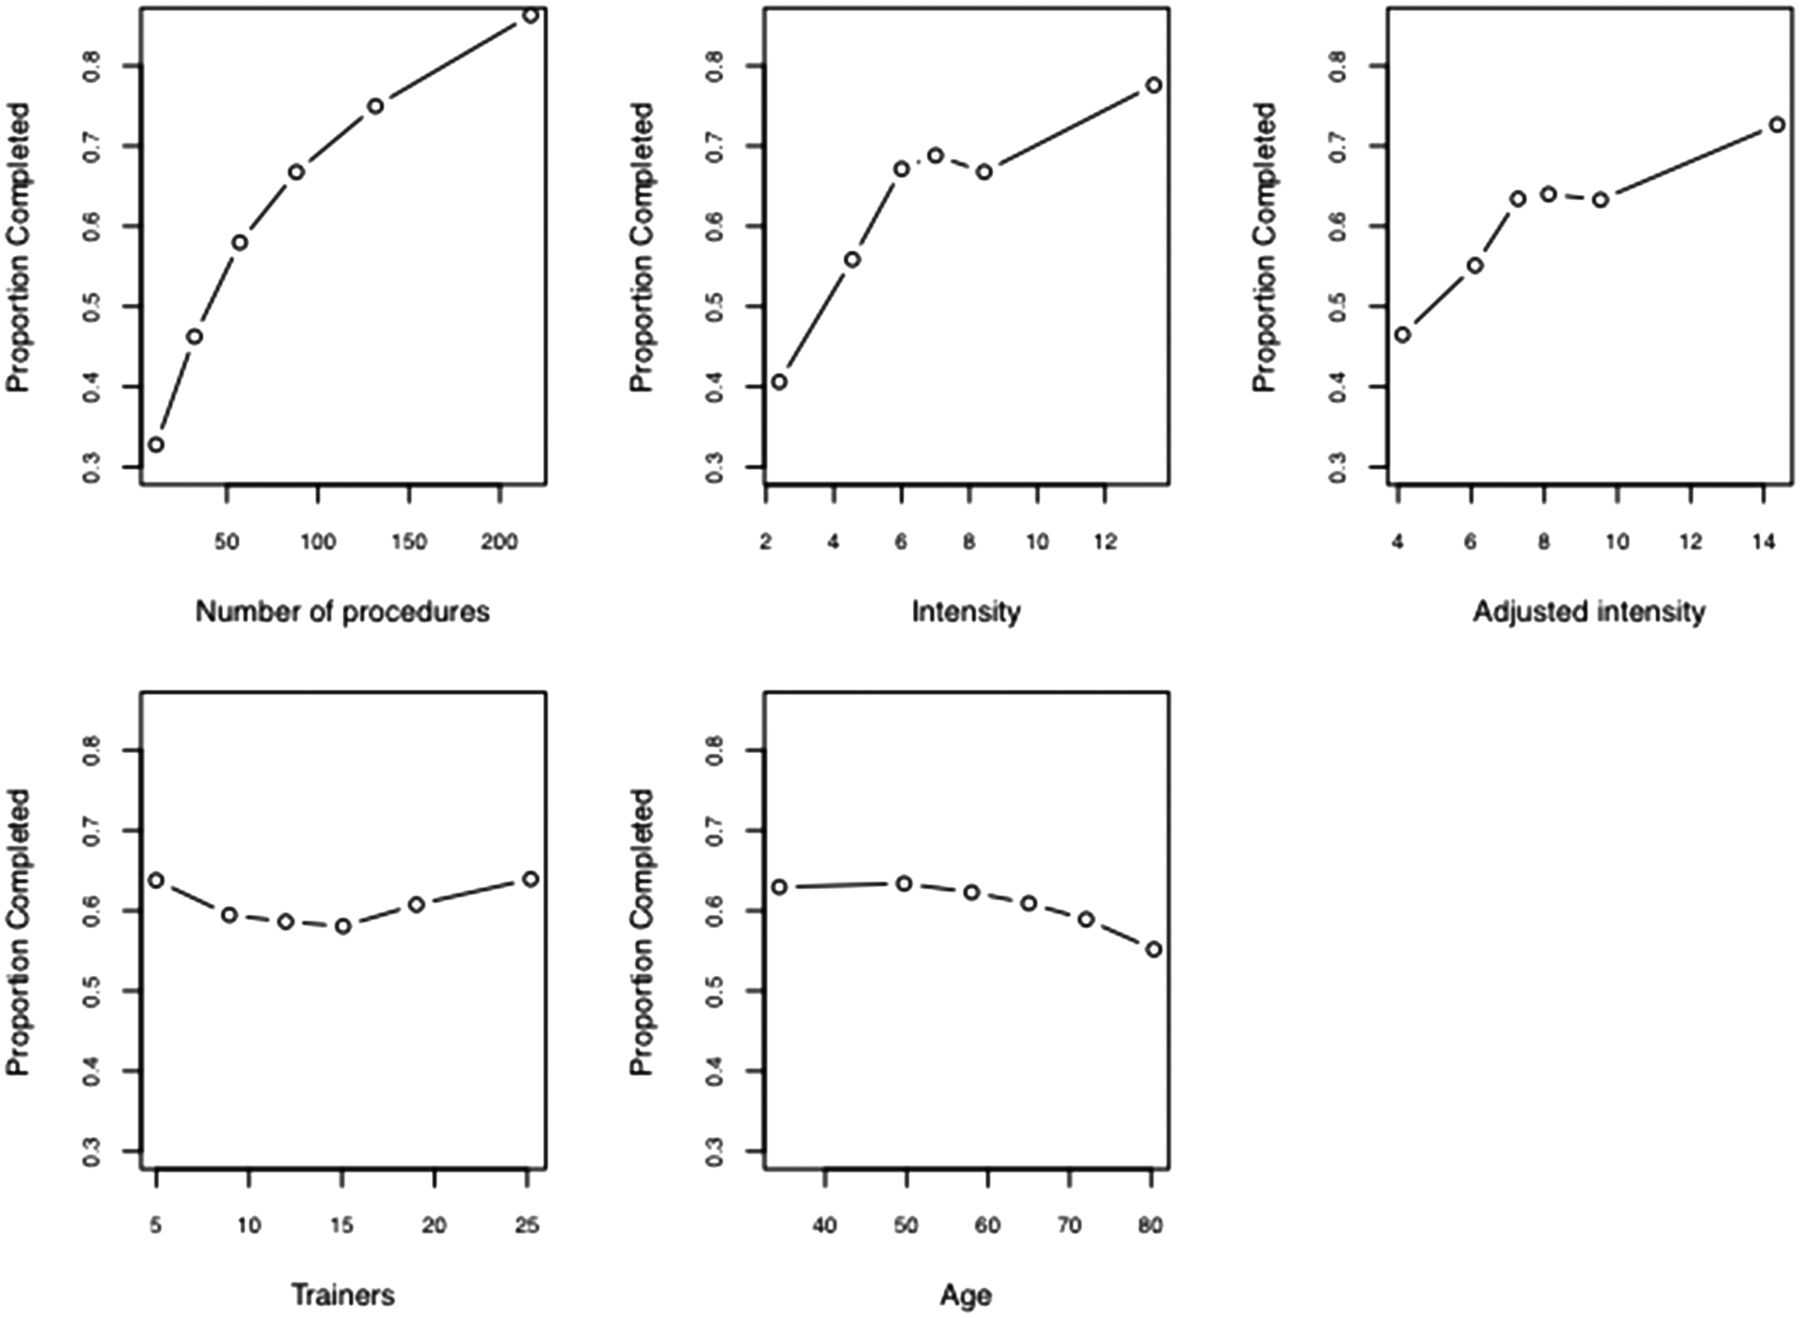
The results of the mixed effects logistic regression model is shown in table 1. In terms of trainee and training factors, an increasing number of procedures performed, a high training intensity, previous experience of more than 100 flexible sigmoidoscopies, a baseline level of colonoscopy experience of >20 procedures and being a surgical trainee were independently associated with colonoscopy completion. With regard to patient factors, female gender and age ≥65 years were significantly associated with colonoscopy incompletion. The relationship between the proportion of colonoscopies completed against measured continuous variables is shown in figure 4. The proportion of completed colonoscopies increased with increasing number of procedures and training intensity. The proportion of completed colonoscopies decreased with increasing age above 60 years. A diagnosis was available for 83% colonoscopies, and submission of a diagnosis was independently associated with completion. The presence of colorectal cancer, diverticular disease and stricture were all significantly associated with incompletion.
Results of mixed effects model using colonoscopy completion as the outcome measure
Scatterplot of the proportion of colonoscopies successfully completed against number of procedures performed, unadjusted intensity, adjusted intensity, number of different trainers and patient age.
Adjustment of the p1 parameter
Different values of p1 yielded different results in terms of defining trainees as competent (see table 2). Adjustment of the p1 value from 0.20 to 0.25 increased the proportion of trainees that were deemed competent by the LC-Cusum method from 41% to 88%. An example of how different values of p1 affect the LC-Cusum chart for an individual trainee is shown in the online supplementary figure S1.
Effect of different values of p1 on the number of trainees reaching competency after 200 procedures
It was thought that trainees achieving an average CIR of ≥90% over a 12 month period ought to cross the upper control limit and therefore be deemed competent by LC-Cusum analysis. To test this, sequential colonoscopy data over 12 months from 15 independent practitioners (six from QEH, nine from GRH) were charted. All independent practitioners achieved a CIR of ≥90% over the 12 month period and had performed in excess of 140 procedures (table 3). All practitioners crossed the upper control limit with p1 set to values of ≥0.20. When p1 was <0.20, some independent practitioners failed to reach LC-Cusum defined competence. This suggests that the lower limit for p1 used in LC-Cusum analysis of colonoscopy competency should be around 0.20.
Learning curve cumulative summation (LC-Cusum) analysis of competence of independent colonoscopists (numbered 1–15) using different values for p1
Validation of data submitted to JETS
Twenty-eight non-independent colonoscopists performed colonoscopies over a 2 year time period (September 2010 to September 2012) at QEH. Ten of these 28 were registered and had submitted data to the JETS database. There was a high correlation between the number of procedures recorded in JETS and the number of procedures recorded in the local reporting software databases for these 10 trainees over this time period (r2=0.99; p<0.01), but a Bland–Altman plot showed that the local number of procedures was on average three more than the JETS number (see online supplementary figure S2).
Discussion
This is the largest study investigating the colonoscopy learning curve to date and included all training centres in the UK. We have shown that a mean trainee CIR of 90%, calculated by moving average analysis, was reached at 233 procedures. By the LC-Cusum method, 41% of trainees were competent after 200 procedures and 76% were competent after 250 procedures. In order for a trainee to become provisionally certified as an independent colonoscopist in the UK, it is necessary for he/she to provide evidence that at least 200 procedures have been performed. For full certification (allowing fully independent practice), 300 procedures are required. Given our findings, these thresholds appear to be appropriate.
Advocates for lower numbers of procedures have argued that competency at performing a safe colonoscopy is more important than the absolute numbers performed.32 While this may be the case, the results from our study have shown that only a minority of trainees reach a CIR of 90% after 100 procedures. There is no apparent reason why trainees in the UK should develop colonoscopy skills at a slower rate than other countries, especially as there has been considerable investment and improvement in endoscopy training over the past decade.33 This has resulted in a notable improvement in colonoscopy performance statistics in the UK.28 ,34 In comparison, European trainees performed 280 colonoscopies to reach a CIR of 90% by the moving average method in a Dutch study14 (as opposed to 233 in our study).
Other studies investigating the colonoscopy learning curve have been limited to small cohorts of between one and 24 trainees from individual centres, and have reported differing results.7–14 It has been shown that a CIR of ≥90% can be achieved after only 140–150 procedures,7 ,9 although it is unclear what the absolute baseline level of colonoscopy experience was among these trainees. It is possible that these training centres have a particular interest in colonoscopy training, and it is noteworthy that the training intensity was reported as 237 and 409 colonoscopies per trainee per month—much higher than that found in our study. Our analysis has shown that intensity of training was a significant predictor of colonoscopy completion.
While Cusum analysis of the colonoscopy learning curve was first reported in 1991,10 few studies have made use of this methodology in the context of assessing colonoscopy competency.8 ,27 ,35 This is despite its widespread use in monitoring performance and outcomes throughout healthcare.24 ,36 We have demonstrated that trainees attain competency at different rates and therefore a method that provides near real time feedback on an individual's learning curve, namely the LC-Cusum chart, yields more information on progress than absolute numbers. The LC-Cusum approach can provide near real time visual assessment of the trainee's learning curve that can be fed back to the trainee, trainers and training bodies, and aid formative and summative assessments. Furthermore, the upper control limit provides an objective measure of when competency has been attained. The LC-Cusum method could also provide an objective assessment of the effectiveness of training interventions, such as the use of simulators, training the trainers and immersion training. However, the LC-Cusum is dependent on four parameters (p0, p1, type 1 and type 2 errors) and it falls to the training bodies to set these.21 There is no precedent for the value of p1 in the context of CIR monitoring. However, the value of p1 typically lies between two and five times the acceptable failure rate.22 ,23 Other studies making use of Cusum charts in the colonoscopy context have set the p1 value to 0.20,23 and in our study, we have provided supporting evidence that 0.20 appears to be an appropriate minimum, although further work is required to determine the optimum value. Trainees who have been deemed competent by the LC-Cusum method will be monitored to determine the CIR over their subsequent 100 procedures. The p1 standard will be defined as the largest value of p1 that ensures a CIR of ≥90% over the 100 procedures following LC-Cusum defined competence.
Moving average analysis avoids the problems of requiring parameters to be set, other than the CIR standard. However, a decision has to be made as to the number of procedures over which to average. In our study, we chose blocks of 20 so that the findings of our study were directly comparable with those recently published.14 This chart does not provide any individual feedback, like the LC-Cusum chart. Even though a moving average chart can be plotted using individual data, it does not provide real time feedback in the same way as the LC-Cusum chart because each data point is based on the most recent 20 procedures. Indeed, a fortunate clustering of 18 out of 20 successful procedures could signal that competency has been reached even though longer term consistency may not yet have been demonstrated. Nonetheless, the moving average method was useful in showing the group performance for all trainees. The ±2 SD boundaries show that typical individual moving average plots could fluctuate within quite wide boundaries by chance alone.
We have shown that colonoscopy completion was associated with the total number of procedures performed, the intensity of training and experience at flexible sigmoidoscopy. Intensive training in the form of a 1 week course has been shown to improve skills following the course, an effect that was sustained for 9 months.26 Our study found that breaks of 6 months or more from colonoscopy training had no significant effect on completion. This is consistent with the findings from a study comparing Cusum chart slopes of trainees following breaks from performing colonoscopy, where only small, if any, changes to the slope were noted.27 These results suggest that trainees should focus on maximising their exposure to colonoscopy during their endoscopy training while being less concerned about prolonged gaps from their training.
Our analysis showed that being a surgical trainee was associated with successful colonoscopy completion. All trainees are by definition in the early stages of their endoscopy training, and it was therefore surprising that a trainee's chosen specialty should affect their ability to complete a colonoscopy. Colonic resection is reportedly associated with increased completion rates,29 ,37 and it is possible that higher completion rates in surgical trainees may relate to an increased proportion of patients having had a prior bowel resection on surgical endoscopy lists compared with gastroenterology lists. We were unable to address this possibility as a history of colonic resection was not recorded in the JETS database.
We have demonstrated that patient age, gender and diagnosis were also associated with successful colonoscopy completion. This is consistent with other studies that have investigated factors affecting colonoscopy completion rates, albeit outside of the training context. Advancing age and female gender have been shown to be associated with incomplete colonoscopy by independent practitioners,37–39 as well as the presence of diverticular disease.29
An important training factor is the use of a magnetic imager, as this has shown to result in improved performance by trainees40 in terms of higher completion rates in a shorter time period. Unfortunately, the use of a magnetic imager was not routinely recorded in the JETS database, and we were therefore unable to assess the effects of this factor on completion.
One of the major limitations of this study is that colonoscopy completion was dependent on self-reported data. Trainees are required to accept an invitation from a hospital to be able to submit procedure data. The hospital endoscopy training lead and JETS administrator then have access to a trainee's data. When a trainee submits an e-portfolio for JAG certification, the training lead is required to validate the content of the e-portfolio. This allows for some validation of the data submitted. Furthermore, there was a strong correlation between trainee submitted data to the JETS e-portfolio and the local endoscopic reporting system, with small under-reporting, although this analysis was only possible using data from a small number of trainees (n=10).
Our study focused on CIR as one indicator of competence in performing colonoscopy. Our view is that it is the most important parameter in the context of supervised training. There are factors, in addition to CIR, that are critical to high quality colonoscopy: adenoma detection rate >10%; polyp recovery >90%; diagnostic colorectal biopsies for persistent diarrhoea in 100% cases; and appropriate tattooing. All of these measures assess the ‘performance’ of a colonoscopist. However, these factors are strongly influenced by the trainer who is present with the trainee at the time of the procedure. In the future, it is likely that a composite measure (including more than one measure of competency) will provide a more complete picture of colonoscopy performance. An alternative approach is to assess ‘competencies’ using competency frameworks such as the Mayo Colonoscopy Skills Assessment Tool (MSCAT)15 and the Direct Observation of Procedural Skills (DOPS).26 ,41 Trainers and assessors use these instruments to assess trainee competencies both to support training (formatively) and to determine overall competence (summatively). Although useful, the validity and reliability of these instruments to determine when a trainee is competent to practice independently are yet to be determined.42 ,43 Ultimately, it seems prudent to use a combination of assessment of performance and competency to assess fitness to practice independently.
In conclusion, this is the largest study to date investigating the number of procedures required to achieve competency in colonoscopy. Two statistical methods have been used, demonstrating that only 41% of trainees were competent after 200 procedures and that a mean CIR of 90% was reached after 233 procedures. Trainees accomplish competency at different rates, and the use of visual real time feedback tools, such as the LC-Cusum chart, gives more information on a trainee's progress than absolute numbers. Intensity of colonoscopy training and previous flexible sigmoidoscopy experience were independently associated with attaining competency, and it is possible that these could be exploited by training programmes. Trainees may wish to start learning flexible sigmoidoscopy before colonoscopy training and should aim to have periods of intense focused colonoscopy training, not being overly concerned about gaps in training.
Acknowledgments
The authors would like to acknowledge the help of Kevin Dowler who retrieved data from the JETS e-portfolio for use in this study, and Dr D J Biau for advising us on the implementation of LC-Cusum using R. We would also like to acknowledge all of the trainees who responded to the survey.
References
Supplementary materials
Supplementary Data
This web only file has been produced by the BMJ Publishing Group from an electronic file supplied by the author(s) and has not been edited for content.
Files in this Data Supplement:
- Data supplement 1 - Online supplement
Footnotes
-
Contributors Study concept: STW, MAM and PD. Study design: STW. Data acquisition: PD, RW and TI. Data/statistical analysis: STW and MAM. Manuscript preparation: STW. Manuscript review: PD, RW, TI and RV.
-
Competing interests None.
-
Provenance and peer review Not commissioned; externally peer reviewed.