Article Text

Abstract
Objectives The relevance of spatial composition in the microbial changes associated with UC is unclear. We coupled luminal brush samples, mucosal biopsies and laser capture microdissection with deep sequencing of the gut microbiota to develop an integrated spatial assessment of the microbial community in controls and UC.
Design A total of 98 samples were sequenced to a mean depth of 31 642 reads from nine individuals, four control volunteers undergoing routine colonoscopy and five patients undergoing surgical colectomy for medically-refractory UC. Samples were retrieved at four colorectal locations, incorporating the luminal microbiota, mucus gel layer and whole mucosal biopsies.
Results Interpersonal variability accounted for approximately half of the total variance. Surprisingly, within individuals, asymmetric Eigenvector map analysis demonstrated differentiation between the luminal and mucus gel microbiota, in both controls and UC, with no differentiation between colorectal regions. At a taxonomic level, differentiation was evident between both cohorts, as well as between the luminal and mucosal compartments, with a small group of taxa uniquely discriminating the luminal and mucosal microbiota in colitis. There was no correlation between regional inflammation and a breakdown in this spatial differentiation or bacterial diversity.
Conclusions Our study demonstrates a conserved spatial structure to the colonic microbiota, differentiating the luminal and mucosal communities, within the context of marked interpersonal variability. While elements of this structure overlap between UC and control volunteers, there are differences between the two groups, both in terms of the overall taxonomic composition and how spatial structure is ascribable to distinct taxa.
- COLONIC BACTERIA
- INFLAMMATORY BOWEL DISEASE
- INTESTINAL MICROBIOLOGY
- ULCERATIVE COLITIS
This is an Open Access article distributed in accordance with the Creative Commons Attribution Non Commercial (CC BY-NC 4.0) license, which permits others to distribute, remix, adapt, build upon this work non-commercially, and license their derivative works on different terms, provided the original work is properly cited and the use is non-commercial. See: http://creativecommons.org/licenses/by-nc/4.0/
Statistics from Altmetric.com
Video abstract
Significance of this study
What is already known on this subject?
UC is a condition with a spatial pattern affecting the distal colon predominantly but which can extend proximally to involve the whole colon.
UC results in mucosal inflammation with changes in the mucus gel layer and, in severe cases, ulceration of the colonic epithelium.
Changes in the microbiota have been described in both Crohn's disease and UC.
UC has been associated with increases in both mucosa-associated bacteria and mucolytic species.
What are the new findings?
By systematically sampling both the luminal and mucosa-associated microbiota across the colon, in UC and control volunteers, this study demonstrates spatial variation between the luminal and mucosal communities in both cohorts.
While there is overlap between the two cohorts, distinct bacterial groups are associated with this divide in UC.
How might this impact on clinical practice in the foreseeable future?
The ability to identify bacterial groups that are spatially disturbed in UC may influence the future use of microbial modulation in the treatment of this condition.
Introduction
While a large body of research has investigated the relationship of diet,1 ,2 disease,3 ,4 temporal change5 and host factors6 ,7 in relation to the gut microbiota, a detailed picture of the spatial ecology of the large intestine has been difficult to elucidate due to its inaccessibility to direct sampling. Recent studies have noted marked heterogeneity between mucosal sites within the colon with differences between stool samples and mucosal biopsy.8–10 While relatively homogenous when compared with the entire longitudinal axis of the GI tract, physiological differences are present within the colon, notably luminal changes associated with proximal colonic function as a bioreactor and fermenter of dietary polysaccharides, with corresponding longitudinal gradients in pH, water content, stool consistency and short-chain fatty acids.11 ,12 Physiologically, the luminal environment also differs from that of the mucosal surface, which is lined by the mucus gel layer, composed of a sterile inner layer and a loose outer layer of mucus that is densely colonised with the microbiota.13 ,14 Microbiologically, stool samples provide an unselected representation of microbial ecology that is not suitable for spatial ecological profiling.14 ,15 Finally, spatial patterns are evident in common diseases of the colon, including the distribution of colorectal cancer, UC and Crohn's disease.
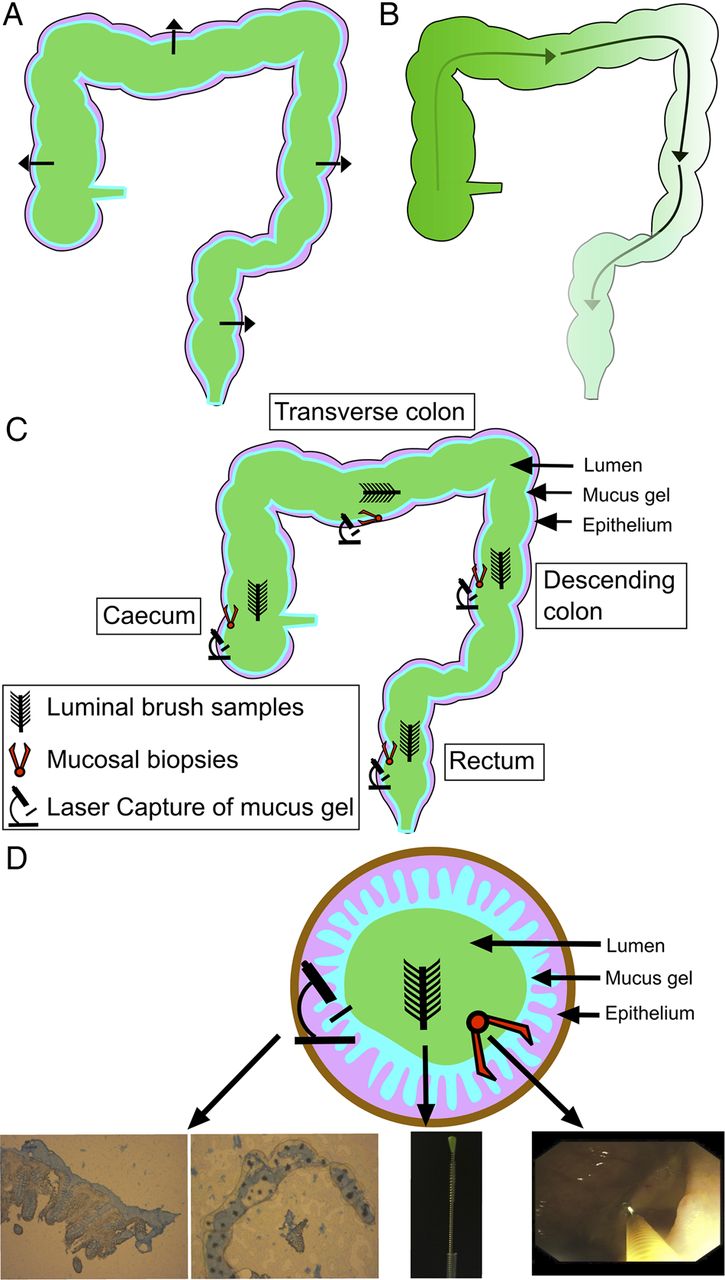
We have previously developed a technique for sampling the lumen-associated microbiota using protected specimen brushing in combination with mucosal biopsy and have demonstrated that it differs in composition when compared with the mucosal microbiota using the molecular fingerprinting technique T-RFLP.16 In the present study, we have combined protected specimen brushing with mucosal biopsy and laser capture microdissection (LCM) in control volunteers undergoing routine colonoscopy and patients with UC undergoing surgical colectomy to sample and deeply sequence the colonic microbiota at four colorectal levels, incorporating both the mucosal and luminal microbiota at each level, using the 16S rRNA marker gene (figure 1). The aims of our study were to determine how colonic ecology varies across multiple loci at a single time point within an individual and whether this spatial structure is conserved between individuals. Second, we wished to determine if the spatial structure of the microbiota, the degree of interpersonal variability or patterns in spatial variation differed between the colons of UC and control volunteers.

Schematic diagram of potential spatial gradients: (A) cross-sectional gradients and (B) longitudinal gradients. (C) Sampling occurred at four colorectal levels (caecum, transverse colon, descending colon and rectum). Three sampling layers were retrieved at each level (luminal, whole mucosal biopsy and mucus gel layer by laser capture microdissection). (D) A diagram of the cross-sectional organisation of samples with representative pictures from each sampling method.
Materials and methods
Patient recruitment
Ethical approval was obtained from St. Vincent's University Hospital Ethics and Medical Research Committee. Four control volunteers undergoing routine day case colonoscopy were recruited. Each gave informed, written consent prior to the procedure, was more than 18 years of age and had not taken antibiotics in the previous 3 months. Controls had no evidence of active pathology (table 1). Patients with a history of inflammatory bowel disease (IBD), colon cancer, colonic resection, or hospital admission in the previous 6 weeks, active bleeding or emergency endoscopy were excluded. Bowel preparations used were polyethylene glycol based. Individuals with UC were undergoing total colectomies for either medically-refractory UC or an acute severe flair of UC, unresponsive to intravenous hydrocortisone and biological therapy. All patients undergoing colectomy received a single dose of intravenous antibiotics at induction of anaesthesia but had not received antibiotics in the preceding 3 months.
Characteristics of study volunteers
Sample collection
Sampling levels were the caecum, transverse colon, descending colon and rectum (figure 1). Three samples of the microbiota were obtained at each of these levels: a luminal brush sample, a whole mucosal biopsy and a laser captured sample of the mucus gel layer. This gave a total of 12 samples for each individual.
In control volunteers, the luminal microbiota was sampled with a Microbiological Protected Specimen Brush (Hobbs Medical Inc, Stafford Springs, Connecticut, USA) as previously described.16 Mucosal biopsies were taken using a Radial Jaw three biopsy forceps (Boston Scientific, Natick, Massachusetts, USA). One biopsy was placed into a sterile, nuclease-free micro-centrifuge tube and frozen on dry ice, while the second was suspended in Tissue-Tek O.C.T. compound within Tissue-Tek Cryomolds (Sakura Fintek USA, Inc, USA) and snap-frozen for LCM.
A third mucosal sample was formalin-fixed and paraffin-embedded for histopathological assessment of inflammation. Eight micro metres sections were mounted onto plain glass slides and stained with Mayer's Haematoxylin followed by Eosin counter staining (Sigma Aldrich, Dublin, Ireland) in a Leica Autostainer XL (Leica Microsystems, Ashbourne, Ireland). All sections were scored by a pathologist according to a system previously described.17
In patients undergoing a colectomy, the colon was opened along the antimesenteric border and sampled immediately postremoval. Sterile, nuclease-free cytology brushes were used to sample the luminal microbiota while whole mucosal biopsies were retrieved using sterile tweezers and surgical scissors. Three whole mucosal biopsies were collected at each level and all samples were processed identically to those taken from control volunteers. DNA was extracted using the Qiagen DNA mini kit (Qiagen, Germany) as previously described.16 Briefly, for brush samples, the plug and the tip of the wire were dissociated using sterile wire cutters and placed in sterile, nuclease-free 1.5 mL micro-centrifuge tubes. DNA was extracted using a Qiagen DNA mini kit (Qiagen, Germany). An amount of 180 μl of buffer ATL was added along with 20 μL of proteinase K to each micro-centrifuge tube containing the sampling brush. This was vortexed vigorously for 1 min to dislodge adherent mucus, followed by pulse centrifugation and incubation at 56°C for 1 h.
Following brush removal, 200 μL of buffer AL was added, pulse vortexed and incubated at 70°C for 10 min. Finally, 100 μL of 100% molecular grade ethanol was added and the mixture loaded onto Qiagen columns (Qiagen, Germany) and processed as per manufacturer's instructions. The final eluate of DNA was in 200 μL of elution buffer.
Biopsy samples were processed in a similar manner using a Qiagen DNA mini kit. Samples were cut using a sterile blade and vigorously vortexed in 180 µL of buffer ATL and 20 µL of proteinase K and processed as described above. An extraction blank was used for each run, which was performed per patient. Extraction blanks were confirmed to be negative following PCR amplification of the V4 region of the 16S rRNA (see below), with all blank amplification values deemed negative if they were the same as non-template controls.
Laser capture microdissection
Snap-frozen biopsy samples were cryosectioned at 12 µm thickness (Leica CM3050 S, Leica Microsystems, Germany) at −25°C. Samples were placed on sterile, nuclease-free ARCTURUS PEN Membrane Slides (Applied Biosystems, Paisley, UK). Fresh blades were used for each sample to prevent carryover of bacterial DNA between samples and every component of the Leica cryosectioner used was removed prior to each sample being sectioned, cleaned and sterilised with 100% molecular grade alcohol followed by 30 min under direct ultraviolet light in a sterile fume hood to prevent contamination with environmental DNA. Following sectioning, samples were immediately fixed in ice-cold 70% molecular grade ethanol solution and stored in airtight containers at −80°C. Samples were transferred directly on dry ice and were removed and stained individually prior to LCM. The staining protocol used Alcian blue (Sigma-Aldrich), to stain the preserved mucous gel layer,18 which had been filter-sterilised prior to use and a counterstain with Mayer's Haematoxylin (Clin-Tech, UK). Laser capture isolated the closely adherent mucous gel layer and following approximately 80–100 targeted dissections (figure 1D), the caps were removed and the membrane from the cap placed in a sterile micro-centrifuge tube. DNA was extracted using an identical protocol to that for whole biopsy and brush samples.
Amplicon sequencing and bioinformatics analysis
The V4 region of the 16S SSU rRNA gene was amplified by PCR with universal primers; 520F (5′-AYTGGGYDTAAAG NG-3′) and 926R (5′-CCGTCAATTYYTTTRAGTTT-3′). In all, 25 unique barcoded sequences were used to allow pooling of separate samples on each plate. An amount of 65 ng of template DNA was used in each PCR reaction, along with 200 nM of each primer and 25 μL of BioMix Red (Bioline, London, UK). The PCR reaction conditions were as follows: initialisation and denaturation at 94°C for 2 min, followed by 30 cycles of denaturation (94°C for 1 min), annealing (52°C for 1 min) and extension (72°C for 1 min) and then an elongation step (72°C for 2 min). Sequencing was performed on a Roche 454 GS-FLX using Titanium chemistry by the Teagasc 454Sequencing Platform.19 Resulting reads were quality trimmed, clustered, aligned and checked for chimeras using the Qiime suite of tools.20 α And β diversities were estimated using Qiime and a phylogenetic tree was generated using the FastTree package.21 Principal coordinate analysis (PCoA) and hierarchical clustering based on unweighted Unifrac distances were also performed with Qiime. PCoA plots were visualised with KING.22 For taxonomic classification, trimmed reads were blasted against the SILVA 16S specific database (V.110). Resulting Blast outputs were parsed using MEGAN23 with a bit score cut-off of 86.
Statistical analysis
Significant differences in taxonomic abundance between groups were tested for using the Wilcoxon rank sum test. The unweighted UniFrac distance metric was used as an input to perform canonical analysis of principal coordinates (CAP).24
To model the distribution of the microbiota within individuals, an asymmetric Eigenvector map (AEM) analysis was performed.25 This spatial analytic technique was chosen as it explicitly models directional ecological processes, accounting for the faecal stream in the colon.26 A sampling map (see online supplementary figure S1) was created with a hypothetical upstream point from which a site-by-edges matrix is derived, upon which principal component analysis is performed (see online supplementary figure S1 for workflow and supplementary figure S2 for an illustrative example). The resulting AEM vectors are forward-selected into a redundancy analysis (RDA) to model species distribution. The adjusted R2 value was used to estimate the percentage of variance in taxonomic distribution explained by the model. To model the entire cohort in the context of the AEM framework, a between-class analysis (BCA) was also performed using Hellinger-transformed family-level abundances.27
To determine if taxonomic differences in the microbiota could be used to classify samples into different cohorts, a machine learning algorithm, Random Forests, was applied to family-level abundances.28 The Spearman rank correlation coefficient was used to assess the correlation between regional inflammation and diversity and regional inflammation and differences in the AEM analysis. A non-parametric Analysis of covariance (ANCOVA) was performed to assess if inflammation differently affected the luminal and mucosal microbiota. All statistical analyses were performed using R and associated packages.29–33
Results
Overall, 98 samples from nine individuals were analysed using amplicon sequencing yielding 3 069 310 reads (mean sequencing depth per sample 31 642 (SD 16 216), online supplementary table S1).
Spatial ecology
To determine if interpersonal variability was a significant component of the variance in our combined data set, CAP of unweighted unifrac distances was performed, demonstrating that the majority of explained variance in the combined cohort was due to interpersonal variability, with a much smaller proportion explained by the other measured spatial variables (figure 2). This was similar to the results of a BCA family-level abundance (see online supplementary figure S3).

Constrained ordination by canonical analysis of principal coordinates (CAP) using unweighted UniFrac distance of all samples in the cohort (A) demonstrating that interpersonal variability explains the largest proportion of the variance. (B) Percentage of CAP variance described by the constraining variables interpersonal, cross-sectional (luminal vs mucosal), colonic region (caecum, transverse colon, descending colon and rectum) and inflammation.
To model spatial ecology within individuals and look for conserved patterns of spatial structure, we performed an AEM analysis. A representative graph of sampling locations was created, with luminal samples incorporating a unidirectional flow, from the proximal to distal colon (see online supplementary figure S1). The results of this modelling explained a high proportion of the intrapersonal variance (42%–81%). Fitted RDA values were plotted in the corresponding colonic regions to graphically represent the results (figure 3). In control subjects, segmentation between the luminal and mucus gel microbiota was evident (figure 3A, B).
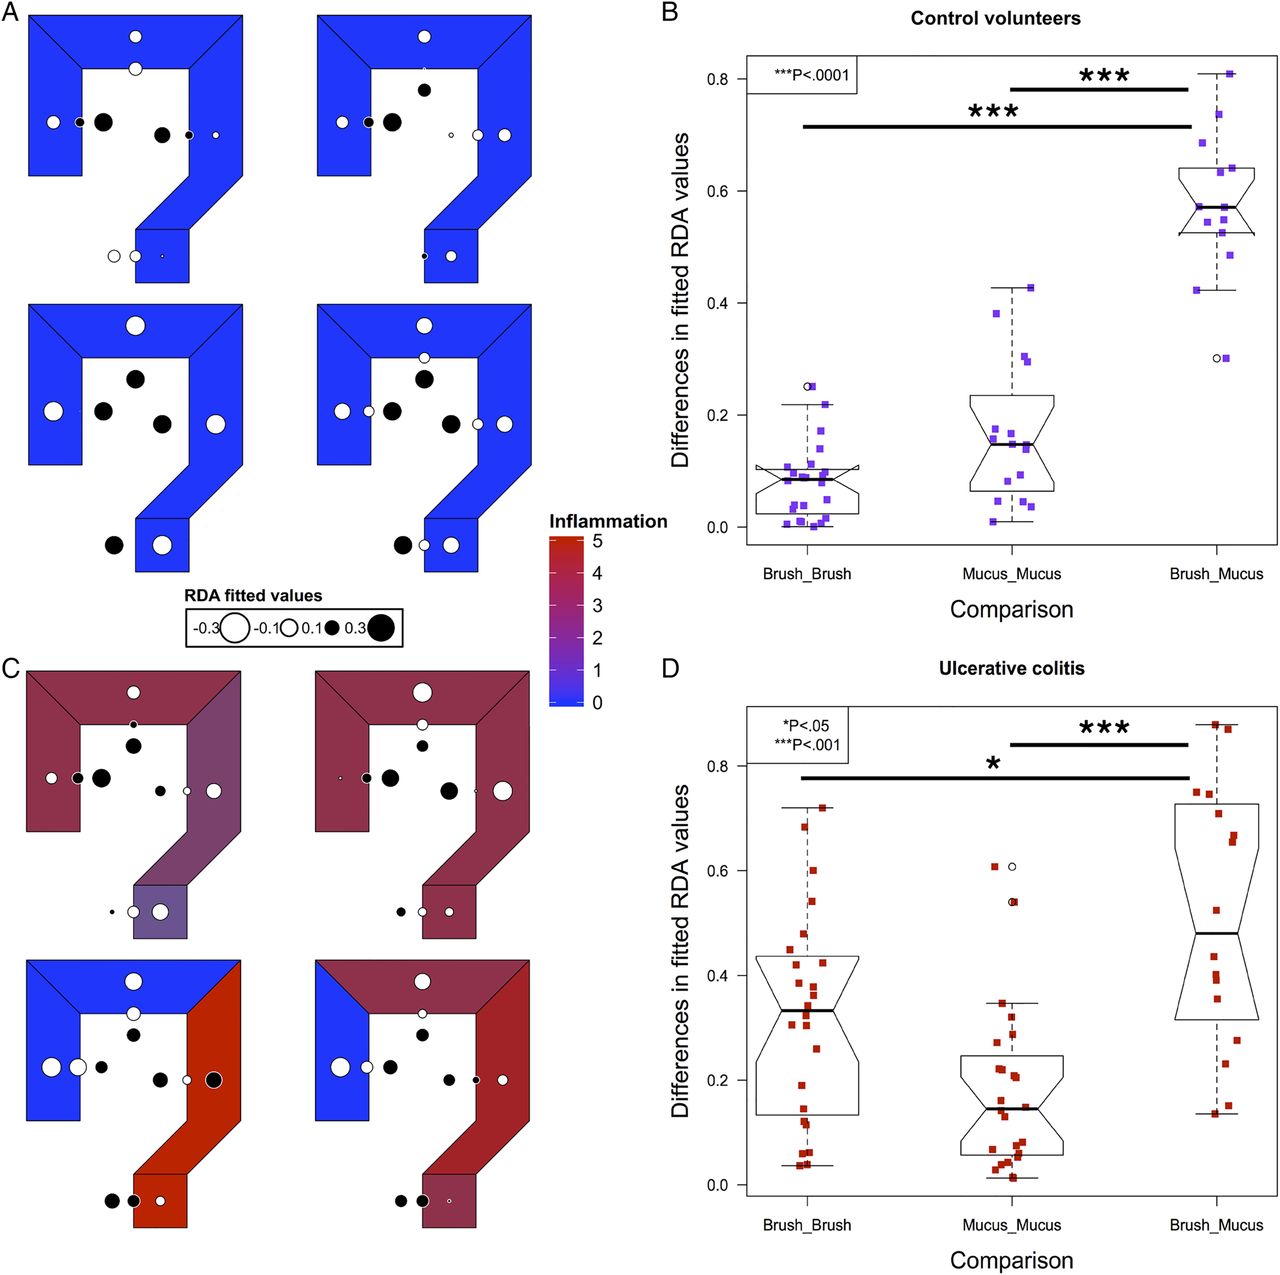
Modelling of intrapersonal variability by asymmetric Eigenvector maps analysis in the four control volunteers (A) and four out of five patients with UC (C). Values are centred at 0 with white corresponding to negative, black corresponding to positive and the radius of the circle corresponding to the magnitude of the value. The differences in the fitted redundancy analysis values for all luminal and mucus gel samples within an individual compared with brush versus mucus gel samples at matched locations within individuals, in controls (B) and UC (D), demonstrating that luminal samples are more similar to other luminal samples within individuals and mucus gel samples are more similar to mucus gel samples within individuals than luminal and mucus gel samples at each colorectal location. Significance values: *<0.05, ***<0.001.
In UC, four out of five individuals had the required number of samples to perform an AEM analysis (see online supplementary table S1). Inflammatory scores at each level and overall disease activity scores are presented in table 2. In all four of these individuals, the most significant variation also demonstrated segmentation between the luminal and mucus gel microbiota (figure 3C, D).
Inflammatory and disease activity scores in UC
Taxonomic analysis
To broadly characterise bacterial gradients between the luminal and mucosal environments, the mean abundance of each bacterial family was assessed across the whole cohort in luminal, mucosal and mucus gel samples. Samples were categorised as demonstrating either a high to low gradient from the lumen to mucosa, a high to low gradient from mucosa to lumen or no apparent gradient (see online supplementary figure S4). Those bacterial families that were significantly different across the three sampling layers by means of a Kruskal–Wallis test were additionally highlighted (see online supplementary table S2).
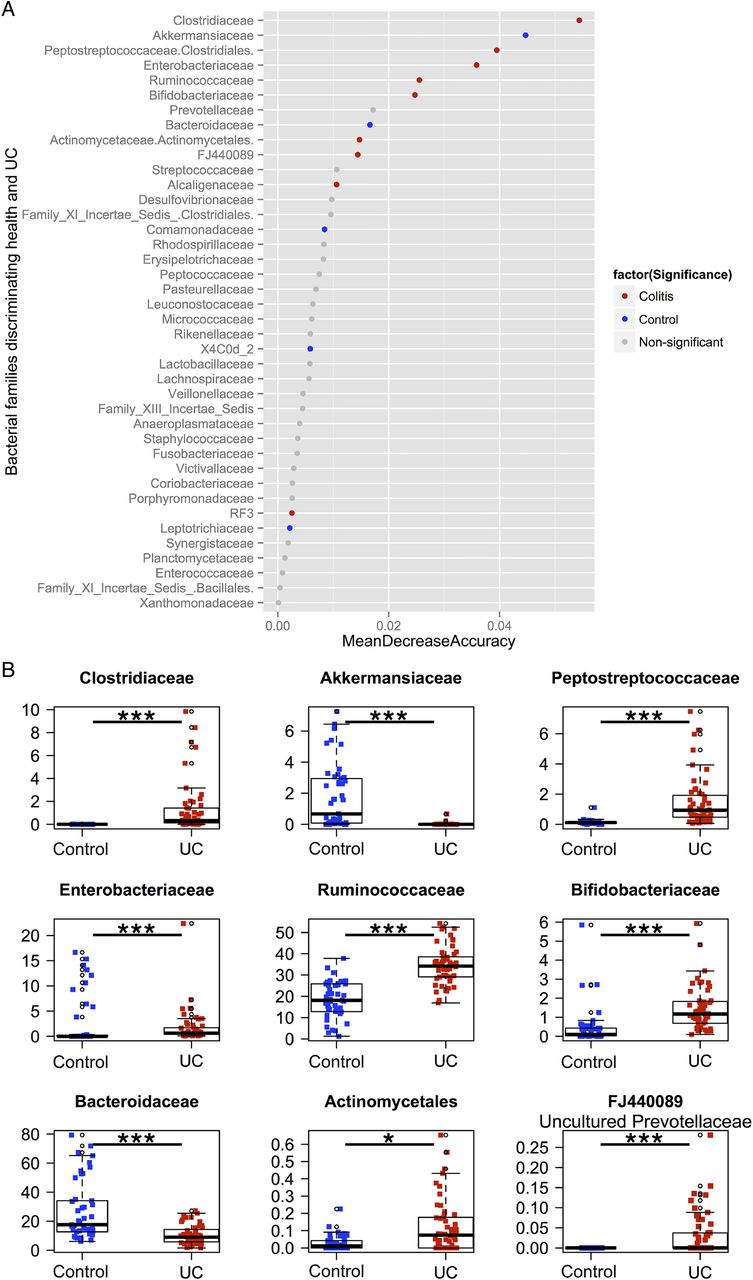
To determine if differential abundance in bacterial groups accounted for the observed separation between the two cohorts, relative abundances at the family level were compared between control volunteers and patients with colitis. Taxa were compared using the Wilcoxon rank sum test with a significance level of 5% after a Bonferroni correction for multiple comparisons. Samples were then ranked using the Z-score from the Wilcoxon test, from most abundant in controls to most abundant in UC (figure 4). To determine which families were most discriminatory between controls and colitis, we applied the machine-learning algorithm Random Forests to family level abundance data. Using a random sampling of a proportion of the whole cohort as a training set (approximately 40%) and testing the classifier on the remaining samples, the mean misclassification over 10 repeated runs was 1.8%, implying that the algorithm could correctly classify over 98% of samples based solely on family-level abundance as belonging to either controls or UC. Taxa that proved most discriminatory between the two cohorts were ordered according to the mean decrease in accuracy when removed from the analysis and compared, incorporating only those taxa with both discriminatory power and significance in terms of their Wilcoxon rank (figure 4). In controls, Bacteroidaceae and Akkermanseaceae were both significantly more abundant and highly discriminatory, while in UC, Clostridiaceae, Peptostreptococcaceae, Enterobacteriaceae, Ruminococcaceae, Bifidobacteriaceae, Actinomycetaceae and FJ440089, an uncultured member of the Prevotellaceae family, were both significantly more abundant and highly discriminatory (see online supplementary table S3 for family and table S4 for genus).

(A) Results from the Random Forests classifier, demonstrating bacterial families that are most discriminatory between the two cohorts in descending order. Samples are coloured by whether they are significantly increased in controls (blue), UC (red) or not (grey) using the Wilcoxon rank test with a Bonferroni correction for multiple comparisons. (B) Boxplots of the relative abundances of the nine bacterial families that were both discriminatory (with a mean decrease in accuracy of the classifier of greater than 0.01 when removed from the analysis) and significantly different in terms of abundance by the Wilcoxon rank test after a Bonferroni correction.
To determine the families that were differentially abundant between the lumen and mucus gel layer, a BCA was performed, which confirmed differentiation between luminal and mucosal samples in both controls and UC, with separation between the two cohorts (figure 5A). In both cohorts, Coriobacteriaceae, Bacteroideaceae, Ruminococcaceae and Family XIII Incertae sedis were differentially abundant between the lumen and mucus gel layer (figure 5B, C). In controls, Lachnospiraceae and Plancomycetaceae were both additionally significant, while in UC, Porphyromonadaceae, Bifidobacteriaceae, Veillonellaceae, Peptostreptococcaceae and Enterobacteriaceae were also differentially abundant (see online supplementary table S5a,b and figure S5). The Random Forests algorithm had a misclassification error for discriminating between the lumen and mucus gel microbiota of 3.45% for controls and 0.88% for UC.

Luminal versus mucus gel samples in controls and UC. A between-class analysis (BCA) based on a principal component analysis of Hellinger-transformed family-level taxon abundance, comparing the luminal, mucosal and mucus gel microbiota of controls and UC (A). Bacterial families that were discriminatory between the lumen and mucus gel in controls (B) and UC (C) based on the Random Forests classifier and abundance using the Wilcoxon rank test. Lachnospiraceae and Planctomycetaceae were unique to controls, while Porphyromonadaceae, Bifidobacteriaceae, Veillonellaceae, Peptostreptococcaceae and Enterobacteriaceae were unique to UC.
In addition, we applied the Random Forests classifier to both individuals and colorectal regions. While it performed extremely well at classifying individuals correctly (a mean out-of-bag error rate of 0.103%), it was unable to distinguish samples from the caecum, transverse colon, descending colon or rectum (mean misclassification error of 96%).
α Diversity and inflammation
Using the Shannon Diversity Index (H), there was no significant difference in diversity between samples from controls and those from UC for any sampling technique (see online supplementary table S6 and figure S6). This was also true for the choa1 estimator, Simpson's index and Faith's phylogenetic diversity (PD) for luminal and mucosal samples. Using two of the four diversity indices, there was however a significantly increased diversity in samples from the mucus gel layer in UC when compared with controls (chao1 estimator: 565.8 (IQR 412.5) in controls vs 1355.4 (IQR 780.8) in UC, p<0.001; PD 27.5 (IQR 15.4) in controls vs 43 (IQR 15.5) in UC, p<0.05).
In controls, there was no significant difference in diversity by any of the four metrics chosen between the different sampling techniques employed (luminal, whole mucosal biopsies or laser-capture dissected mucus gel) (see online supplementary table S6). In UC, there was similarly no difference by Simpson's index and the H, while there was again a significant difference using the chao1 estimator and PD.
To determine if regional inflammation altered the spatial structure of the microbiota, differences in RDA values from the AEM analysis between paired luminal and mucus gel samples were correlated with the degree of local inflammation. This analysis demonstrated no significant correlation between luminal-mucus segregation and the corresponding degree of inflammation (see online supplementary figure S7A). There was similarly no significant correlation between local inflammation and Shannon Diversity, in luminal, mucosal or mucus gel samples (see online supplementary figure S7B and table S7), a finding confirmed by CAP, with other variables factored out, illustrating that the direction of inflammation was orthogonal to that which separated the luminal and mucosal samples (see online supplementary figure S7C). Inflammation appeared to have a proportionally greater effect on the bacterial diversity of luminal samples than those from the mucus gel layer but this did not reach statistical significance when a non-parametric ANCOVA was performed.
Discussion
We show that interpersonal variation is the most important variable in the microbiota composition of the human distal gut when sampled across different locations. As with temporal stability, individuals remain more like themselves than others when sampled at multiple spatial points, indicating that any consideration of spatial or regional variance must be subject to a person's signature microbiota. As such, stool sampling, which clearly demonstrates interpersonal variability, captures this most significant component of variance. This was noted in both our control volunteers and also in patients with severe, medically-refractory UC.
Sampling each individual at multiple locations allowed us to look for conserved patterns of spatial variation, which interpersonal variability would otherwise overshadow, by modelling spatial variation within each individual separately (AEM) and comparing the results across individuals. AEM is a relatively new technique developed to model spatial processes in ecology, such as river networks or ocean currents, where directional flow is a driving force in community assemblage. Eigenvector techniques such as this specifically allow a spatial representation of the sampling grid, so that the model ‘knows’, for instance, that the caecum and transverse colon are adjacent to one another. More precisely, it creates a set of patterns that could fit the data, such as large-scale longitudinal or cross-sectional patterns, as well as small-scale patterns that represent local differences (see online supplementary figure S2 for illustrative example). Each spatial pattern is treated as a unique variable, assessed individually and as in other multivariate techniques, only those patterns that fit the data are kept. The fitted values of this analysis are presented graphically by circles, with negative values represented as white, positive values as black and the magnitude of each value by the area of the circle. Visually, spatial gradients are thus represented from black to white. Additionally, this method was suitable to our sampling grid as it allowed us to model the direction of flow within the colon. As outlined above, there are physiological, anatomical and pathological influences in our sampling set and we wished to incorporate as much of the captured variance as possible (figure 3). Our findings demonstrate a degree of segregation between the luminal and mucus gel microbiota, with whole mucosal biopsies, the traditional method of sampling the mucosal microbiota, lying in between the two methods. Taxonomic analysis identified a group of bacterial families that accounted for this differentiation in controls, with an additional five families important only in UC (Porphyromonadaceae, Bifidobacteriaceae, Veillonellaceae, Peptostreptococcaceae and Enterobacteriaceae). Interestingly, three of these five families (Bifidobacteriaceae, Peptostreptococcaceae and Enterobacteriaceae) were also among the bacterial families that discriminated between controls and UC (figure 4). The spatial differentiation between lumen and mucus gel in our UC patients thus overlaps with controls while having additional unique components. Due to the large degree of inflammation and ulceration in UC, the LCM samples of adherent microbiota may represent something closer to a biofilm than a healthy mucus gel layer.34 However, no direct correlation was observed between local inflammation and either the degree of segregation or microbial diversity, suggesting that the alterations observed in UC are more of a field effect and not exclusive to areas of severe inflammation (see online supplementary figure S7).
While our study was not powered to specifically distinguish taxonomic differences between controls and UC, numerous studies have previously looked at this question and our results are similar in terms of the reduction in Akkermansiaceae and the relative increase in members of Clostridiaceae and Enterococcaceae.4 ,35–37 The profound decrease in Akkermansiaceae is noteworthy as the bacterium Akkermansia muciniphila has recently been shown to protect against obesity and reduce intestinal inflammation while enhancing the colonic barrier and mucus gel layer.38 ,39 To attempt to correct for multiple sampling from the same individuals, we used the Random Forests classifier, a cutting-edge machine learning method that has previously been applied to microbiota research.7 This allowed us to weigh those bacterial families that were most discriminatory between the two cohorts, in order of their predictive power instead of simply relying on statistical significance of raw abundance. The ability of Random Forests to correctly discriminate selected groups mirrored closely the results of our other analyses, with the classifier performing almost perfectly at classifying individuals (interpersonal variability), very well for classifying controls versus UC and lumen versus mucus gel in both controls and UC, while performing extremely poorly at discriminating colorectal regions. As well as internally validating our findings, this allowed us to isolate those bacterial taxa responsible for the patterns observed in our spatial models.
Our study has a number of limitations. First, to sample extensively in control volunteers, we had to recruit from individuals undergoing a colonoscopy who had all taken a bowel preparation preprocedure. Patients undergoing colectomy in our institution do not routinely have bowel preparation preoperatively as has become the standard practice internationally. This difference may account for the reduced diversity seen in our control volunteers, as most research to date has noted a reduced diversity in IBD compared with controls. While this means that diversity cannot account for the differences between the two cohorts, it puts constraints on the direct comparison between the two groups. We feel however that this limitation does not overly effect our conclusions, as many of the taxonomic differences previously described between health and UC are evident within our study group. Also, work on new-onset IBD in paediatric patients suggests that the reduced diversity noted is confined to Crohn's disease and is not a feature of UC, at least in treatment naive patients.40 Finally, the numbers of patients in our study are small; however, to extensively sample and deeply sequence each sample, we wished to focus our efforts on a limited number. Reducing the number of sites would have reduced our ability to model the spatial variance completely, while reducing the sequencing depth would have reduced the taxonomic resolution and thus the robustness of our findings.
Conclusions
In our study, approximately half of the variance captured in the colonic microbiota was explained by interpersonal variability. Within individuals, differences were apparent between the luminal and mucosal compartments, while there was no evidence of longitudinal patterns in bacterial composition. At a taxonomic level, distinct bacterial taxa accounted for the differences between control volunteers and UC, as well as luminal and mucosal communities in both cohorts. While there was an overlap between the bacterial taxa that discriminated the luminal and mucosal communities in controls and UC, unique taxa had a spatial differentiation in UC.
Acknowledgments
The authors wish to thank Dr Paul Smith, Professor Orla Shields and Professor John O'Leary, Department of Histopathology, St. James’ Hospital, Dublin, for use of their LCM platform.
References
Supplementary materials
Supplementary Data
This web only file has been produced by the BMJ Publishing Group from an electronic file supplied by the author(s) and has not been edited for content.
Files in this Data Supplement:
- Data supplement 1 - Online figures
- Data supplement 2 - Online tables
Footnotes
Correction notice This article has been corrected since it published online first. The Open Access licence has now been added.
Contributors Conceived and designed the experiments: AL, GL, PRO, DCW, ND, JCC, KS, DO. Performed the experiments: AL, GL, OO, AB, AM. Analysed and interpreted the data: AL, GL, PRO, DCW, ND, JCC, FS, GD, HMM, JH, RPR, PDC. Contributed reagents/materials/analysis tools: JH, DO, HEM. Wrote the paper: AL, PRO.
Funding Provided by Science Foundation Ireland (grant no. 09/IN.1/B2606).
Competing interests None.
Patient consent Obtained.
Ethics approval St. Vincent's University Hospital, Elm Park, Dublin 4, Ireland.
Data Sharing Statement All data is available upon request.
Provenance and peer review Not commissioned; externally peer reviewed.