Article Text

Abstract
Objective The increasing prevalence of obesity and type 2 diabetes (T2D) demonstrates the failure of conventional treatments to curb these diseases. The gut microbiota has been put forward as a key player in the pathophysiology of diet-induced T2D. Importantly, cranberry (Vaccinium macrocarpon Aiton) is associated with a number of beneficial health effects. We aimed to investigate the metabolic impact of a cranberry extract (CE) on high fat/high sucrose (HFHS)-fed mice and to determine whether its consequent antidiabetic effects are related to modulations in the gut microbiota.
Design C57BL/6J mice were fed either a chow or a HFHS diet. HFHS-fed mice were gavaged daily either with vehicle (water) or CE (200 mg/kg) for 8 weeks. The composition of the gut microbiota was assessed by analysing 16S rRNA gene sequences with 454 pyrosequencing.
Results CE treatment was found to reduce HFHS-induced weight gain and visceral obesity. CE treatment also decreased liver weight and triglyceride accumulation in association with blunted hepatic oxidative stress and inflammation. CE administration improved insulin sensitivity, as revealed by improved insulin tolerance, lower homeostasis model assessment of insulin resistance and decreased glucose-induced hyperinsulinaemia during an oral glucose tolerance test. CE treatment was found to lower intestinal triglyceride content and to alleviate intestinal inflammation and oxidative stress. Interestingly, CE treatment markedly increased the proportion of the mucin-degrading bacterium Akkermansia in our metagenomic samples.
Conclusions CE exerts beneficial metabolic effects through improving HFHS diet-induced features of the metabolic syndrome, which is associated with a proportional increase in Akkermansia spp. population.
- Obesity
- Diabetes Mellitus
- Prebiotic
- Intestinal Permeability
- Intestinal Bacteria
Statistics from Altmetric.com
Significance of this study
What is already known on this subject?
-
American cranberry (Vaccinium macrocarpon Aiton), a fruit widely consumed in North America and an important source of polyphenols, is recognised as a promising strategy against the metabolic syndrome.
-
Cranberry exerts remarkable health-supporting effects, including anti-inflammatory and antimicrobial effects.
-
The gut microbiota composition plays a decisive role in energy homeostasis by modulating energy balance, glucose metabolism and the chronic inflammatory state associated with obesity-induced insulin resistance.
-
Increased proportion of the mucin-degrading species Akkermansia muciniphila has been linked to the protection from features of the metabolic syndrome.
What are the new findings?
-
Cranberry extract (CE) administration decreased diet-induced weight gain and visceral obesity, which was associated with lower hepatic, intestinal and plasma triglyceride accumulation, blunted inflammation and reduced oxidative stress.
-
CE administration improved insulin sensitivity, as revealed by ameliorated insulin tolerance, lower homeostasis model assessment of insulin resistance and decreased glucose-induced hyperinsulinaemia during an oral glucose tolerance test.
-
CE treatment prevented the high fat/high sucrose (HFHS)-induced increase in circulating lipopolysaccharide (ie, metabolic endotoxemia).
-
CE administration was associated with an important shift in the gut microbiota of mice by strikingly increasing the relative abundance of Akkermansia in CE-treated HFHS-fed animals.
How might it impact on clinical practice in the foreseeable future?
-
To date, this is the first report of a fruit extract exerting a major effect on the presence of Akkermansia in the intestinal microbiota of an animal model of diet-induced obesity.
-
Our findings provide strong evidence that nutritional manipulation of the gut microbiota by CE administration may improve metabolism in obese and type 2 diabetic patients.
-
Akkermansia may become an interesting biomarker for the positive impact of phytochemicals and other nutritional interventions for health.
Introduction
Type 2 diabetes (T2D) and cardiovascular diseases (CVD) are well-known consequences of a combination of pathological conditions defined as the metabolic syndrome, which comprises obesity, hyperglycaemia, glucose intolerance, dyslipidaemia, insulin resistance and hypertension.1 T2D is characterised by a complex interplay between genetic background and environmental influences, such as dietary habits, which leads to an insulin-resistant state.2–,4 The molecular mechanisms underlying insulin resistance and the onset of associated metabolic alterations are related to a low-grade subclinical inflammation, triggered by an increased release and action of proinflammatory cytokines, which can impede insulin receptor signalling in skeletal muscle, liver, intestine and adipose tissue.5–,10 Moreover, the intestinal epithelium, along with its colonising bacteria, represents a first site of interactions between diet and the host immune system. Such an interaction can impact on the composition of the gut microbiota,11 which in turn directly affects the gut-immune homeostasis and intestinal permeability.12 The intestine and its microbial flora are therefore a potential source of proinflammatory molecules that can affect whole-body metabolism, possibly representing an early event that precedes and predisposes to obesity and insulin resistance.13
Growing evidence supports that the gut microbiota plays a decisive role in energy homeostasis through modulating energy balance,14 ,15 glucose metabolism16–,18 and the chronic inflammatory state associated with obesity.16–,21 The gut microbiota-derived lipopolysaccharide (LPS), a potent inducer of inflammation, plays an important role in the onset and progression of inflammation and related metabolic diseases.17 For instance, high-fat diet intake has been shown to be associated with elevated portal and systemic circulating levels of LPS (ie, metabolic endotoxemia).17 ,22 These findings suggest a link between the gut microbiota-derived endotoxin and the pathogenesis of non-alcoholic fatty liver disease (NAFLD), thereby evidencing a key role for the intestinal microbiota as an orchestrator of the gut–liver axis. Metabolic endotoxemia is driven by increased intestinal permeability to LPS because of the disruption of the gut barrier function16 ,17 ,23 and/or enhanced LPS transport via chylomicrons particles in response to fat feeding.24 ,25
High-fat diet has been reported to reshape the gut microbiota, particularly by increasing the proportion of Firmicutes in relation to Bacteroidetes,22 ,26 which is thought to play a key role in the pathogenesis of obesity-induced metabolic diseases.16 ,19 ,27 Furthermore, growing evidence indicates that increased intestinal abundance of Akkermansia spp. can protect against obesity-linked metabolic syndrome28 and contributes to the beneficial metabolic effects of gastric bypass surgery and of the antidiabetic drug metformin.29 ,30 Akkermansia is a Gram-negative, strict anaerobe and mucin-degrading bacterium that lives in the mucus layer of the intestine and represents 1%–3% of the total gut microbiota.31 Despite steady advances in understanding the complex pathophysiology of metabolic disorders, obesity and T2D have grown to worrisome pandemic proportions, therefore urging the search for new therapeutic approaches.
American cranberry (Vaccinium macrocarpon Aiton) is an important source of phytochemicals, especially polyphenols,32 and is widely consumed in North America. Its high polyphenol content is related to an important antioxidant activity,33 ,34 which is particularly relevant in the context of the gastrointestinal physiology.35 Interestingly, cranberry proanthocyanidins (PAC) have been recently shown to improve the gut mucus layer morphology in mice.36 Moreover, cranberries are also related to anticarcinogenic,37 ,38 anti-inflammatory39–,41 and antimicrobial effects, the latter being mainly due to changes in the surface hydrophobicity and biofilm formation of P-fimbriated Escherichia coli, a species related to urinary tract infection.42 ,43 Interestingly, cranberry administration has been reported to ameliorate dyslipidaemia, hyperglycaemia and oxidative stress in individuals with the metabolic syndrome.44–,46 However, the underlying mechanisms of the beneficial effects of cranberry consumption remain largely unknown. The main goal of the present study was to define the metabolic influence of a cranberry extract (CE) on high fat/high sucrose (HFHS)-fed mice and to determine whether its potential health effects are related to the modulation of the gut microbiota.
Materials and methods
Animals
Eight-week-old C57Bl/6J male mice (n=36, Jackson, USA) were bred, two animals per cage in the animal facility of the Quebec Heart and Lung Institute. Animals were housed in a controlled environment (12 h daylight cycle, lights off at 18:00) with food and water ad libitum. After 2 weeks of acclimation (week 0 and week 1) on a normal chow diet (Teklad 2018, Harlan), mice were fed either a chow or a HFHS diet containing 65% lipids, 15% proteins and 20% carbohydrates. Animals were randomly divided into three groups of 12 mice, and one group (assigned as CE) received daily doses (200 mg/kg) of CE by gavage, whereas the other two groups (assigned as chow and HFHS) received the vehicle (water). Faeces were collected by the end of weeks 0, 1, 5 and 9 for subsequent metagenomic analysis (see online supplementary figure S1). Body weight gain and food intake were assessed twice a week. After 8 weeks of HFHS feeding, animals were anesthetised in chambers saturated with isoflurane and then sacrificed by cardiac puncture. Blood was drawn in EDTA-treated tubes and immediately centrifuged in order to separate plasma from cells. Subcutaneous and visceral fat pads were carefully collected along with gastrocnemius muscle, liver and intestine. All procedures were previously approved by the Laval University Animal Ethics Committee.
Cranberry extract
Cranberry powdered extract was obtained from Nutra Canada (Quebec, Canada). Its phenolic characterisation is shown in table 1. CE was diluted in water at a concentration of 40 mg of CE powder per mL. The detailed methodology used to perform the phenolic characterisation of the CE is described in the online supplementary methods.
Chemical characterisation of cranberry extract
Glucose homeostasis
At week 7, animals were 6 h fasted and an insulin tolerance test (ITT) was performed after an intraperitoneal injection of insulin (0.75 UI/kg body weight). Blood glucose concentrations were measured with an Accu-Check glucometer (Bayer) before (0 min) and after (5, 10, 15, 20, 25, 30 and 60 min) insulin injection. At the end of week 8, mice were fasted overnight and an oral glucose tolerance test (OGTT) was performed after gavage with glucose (1 g/kg body weight). Blood was collected before (0 min) and after (15, 30, 60, 90 and 120 min) glucose challenge for glycaemia determination. Additionally, blood samples (∼30 μL) were collected at each time point during OGTT for Insulinaemia and C-peptide determination.
Analytical methods
Plasma insulin and C-peptide concentrations were measured using an ultrasensitive ELISA kit (Alpco, Salem, USA). The homeostasis model assessment of insulin resistance (HOMA-IR) index was calculated based on the following formula: fasting insulinaemia (μUI/mL)×fasting glycaemia (mM)/22.5. Liver and jejunal triglyceride (TG) as well as cholesterol content was assessed after chloroform–methanol extraction and enzymatic reactions with commercial kits (Randox Laboratories, Crumlin, UK). Phospholipids were measured by the Bartlett technique as described previously.47 Lipid peroxidation was estimated by measuring the production of free malondialdehyde (MDA) in jejunal and hepatic tissues using high-performance liquid chromatography with fluorescence detection as described previously.10 ,48 Briefly, proteins were first precipitated with a 10% sodium tungstate solution (Sigma). The protein-free supernatants were then reacted with an equivalent volume of 0.5% (wt/v) thiobarbituric acid solution (Sigma) at 95°C for 60 min. After cooling to room temperature, the pink chromogene thiobarbituric acid 2-MDA was extracted with 1-butanol and dried over a stream of nitrogen at 37°C. The dry extract was then resuspended in a potassium dihydrogen phosphate-methanol mobile phase (70:30, pH 7.0) before MDA determination. For the assessment of the endogenous antioxidant defence, tissue samples were homogenised in a buffer (50 mM Tris-HCl and 0.1 mM EDTA-Na2 pH 7.8), centrifuged at 10 000 g for 5 min at 4°C and the supernatants were collected. The activities of superoxide dismutase (SOD) and glutathione peroxidase (GPx) were determined as described previously.10 Total SOD activity was determined as described by McCord and Fridovich49 while SOD2 activity was examined in the presence of sodium diethyldithiocarbamate (1 mM) that allows defining the contribution of MnSOD activity. For GPx activity, hepatic or jejunal tissue homogenates were added to a phosphate buffered saline buffer (pH 7.0) containing 10 mM GSH, 0.1 U of G-Red and 2 mM NADPH with 1.5% H2O2 to initiate the reaction. Absorbance was monitored every 30 s at 340 nm for 5 min. Plasma LPS concentration was determined using a kit based on a Limulus amebocyte extract (LAL kit endpoint-QCL1000, Lonza, Switzerland).
Metagenomic analysis
The methods used to analyse the bacterial taxonomic profiles of the murine gut microbiome are described in the online supplementary methods.
Statistical analyses
Data are expressed as mean±SEM. Statistical analysis was performed using one-way analysis of variance (ANOVA) with a post hoc Bonferroni multiple comparison test (GraphPad, USA). Body weight gain and energy intake curves were statistically compared using two-way repeated measures ANOVA with a Student–Newman–Keuls post hoc test (Sigmaplot, USA). All results were considered statistically significant at p<0.05.
Results
Effects of CE on body weight gain, plasma lipid profile and liver homeostasis
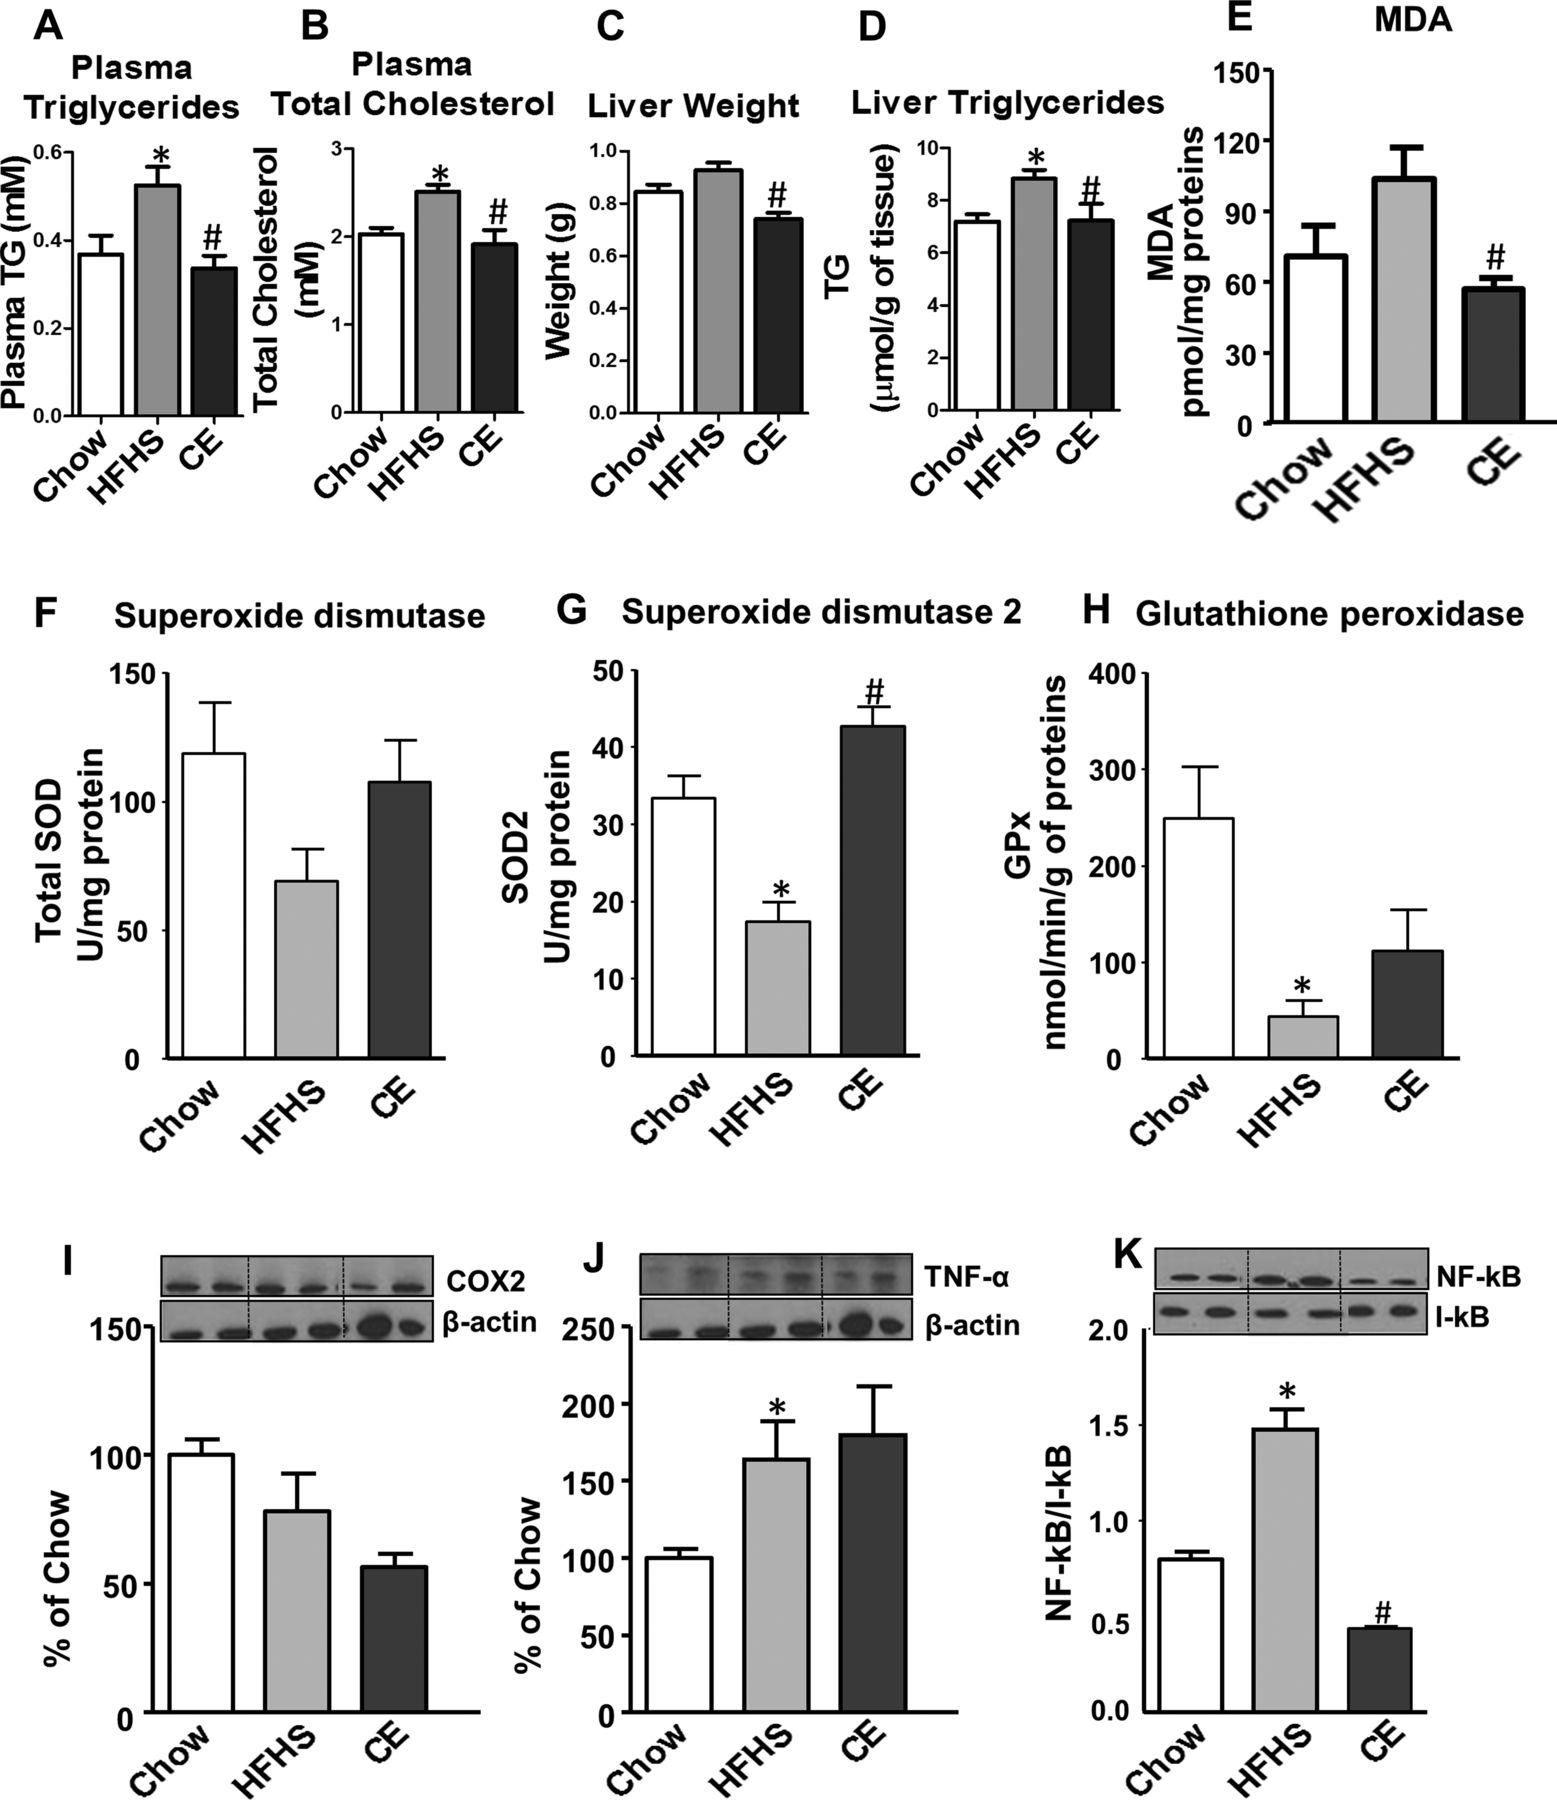
As depicted in figure 1A, B, CE administration to HFHS-fed animals prevented weight gain and this effect was seen as early as 7 days post-CE treatment. Although this was associated with a small reduction in total energy intake, this effect became significant only from the 24th day onwards (figure 1C, D). Additionally, CE administration to HFHS-fed mice significantly reduced the ratio of weight gain/energy intake in comparison with untreated HFHS animals (figure 1G), suggesting that the preventive effect of CE on weight gain is mostly related to a decrease in energy efficiency. Interestingly, the CE-induced effect on weight gain was particularly evident in visceral adipose tissue (figure 1E), whereas no significant difference in subcutaneous fat mass was found between HFHS-fed control mice and CE-treated animals (figure 1F). Moreover, CE administration reduced liver weight (figure 2C) while concomitantly lowering hepatic TG accumulation (figure 2D) and ameliorating HFHS-induced hypertriglyceridaemia (figure 2A) and hypercholesterolaemia (figure 2B) in these animals. CE also decreased liver oxidative stress as indicated by a complete prevention of HFHS-mediated MDA (figure 2E) and by improvements of antioxidant defence mechanisms, as revealed by restoration of SOD2 (figure 2G) along with a tendency to improve GPx (figure 2H) and SOD (figure 2F) activity in the liver of HFHS-fed mice. Inflammation was also decreased in the liver of CE-treated HFHS-fed mice, as revealed by normalisation of the transcription factor NFκB/IκB ratio (figure 2K). This was not explained by reduced tumour necrosis factor (TNF)-α levels in the liver (figure 2J), whereas COX2 protein synthesis was neither affected by the dietary or CE treatments (figure 2I).

Effects of cranberry extract (CE) administration on body composition. Mice were fed either a chow or a high-fat/high sucrose (HFHS) diet for 8 weeks. HFHS-fed animals were treated with daily oral doses of CE (200 mg/kg). Chow and HFHS fed control mice were gavaged with vehicle (water). (A) Weight gain curves; (B) total weight gain; (C) energy intake curves; (D) total energy intake; (E) visceral (F) subcutaneous fat mass and (G) energy efficiency (ie, ratio between body weight gain and energy intake). n=11–12 (A, B, E and F); n=6–7 (D and E). Data are expressed as the mean±SEM. *p<0.05 versus chow controls; #p<0.05 versus HFHS controls.

Effect of cranberry extract (CE) administration on plasma and liver lipid profiles, hepatic inflammation and oxidative stress. CE administration to high fat/high sucrose (HFHS)-fed mice prevented diet-induced increase in plasma triglycerides (A) and total cholesterol (B), whereas liver weight (C) and hepatic triglyceride accumulation (D) were reduced after CE treatment. Moreover, CE decreased liver oxidative stress as indicated by a complete prevention of HFHS-mediated malondialdehyde (MDA) levels (E) and by improvements of antioxidant defence mechanisms, as revealed by restoration of superoxide dismutase(SOD2) (G) and a tendency to improve glutathione peroxidase (GPx) (H) and SOD (F) activity in the liver of HFHS-fed mice. A trend towards lessening cyclooxygenase-2 protein expression (I) and a significant reduction in the NFκB/IκB ratio (K) were found after CE treatment. CE administration did not affect TNF-α protein synthesis (J) in the liver. n=11–12 (A–D); n=6–7 (E-K). Data are expressed as the mean±SEM. *p<0.05 versus chow controls; #p<0.05 versus HFHS controls.
Impact of CE on diet-induced insulin resistance
We next determined the impact of CE treatment on glucose homeostasis and insulin sensitivity. Although CE-treated HFHS-fed mice did not display improved fasting glycaemia, these animals showed significant lower fasting insulinaemia compared with untreated HFHS-fed animals (figure 3A, B), suggesting that CE improved insulin sensitivity in these animals. We next performed insulin and OGTTs in order to further examine the effect of CE on insulin sensitivity and glucose homeostasis. CE-treated HFHS mice displayed improved insulin sensitivity in comparison to HFHS controls as revealed by ITTs (figure 3C, D). Although CE administration did not improve HFHS-induced glucose intolerance (figure 3E, F), the lower plasma insulin and C-peptide levels measured during the OGTTs further confirmed that CE treatment improves insulin sensitivity (figure 3G, J). This conclusion is also supported by the lower HOMA-IR index values of the CE-treated HFHS-fed mice compared with their vehicle-treated HFHS controls (figure 3K).

CE administration increases insulin sensitivity, alleviates diet-induced hyperinsulinaemia and improves insulin resistance in HFHS-fed mice. Mice were 12 h fasted for fasting glycaemia (A) and fasting insulinaemia (B) determination. Mice were 6 h fasted and an insulin tolerance test (C) was performed after an intraperitoneal injection of insulin (0.75 UI/kg body weight). (D) Area under the curve for insulin tolerance tests. Animals were fasted overnight (12 h) and an oral glucose tolerance test (E) was performed after gavage with glucose (1 g/kg body weight). (F) Area under the curve for OGTTs. Blood samples were collected at each time point during OGTT for insulinaemia (G and H) and C-peptide (I and J) determination. (K) HOMA-IR index. n=11–12 (A, E and F); n=7–8 (B–D, G–K). Data are expressed as the mean±SEM. *p<0.05 versus chow controls; #p<0.05 versus HFHS controls. MDA, malondialdehyde; GPx, glutathione peroxidase; CE, Cranberry extract; HFHS, high fat/high sucrose; OGTT, oral glucose tolerance test; HOMA-IR, Homeostasis model assessment of insulin resistance; ITT, insulin tolerance test.
Influence of CE administration on diet-induced intestinal inflammation and metabolic endotoxemia
Diet-induced obesity has been previously reported to cause metabolic endotoxemia, oxidative stress and low-grade inflammation that is associated with increased intestinal permeability, as revealed by elevated circulating LPS levels.16 ,17 In accordance with previous studies, 8 weeks of HFHS feeding produced a twofold increase in circulating LPS, which was fully prevented by CE administration (figure 4A). This finding was associated with a CE-induced reduction in jejunal TGs (figure 4B). To further assess the impact of CE administration on intestinal oxidative stress and inflammation, we investigated lipid peroxidation and the expression of key inflammatory modulators in the jejunum of chow, HFHS and CE-treated HFHS animals. No significant changes were noted in MDA and SOD among groups (figure 4C, D). However, CE treatment was found to prevent the decrease in SOD2 activity by HFHS (figure 4E) without any effects on GPx (figure 4F). Importantly, CE administration fully prevented HFHS diet-induced intestinal inflammation, as evidenced by the reduced COX2 and TNF-α protein expression as well as by the normalisation of NFκB/IκB ratio (figure 4G, E).

Cranberry extract (CE) administration reduced circulating lipopolysaccharide (LPS) and ameliorated oxidative stress and inflammation in the jejunum. CE-treated mice displayed reduced circulating LPS levels in comparison with untreated high fat/high sucrose (HFHS)-fed mice (A). Jejunal triglyceride accumulation (B) were lessened in CE-treated mice; however, no changes were detected in malondialdehyde (MDA) levels (C). CE administration increased SOD2 activity (E), whereas SOD (D) and glutathione peroxidase (GPx) (F) activities were unchanged after CE treatment. Cylooxygenase-2 (G) and TNF-α (H) protein expression, as well as the NFκB/IκB ratio (I), were significantly reduced in CE-treated mice as compared with HFHS controls. n=6–7 (A–I). Data are expressed as the mean±SEM. *p<0.05 versus chow controls; #p<0.05 versus HFHS controls.
Effects of CE administration on the gut microbiota
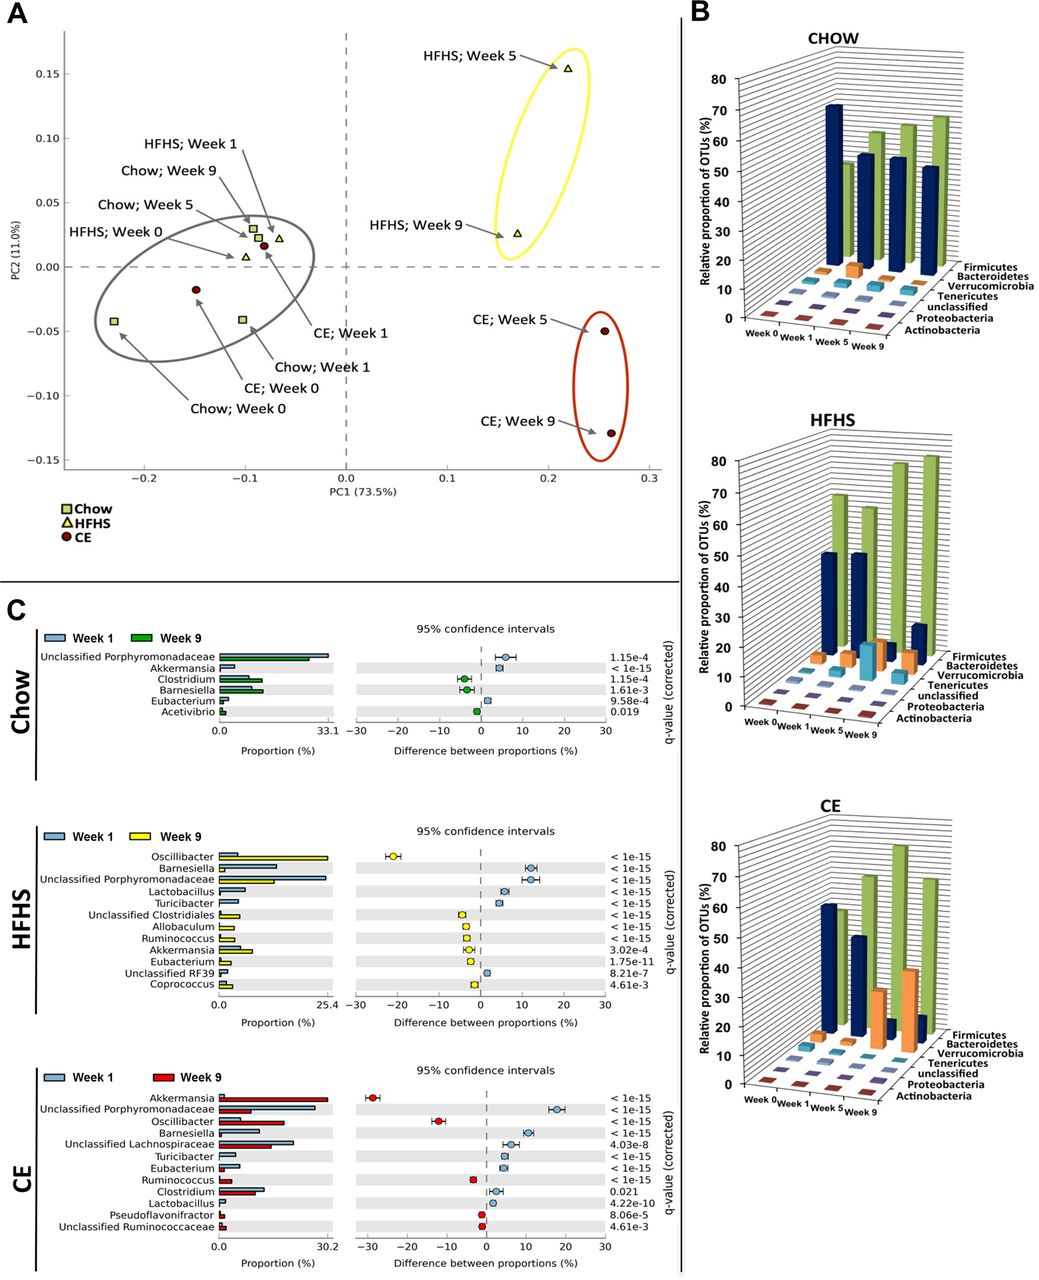
The overall composition of the bacterial community in the different groups was assessed by analysing the degree of bacterial taxonomic similarity between metagenomic samples at the genus level. Bacterial communities were clustered using principal component analysis (PCA), which distinguished microbial communities based both on diet/treatment and time of faecal sampling (weeks 0, 1, 5 and 9). As shown in figure 5A, PCA disclosed that distinct diets promoted the main alterations in the gut microbiota of mice. From week 5 onwards, chow-fed mice metagenomes clustered very distinctly from those of HFHS-fed animals. On the other hand, after 5 and 9 weeks of CE administration, samples from CE-treated HFHS-fed mice formed a cluster that was different from metagenomes derived from untreated HFHS-fed animals. These results indicate that CE administration had a substantial effect on the gut microbial composition of HFHS-fed mice. Further analysis at the phylum level revealed that the proportion of sequences assigned to Firmicutes was significantly increased in metagenomes of HFHS-fed animals, whereas reads assigned to Bacteroidetes were reduced in these samples. A similar trend observed for the Bacteroidetes phylum in metagenomes from untreated HFHS-fed animals was found in samples from CE-treated HFHS-fed mice. Furthermore, the relative abundance of Verrucomicrobia was significantly higher at week 9 compared with week 1 in metagenomes of CE-treated mice (figure 5B and see online supplementary figure S2). Finally, pretreatment with CE (ie, 1 week before day 0 of HFHS feeding, see online supplementary figure S1) was not associated with specific changes in the baseline metagenome (week 1) of CE mice compared with untreated groups (see online supplementary figure S4).

Metagenomic analysis. Faeces were harvested at the end of the two first weeks of adaptation (week 0 and week 1), when all groups were pre-fed a chow diet. Faeces were also collected at the end of week 5 and week 9, representing respectively 4 and 8 weeks of high fat/high sucrose (HFHS) feeding for HFHS and cranberry extract (CE) mice. Chow animals were fed a normal chow diet throughout the study (see online supplementary figure S1 for further details). (A) Principal component analysis (PCA) of gut microbiota metagenomes. The PCA analysis focus on grouping sampled faecal communities with respect to diet/treatment (chow, HFHS, CE) and time of stool sampling (weeks 0, 1, 5, or 9) using principal components. This plot shows the degree of bacterial taxonomic similarity between metagenomic samples at the genus level; the closer the spatial distance between samples, the more similar they are with respect to both axes (PC1 and PC2). Chow: green dots; HFHS: yellow triangles; CE: red squares. Samples with the highest taxonomic similarity are clustered together and illustrated in the plot by a grey circle. Samples representing the most dissimilar bacterial communities in comparison with the cluster of metagenomes included in the grey circle are identified by a yellow (HFHS) or red (CE) circle. (B) Relative abundance distribution of operational taxonomic unit (OTU) sequences (97% level). Percentages of total OTU sequences taxonomically assigned to bacterial phyla from faecal metagenomes of chow, HFHS or CE mice at weeks 0, 1, 5 and 9. (C) Statistical comparisons of gut metagenomic profiles at the genus level. Plots showing significant differences in abundance of reads assigned to a given bacterial genus between week 1 and week 9 for chow, HFHS and CE diets. The bar graphs on the left side display the mean proportion of sequences assigned to each genus. The dot plots on the right side display the difference in mean proportions between week 1 and week 9 with associated q-value. Error bars on both sides of dots represent the 95% CIs. Only features (genus) with a q-value of >0.05 and a difference between proportions value >1 were considered.
The HFHS diet-induced rise in the relative abundance of Firmicutes was mostly explained by an increase of reads assigned to species from the genus Oscillibacter (figure 5C), whereas the decreased proportion of Bacteroidetes found at week 9 was associated with a reduction in sequences assigned to the Barnesiella genus and other unclassified members of the Porphyromonadaceae family. Importantly, CE administration was associated with a striking 30% increase in the relative abundance of Akkermansia in the CE-treated mice metagenome at week 9 (figure 5C).
Discussion
There is growing evidence that the consumption of fruits and plant-derived foods is inversely correlated with several features of the metabolic syndrome, thus reducing the risk of T2D and CVD.50– 53 Despite the positive health effects possibly arising from the presence of vitamins, minerals and dietary fibres in fruits, there is a growing body of literature now supporting a key role for polyphenols in the protection against obesity-related diseases.54 ,55 Given that cranberry is one of the fruits with the highest phenolic content,56 which includes a remarkable amount of PAC,32 ,57 we have elected to explore its impact on several components of the metabolic syndrome. We found that CE administration prevents HFHS-induced weight gain and reduced visceral adiposity. Moreover, the effect on weight gain was observed before any difference in caloric intake was noticed and was mostly linked to reduced energy efficiency. CE gavage fully prevented the development of fatty liver disease, as revealed by reduced TG accumulation and blunted hepatic inflammation, which was associated with restoration of antioxidant defence mechanisms. These preventive effects on visceral obesity and liver steatosis were associated with improved insulin sensitivity, as revealed by lower fasting and postglucose insulinaemia, improved insulin tolerance and a lower HOMA-IR index in CE-treated HFHS-fed mice. Glucose tolerance per se was not improved by CE treatment, but this may be explained by the high glucose challenge during the OGTT, which is quite important as compared with the glucose load generated by a complex meal, thus possibly overwhelming the ability of the tissues to uptake more glucose, even in the context of an improved insulin sensitivity.
Phenolic phytochemicals are generally poorly absorbed, and this has been put forward to suggest that these compounds are possibly acting primarily at the level of intestinal absorption.58 ,59 Furthermore, several reports have demonstrated that the gut microbiota has a causal role in the pathogenesis of obesity and T2D.12 ,28 ,30 ,60 This prompted us to investigate the impact of CE administration on the gut microbiota in the present study. Our results show that HFHS feeding induced a dramatic shift in the gut microbiota of mice by increasing the proportion of Firmicutes and decreasing the proportion of Bacteroidetes. This diet-induced reshape in the microbial community of HFHS-fed mice is a typical characteristic of obesity-driven dysbiosis and is in agreement with previous publications,11 ,60–62 as was the finding of an increased presence of the genus Oscillibacter in obese mice.63
The beneficial effects of CE treatment on metabolic phenotypes were associated with a robust modulation in the relative abundance of Akkermansia spp., as suggested by the higher representation (30%) of reads assigned to this genus in CE metagenome at week 9 in comparison with week 1. To the best of our knowledge, this is the first report of a fruit extract exerting such a major effect on the presence of Akkermansia in the intestinal microbiota of an animal model of diet-induced obesity. Interestingly, administration of green tea polyphenols to high-fat-fed mice has also been recently associated with an increase in the proportion of Akkermansia,64 whereas Kemperman et al65 showed that complex polyphenols from black tea and from a grape juice/red wine mixture, in the context of a simulator of the human intestinal microbial ecosystem (ie, SHIME), increased the relative proportion of Akkermansia. Moreover, the metabolic benefits of gastric bypass surgery and of the antidiabetic drug metformin have been also linked to an increased intestinal abundance of this bacterium.29 ,30 We found that the CE-mediated increase in the relative abundance of Akkermansia was associated with the prevention of the HFHS-induced rise in circulating LPS and abrogation of intestinal inflammation in these animals. Although we have not directly established the causal relationship between CE-induced increase in the relative proportion of Akkermansia population and the improved features of the metabolic syndrome in CE-treated HFHS-fed mice, it has been already reported that oral administration of Akkermansia (ie, as a probiotic) reverses high-fat-diet-induced metabolic disorders28 and could also mimic the antidiabetic effects of metformin in diabetic mice.30 Importantly, our results further suggest that the CE-related increase in Akkermansia population might be sufficient to prevent the negative metabolic phenotype associated with obesity-driven dysbiosis without major modifications in the proportions of Firmicutes and Bacteroidetes.
Hepatic TG accumulation is a measure of steatosis, which in combination with oxidative stress and inflammation may lead to NAFLD, the most important cause of liver disease in Western countries that usually develops in the setting of insulin resistance and obesity.66 LPS derived from the gut microbiota reaches the portal circulation and thus can access the liver to affect host metabolic physiology in critical ways.67 Elevated levels of circulating LPS in obese individuals have been shown to be a consequence of nutrient overload and high-fat-induced changes in the gut microbiota.17 Furthermore, metabolic endotoxemia (ie, increased circulating LPS after an obesogenic diet) is explained by the transport of LPS from the gut lumen by newly synthesised chylomicrons from enterocytes in response to fat feeding24 ,25 and by a gut microbiota-dependent disruption of the gut barrier, thus favouring LPS leakage.16 ,17 ,23 Interestingly, besides the fact that Akkermansia uses mucins as a food supply, it seems to be crucial for the mucus layer integrity.28 ,68 Akkermansia administration as a probiotic was reported to reduce systemic LPS levels in high-fat-fed mice, which is possibly associated with the ability of Akkermansia to preserve the mucus layer thickness, therefore reducing gut permeability and LPS leakage.28 Taken together, these observations suggest that CE, by increasing the presence of Akkermansia, may reduce intestinal permeability and LPS leakage, therefore ameliorating insulin resistance in diet-induced obese mice. Accordingly, the ability of CE to blunt circulating LPS levels may be accounted for the reduced hepatic TG accumulation and protection from hepatic oxidative stress and inflammation in HFHS-fed mice.
Intestinal inflammation is growingly recognised to play a major role in the early deterioration of glucose and lipid metabolism in models of obesity and insulin resistance.13 Remarkably, CE administration was found to completely suppress NFκB activation in the intestine of HFHS-fed mice. NFκB is a central regulator of metabolic inflammation and controls the production of several proinflammatory cytokines, including TNF-α. CE treatment reduced the amount of TNF-α in the intestine and also decreased COX2 protein expression, an enzyme crucial for the synthesis of several proinflammatory molecules. Additionally, CE administration was found to increase the activity of SOD2, suggesting that it could exert some of its effects through promoting oxidant defence mechanisms in the intestine. It has been suggested that interactions between diet and enteric bacteria are necessary for inducing inflammatory changes in the intestine and to impact on diet-induced obesity and insulin resistance.13 Therefore, our observations suggest that CE treatment, acting as a prebiotic, may be a novel strategy against intestinal inflammation and the prevention of the metabolic syndrome.
The mechanisms by which phenolic phytochemicals may exert prebiotic effects and reshape the gut microbiota with benefits to the host are still unclear. It has been suggested that Akkermansia can display a rapid growth rate in order to monopolise the resources when competition is low following an important ecological disruption (eg, gastric bypass surgery, caloric restriction, antibiotic therapy).69 CE is very rich in polyphenols, particularly phenolic acids, flavan-3-ols (eg, catechin, epicatechin) and PAC (table 1). These molecules have been shown to possess remarkable antibacterial activity43 ,70 ,71 and can potentially reshape the gut microbiota ecology of obese mice. One explanation is that this latter effect could be associated with a reduction in the abundance of species capable of holding Akkermansia in check, thus favouring a rise in its proportion. In fact, a polyphenol extract of wine and grapes stimulated the growth of Akkermansia while exerting profound antimicrobial activity in the transversal colon of a gut biofermentor model.65 Moreover, this hypothesis is supported by the fact that broad-spectrum antibiotic treatment increases the proportion of Akkermansia in humans.72 Another explanation is that CE, through their high PAC content, influences the production of mucin and thereby provides ample trophic resources for Akkermansia to thrive. Indeed, cranberry PAC have been shown to increase the differentiation of goblet cells and to preserve the production of luminal mucin 2 (Muc2) in mice fed through elemental enteral nutrition, a treatment known to decrease the mucosal barrier.36 Conversely, we found that CE administration is associated with increased Kruppel-like factor 4 (Klf4)—a marker of goblet cells—and Muc2 mRNA expression in the proximal colon (see online supplementary figure S3), which supports the hypothesis that these condensed tannins are able to stimulate mucus production and therefore create an ecological niche for the mucus-eating bacterium Akkermansia. Importantly, since it has been reported that Akkermansia administration per se can re-establish the mucus layer integrity in diet-induced obese mice,28 it is possible that a direct trophic effect of CE on Akkermansia precedes the positive effects found on the mucus layer integrity. Finally, Akkermansia contributes to the restoration of antimicrobial peptides such as regenerating islet-derived protein 3 γ (RegIIIγ).28 Although our results did not show a statistically significant modulation of Reg3g by CE treatment, we did observe a trend for modulation of this antimicrobial marker that would suggest that CE stimulates the induction of antimicrobial defences, which is possibly linked with higher Akkermansia muciniphila abundance in these animals. Further investigations are definitely warranted in order to better understand the prebiotic effects of CE on Akkermansia.
The use of Akkermansia as a probiotic in humans, although a promising strategy, may find some barriers. For instance, besides the fact that the safety of Akkermansia administration to humans is currently unknown, its in vitro culture is technically complex and time-consuming, suggesting that the production of Akkermansia as a commercial-scale probiotic may be costly. Therefore, finding alternative methods to increase the presence of Akkermansia spp. in the gut microbiota seems a valid, safe and likely more cost-effective approach. In addition, given the fact that cranberries are already highly consumed (especially in North America), using CE as a prebiotic might be an interesting strategy to ease adherence to the treatment compared with the introduction of a novel probiotic strain. Moreover, the dose used in this study in mice may represent a feasible dose in humans. By applying the US Food and Drug Administration's guidelines to establish the human equivalent dose based on body surface area,73 we found that a 16 mg/kg dose would be the human equivalent of a 200 mg/kg dose in mice. This is perfectly achievable by supplementation or by incorporating CE in other food products.
While our study provides evidence for the beneficial metabolic effects of CE treatment, some limitations must be acknowledged. First, while we have found that the CE treatment improves insulin sensitivity, based on ITT analysis, HOMA-IR and fasting and postglucose insulin levels, future studies that use the euglycemic clamp technique together with isotopic tracers could be performed to further confirm this effect of CE and to determine the contribution of the liver and peripheral tissues to this phenotype. Moreover, we acknowledge that the pooling of samples used to analyse the metagenomic bacterial diversity of the mice constitutes another limitation of this study, but allowed us to focus on the shifts occurring within the dominant phylotypes due to the different treatments.
In summary, we found that CE treatment protects from diet-induced obesity, liver steatosis and insulin resistance in HFHS-fed mice. This effect was associated with alleviation of metabolic endotoxemia and intestinal inflammation. Our study further suggests that the ability of CE administration to raise the relative proportion of Akkermansia is playing a key role in this protective effect, leading us to propose that fruit polyphenols may prevent obesity and the metabolic syndrome through a prebiotic effect on the gut microbiota.
Acknowledgments
We thank André Comeau and Brian Boyle (Plate-forme d'Analyses Génomiques, IBIS/Université Laval) for expert guidance in pyrosequencing and subsequent data filtering analysis. We are grateful to Émilie Desfossés-Foucault for helping in the early-stage analyses of metagenomic sequences, especially with the construction of figure plots. We thank Valérie Dumais, Christine Dion, Christine Dallaire and Kim Denault for their expert help with animal experimentations.
References
Supplementary materials
Supplementary Data
This web only file has been produced by the BMJ Publishing Group from an electronic file supplied by the author(s) and has not been edited for content.
Files in this Data Supplement:
- Data supplement 1 - Online supplement
- Data supplement 2 - Online figures
- Data supplement 3 - Online tables
Footnotes
-
Contributors AM, DR, EL, YD, GP and FFA designed the study. FFA, TV, SD, SM, CG and QM performed the experiments. FFA, GP, AM, DR, YD, EL, SM and TV analysed the data and wrote the manuscript. All authors reviewed and approved the final manuscript.
-
Funding This work was funded by grants from the Ministère du Développement Économique, de l'Innovation et de l'Exportation (MDEIE, PSR-SIIRI-444 ) and Agence Universitaire de la Francophonie (AUF) to AM and by the Institute of Nutrition and Functional Foods (INAF, Laval University) to YD, AM, DR and EL.
-
Competing interests AM was the holder of a Canadian Institutes of Health Research (CIHR)/Pfizer research Chair in the pathogenesis of insulin resistance and cardiovascular diseases and EL holds a J.A. deSève Research Chair in nutrition. The authors thank Leahy Orchards and AppleActiv for their support to EL. FFA is the recipient of a PhD studentship from the CIHR training programme in obesity.
-
Ethics approval Laval University Ethics Committee.
-
Provenance and peer review Not commissioned; externally peer reviewed.