Article Text

Abstract
Objective A decade of microbiome studies has linked IBD to an alteration in the gut microbial community of genetically predisposed subjects. However, existing profiles of gut microbiome dysbiosis in adult IBD patients are inconsistent among published studies, and did not allow the identification of microbial signatures for CD and UC. Here, we aimed to compare the faecal microbiome of CD with patients having UC and with non-IBD subjects in a longitudinal study.
Design We analysed a cohort of 2045 non-IBD and IBD faecal samples from four countries (Spain, Belgium, the UK and Germany), applied a 16S rRNA sequencing approach and analysed a total dataset of 115 million sequences.
Results In the Spanish cohort, dysbiosis was found significantly greater in patients with CD than with UC, as shown by a more reduced diversity, a less stable microbial community and eight microbial groups were proposed as a specific microbial signature for CD. Tested against the whole cohort, the signature achieved an overall sensitivity of 80% and a specificity of 94%, 94%, 89% and 91% for the detection of CD versus healthy controls, patients with anorexia, IBS and UC, respectively.
Conclusions Although UC and CD share many epidemiologic, immunologic, therapeutic and clinical features, our results showed that they are two distinct subtypes of IBD at the microbiome level. For the first time, we are proposing microbiomarkers to discriminate between CD and non-CD independently of geographical regions.
- INTESTINAL BACTERIA
- INFLAMMATORY BOWEL DISEASE
This is an Open Access article distributed in accordance with the Creative Commons Attribution Non Commercial (CC BY-NC 4.0) license, which permits others to distribute, remix, adapt, build upon this work non-commercially, and license their derivative works on different terms, provided the original work is properly cited and the use is non-commercial. See: http://creativecommons.org/licenses/by-nc/4.0/
Statistics from Altmetric.com
Video abstract
Significance of this study
What is already known on this subject?
Microbiome in Crohn's disease (CD) is associated with a reduction of faecal microbial diversity and plays a role in its pathogenesis.
Faecalibacterium prausnitzii and Escherichia coli, in particular, were found decreased and increased, respectively, in CD.
No clear comparison between dysbiosis in CD and in UC has been performed.
Longitudinal study of the intestinal microbiome in adult patients with IBD has also been poorly investigated in large cohorts.
What are the new findings?
Dysbiosis is greater in CD than in UC, with a lower microbial diversity, a more altered microbiome composition and a more unstable microbial community.
Different microbial groups are associated with smoking habit and localisation of the disease in CD and UC.
Eight groups of microorganisms including Faecalibacterium, an unknown Peptostreptococcaceae, Anaerostipes, Methanobrevibacter, an unknown Christensenellaceae, Collinsella and Fusobacterium, Escherichia could be used to discriminate CD from non-CD; the six first groups being in lower relative abundance and the last two groups in higher relative abundance in CD.
How might it impact on clinical practice in the foreseeable future?
Considering CD and UC as two distinct subtypes of IBD at the microbiome level could help designing specific therapeutic targets.
The microbial signature specific to CD combined with either imaging techniques or calprotectin data could help decision-making when the diagnosis is initially uncertain among CD, UC and IBS.
Introduction
CD and UC, the two main forms of IBD with a similar annual incidence (10–30 per 100 000 in Europe and North America), have both overlapping and distinct clinical pathological features.1 Given that these conditions do not have a clear aetiology, diagnosis continues to be a challenge for physicians. Standard clinical testing to diagnose CD and UC includes blood tests and stool examination for biomarker quantification, endoscopy and biopsy. The diagnosis of IBD, particularly CD, can be missed or delayed due to the non-specific nature of both intestinal and extra-intestinal symptoms at presentation. In this regard, non-invasive, cost-effective, rapid and reproducible biomarkers would be helpful for patients and clinicians alike.
Dysbiosis, which is an alteration of the gut microbial composition, has been reported in IBD over the last 10 years.2–5 Patients with IBD, in particular patients with CD, are associated with a lower microbial α-diversity and are enriched in several groups of bacteria compared with healthy controls (HC). Using faecal samples and culture-independent techniques, including qPCR, T-RFLP, cloning/Sanger, pyrosequencing or Illumina sequencing, several studies have reported that CD is associated with a decrease in Clostridiales such as Faecalibacterium prausnitzii and an increase in Enterobacteriales such as Escherichia coli.6–8 Patients with UC are associated to some extent with a decrease in microbial diversity; however, no strong dysbiosis has been reported compared with healthy controls or patients with CD.5 Although many studies have revealed a clear association between an altered microbiome and IBD, they have not addressed the differences between CD and UC at the microbiome level nor have proposed a set of biomarkers that is useful for diagnosis based on stool samples.9
To deeply characterise the microbiome of UC and CD, we combined 669 newly collected samples with 1376 previously sequenced ones, thus building one of the largest cohorts covering sequence data generated from four countries (Spain, Belgium, the UK and Germany). Our findings reveal that CD and UC are two distinct intestinal disorders at the microbiome level. We also developed and validated a microbial signature for the detection of CD.
Methods
Study design
We performed a cohort study (Spanish IBD cohort) to identify microbial biomarkers for CD and validated the outcome with several other published and unpublished studies: a Belgian CD cohort, a Spanish IBS cohort, a UK healthy twin cohort and a German anorexic cohort. The Belgian CD cohort was part of an unpublished study, whereas the other cohorts were from published research. For the Spanish IBD and Belgian CD cohorts, the protocols were submitted and approved by the local Ethical Committee of the University Hospital Vall d'Hebron (Barcelona, Spain) and of the University Hospital Gasthuisberg in Leuven (Belgium), respectively. All volunteers received information concerning their participation in the study and gave written informed consent.
Study population
To study differences in the microbiome composition between IBD and healthy subjects and between inactive and active disease (remission vs recurrence), 34 patients with CD and 33 patients with UC were enrolled for a follow-up study in the Spanish cohort. Inclusion criteria were a diagnosis of UC and CD confirmed by endoscopy and histology in the past, clinical remission for at least 3 months—defined by the validated colitis activity index (CAI) for UC and the CD activity index (CDAI) for CD,10 stable maintenance therapy (either amino-salicylates, azathioprine or no drug) and previous history of at least three clinical recurrences in the past 5 years. HC were without previous history of chronic disease. At inclusion and during the follow-up (every 3 months), we collected diagnostic criteria, location and behaviour of CD, extension of UC, and clinical data including tobacco use and medical treatment. Clinical recurrence was defined by a value of 4 or higher for CAI and higher than 150 for CDAI. Blood samples were collected to assess ESR, the blood cell count and CRP. Exclusion criteria included pregnancy or breast-feeding, severe concomitant disease involving the liver, heart, lungs or kidneys, and treatment with antibiotics during the previous 4 weeks. A total of 415 faecal samples for microbiome analysis were collected from 178 participants (111 HC and 67 patients with IBD) at various time points (table 1). Patients with CD and UC who showed recurrence during the study also provided a stool sample at the time of recurrence.
Baseline clinical characteristics of the patients with CD and UC
In the Belgian prospective cohort, 54 patients with CD undergoing curative ileocecal resection of the diseased bowel were included at the University Hospital Leuven. Originally, patients with CD were enrolled before ileocecal resection in order to study early triggers of inflammation and to unravel the sequence of events before and during the development of early inflammatory lesions. A total of 187 faecal samples were collected at four time points before and during the postoperative follow-up period (baseline, 1, 3 and 6 months after surgery) for microbiome analysis. Baseline characteristics are shown in table 1.
Faecal microbiome analysis
Sample collection and genomic DNA extraction
Faecal samples collected in Spain and Belgium were immediately frozen by the participants in their home freezer at −20°C for the Spanish cohort and cooled (maximum 24 hours) for the Belgian cohort and later brought to the laboratory in a freezer pack, where they were stored at −80°C. Genomic DNA was extracted following the recommendations of the International Human Microbiome Standards (IHMS; http://www.microbiome-standards.org).11 A frozen aliquot (250 mg) of each sample was suspended in 250 µL of guanidine thiocyanate, 40 µL of 10% N-lauroyl sarcosine, and 500 µL of 5% N-lauroyl sarcosine. DNA was extracted by mechanical disruption of the microbial cells with beads, and nucleic acids were recovered from clear lysates by alcohol precipitation. An equivalent of 1 mg of each sample was used for DNA quantification using a NanoDrop ND-1000 Spectrophotometer (Nucliber). DNA integrity was examined by micro-capillary electrophoresis using an Agilent 2100 Bioanalyzer with the DNA 12 000 kit, which resolves the distribution of double-stranded DNA fragments up to 17 000 bp in length.
High-throughput DNA sequencing
For profiling microbiome composition, the hyper-variable region (V4) of the bacterial and archaeal 16S rRNA gene was amplified by PCR. On the basis of our analysis done using Primer Prospector software,12 the V4 primer pairs used in this study were expected to amplify almost 100% of the bacterial and archaeal domains. The 5′ ends of the forward (V4F_515_19: 5′- GTGCCAGCAMGCCGCGGTAA -3′) and reverse (V4R_806_20: 5′- GGACTACCAGGGTATCTAAT -3′) primers targeting the 16S gene were tagged with specific sequences as follows: 5′-{AATGATACGGCGACCACCGAGATCTACACTATGGTAATTGT}12 {GTGCCAGCMGCCGCGGTAA}-3′ and 5′-{CAAGCAGAAGACGGCATACGAGAT} {Golay barcode} {AGTCAGTCAGCC} {GGACTACHVGGGTWTCTAAT}-3′. Multiplex identifiers, known as Golay codes, had 12 bases and were specified downstream of the reverse primer sequence (V4R_806_20).13 ,14
Standard PCR (0.15 units of Taq polymerase (Roche) and 20 pmol/μL of the forward and reverse primers) was run in a Mastercycler gradient (Eppendorf) at 94°C for 3 min, followed by 35 cycles of 94°C for 45 s, 56°C for 60 s, 72°C for 90 s and a final cycle of 72°C for 10 min. Amplicons were first purified using the QIAquick PCR Purification Kit (Qiagen, Barcelona, Spain), quantified using a NanoDrop ND-1000 Spectrophotometer (Nucliber) and then pooled in equal concentration. The pooled amplicons (2 nM) were then subjected to sequencing using Illumina MiSeq technology at the technical support unit of the Autonomous University of Barcelona (UAB, Spain), following standard Illumina platform protocols.
Sequence data analysis
For microbiome analysis, we first loaded the raw sequences into the QIIME 1.9.1 pipeline, as described by Navas-Molina et al.14 The first step was to filter out low quality sequence reads by applying default settings and a minimum acceptable Phred score of 20. Correct primer and proper barcode sequences were also checked. After filtering, from a total of 2206 faecal samples, we obtained a total of 115.5 millions of high-quality sequences with a number of reads ranging from 1 to 223 896 per sample. We used the USEARCH15 algorithm to cluster similar filtered sequences into Operational Taxonomic Units (OTUs) based on a 97% similarity threshold. We then identified and removed chimeric sequences using UCHIME.16 Since each OTU can comprise many related sequences, we picked a representative sequence from each one. Representative sequences were aligned using PyNAST against Greengenes template alignment (gg_13_8 release), and a taxonomical assignment step was performed using the basic local alignment search tool to map each representative sequence against a combined database encompassing the Greengenes and PATRIC databases. The script make_phylogeny.py was used to create phylogenetic trees using the FastTree programme.17 To correctly define species richness for the analysis of between-sample diversity, known as β diversity, the OTU table was rarefied at 6760 sequences per sample and kept for further analysis a total of 2045 samples and 115.5 millions of reads. Rarefaction is used to overcome cases in which read counts are not similar in numbers between samples. The summarise taxa table was used to classify taxa from the Domain to the Species level. To provide community α diversity estimates, we calculated the Chao1 and Shannon diversity indexes.18 ,19 To calculate between-sample diversity, weighted and unweighted UniFrac metrics were applied to build phylogenetic distance matrices, which were then used to construct hierarchical cluster trees using Unweighted Pair Group Method with Arithmetic mean and Principal Coordinate Analysis (PcoA) representations.
Statistical analyses
Statistical analyses were carried out in QIIME and in R. To work with normalised data, we analysed an equal number of sequences from all groups. The Shapiro-Wilk test20 was used to check the normality of data distribution. Parametric normally distributed data were compared by Student's t-test for paired or unpaired data; otherwise, the Wilcoxon signed rank test was used for paired data and the Mann-Whitney U test for unpaired data. The Kruskal-Wallis one-way test of variance21 was used to compare the mean number of sequences of the groups, that is, that of different groups of patients based on distinct parameters with that of HC, at various taxonomic levels. The Friedman test was used for one-way repeated measures of analysis of variance. We used the mixed-analysis of variance (ANOVA), a mixed-design ANOVA model, to take into account that repeated measurements are collected in a longitudinal study in which change over time is assessed. We performed analyses with the non-parametric multivariate ANOVA (NPMANOVA) called the adonis test, a non-parametric analysis of variance, to test for differences in microbial community composition. We applied Multivariate Association with Linear Models to find associations between clinical metadata (age, body mass index (BMI), gender, smoking habits, medication intake and site of disease) and microbial community abundance. When possible, the analysis provided false discovery rate (FDR)-corrected p values. FDR<0.05 considered significant for all tests.
Faecal calprotectin assay
Faecal calprotectin (FC) was measured as a marker of intestinal inflammation in a subset of the Spanish participants using a commercial ELISA (Calprest; Eurospital SpA, Trieste, Italy), following the manufacturer's instructions. Optical densities were read at 405 nm with a microplate ELISA reader (Multiskan EX; Thermo Electron Corporation, Helsinki, Finland). Samples were tested in duplicate, and results were calculated from a standard curve and expressed as μg/g stool.
Validation of the microbiomarkers
Investigators interested in testing our algorithm on their own patient cohort and unable to apply by themselves the described method are invited to contact us using our dedicated email (cdmicrobiomarkers@gmail.com) to have their data processed.
Results
CD more dysbiotic than UC
To characterise the microbial community of IBD we enrolled 178 participants (40 HC non-related to the patients, and 34 patients with CD and 33 patients with UC, and 36 and 35 healthy relatives (HR) of the patients with CD and UC, respectively) in a longitudinal study (discovery cohort). HR were patients' first-degree relatives. However, information on whether they were living in the same house as the patients at the time of sampling was not available. Non-related HC provided a faecal sample at a single time point, whereas HR provided two samples within a 3-month interval. Patients with UC and CD in remission provided samples at 3-month intervals over a 1-year follow-up. When the patients with IBD developed recurrence, they provided a faecal sample at the onset. During the 1-year follow-up, 13 patients with CD (38%) and 18 patients with UC (54%) developed recurrence. A total of 415 samples were collected for microbiome analysis.
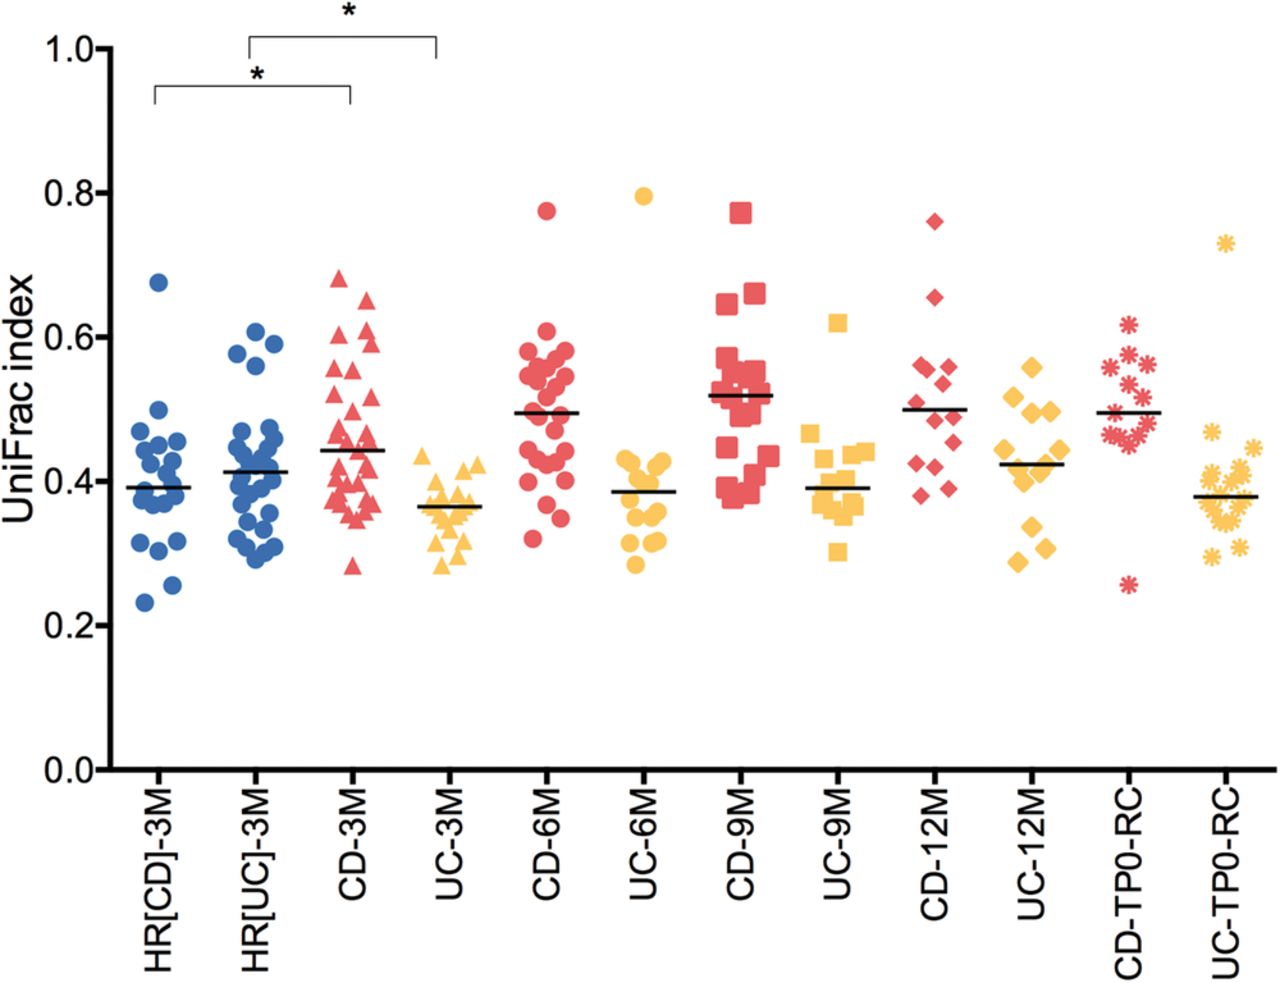
Using the weighted UniFrac distance, a metric used for comparing microbial community composition between samples, we evaluated the stability of the microbiome of patients with UC and CD over time, comparing samples at baseline with the following time points: 3, 6, 9 and 12 months. Over a 3-month interval, patients with CD, but not patients with UC, showed higher UniFrac distances compared with Healthy relatives (HR) (Mann-Whitney test, p=0.01), thereby indicating a higher instability of the CD microbiome compared with controls (figure 1). Conversely, patients with UC presented a more stable microbiome than their relatives (Mann-Whitney test, p=0.015). Furthermore, over 1-year follow-up, we compared the UniFrac distances obtained between samples collected at baseline and the rest of the time points using the mixed-design ANOVA model, a repeated measures analysis of variance. The results showed that the microbiome of patients with CD was significantly more unstable than that of patients with UC (mixed-ANOVA, p<0.001).

Microbiome stability. Unweighted UniFrac distances were calculated between different time periods for healthy relatives HR(CD) (relatives of patients with CD), HR(UC) (relatives of patients with UC), and patients with CD and UC (3M, 3 months; 6M, 6 months; 9M, 9 months; 12M, 12 months). CD-RC and UC-RC refer to samples collected during recurrence onset. At 3-month interval, patients with CD and UC presented significant differences in their UniFrac indexes compared with their HR (Mann-Whitney U test, *p=0.01). We compared the UniFrac indexes obtained between samples collected at baseline and the rest of the time points using the mixed-design ANOVA model and found that the microbiome of patients with CD was significantly more unstable than that of patients with UC (mixed-ANOVA, p<0.001). CD, Crohn's disease.
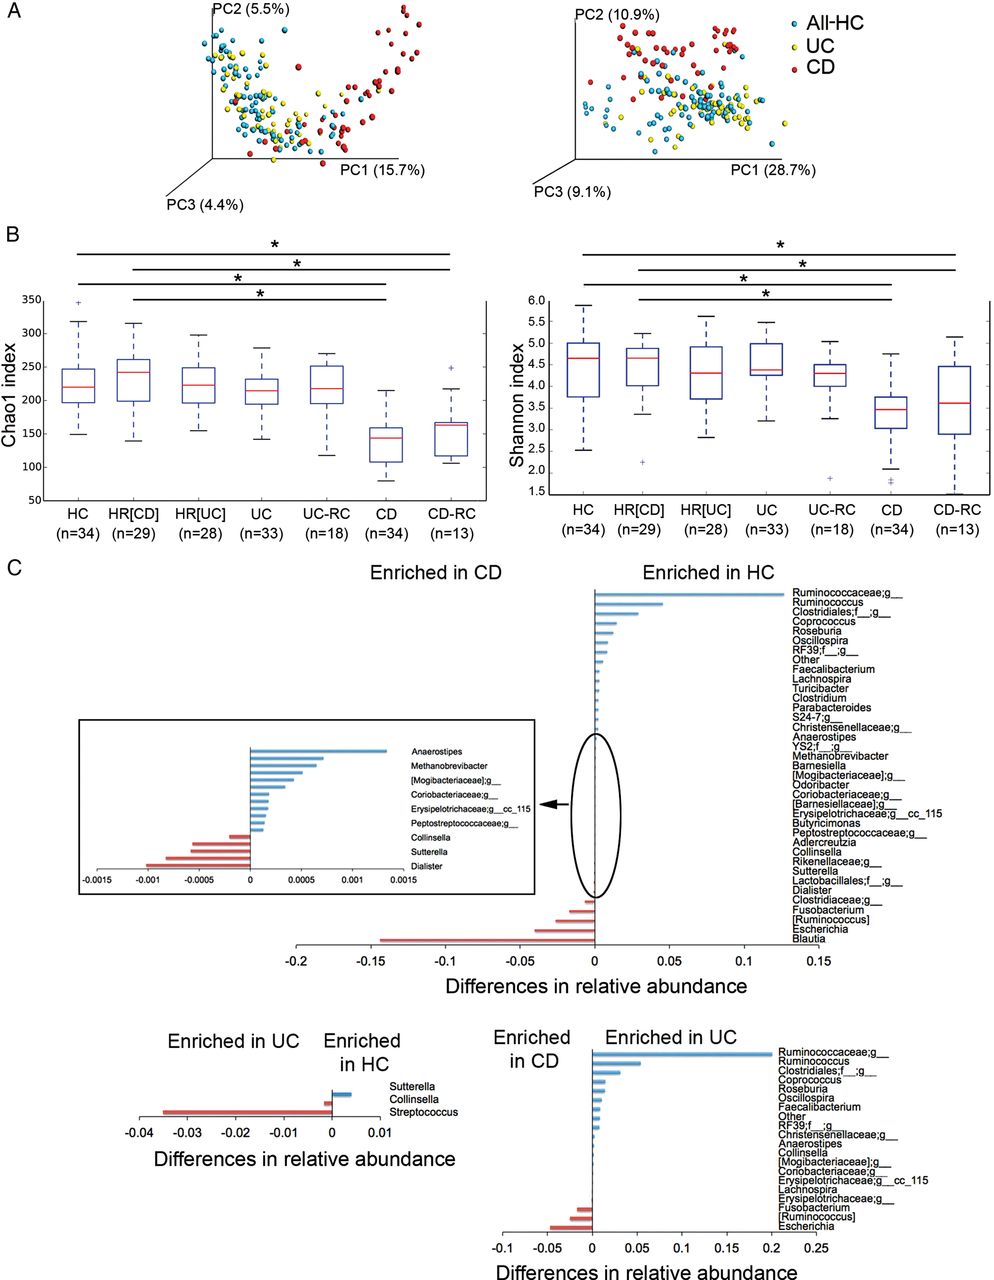
We performed a multivariate analysis of variance on distance matrices (weighted and unweighted UniFrac) using the NPMANOVA test. The microbial community of the two groups of controls (relatives (HR) and non-relatives (HC)) were not significantly different from each other (p=0.126 for weighted and unweighted UniFrac distances), except for one genus. Collinsella was more abundant (Kruskal-Wallis test, 52×10−5 vs 1.7×10⁻⁵; FDR=1.6×10⁻⁵) in HR compared with HC. Conversely, the microbiome of patients with CD and UC was significantly different from that of controls (relatives and non-relatives (All-HC)) (NPMANOVA test; p=0.001 for weighted and unweighted UniFrac distances for CD; p=0.001 for unweighted and p=0.004 for weighted UniFrac distances for UC) (figure 2A). Patients with CD and UC also showed a significant difference in their microbiome (NPMANOVA test, p=0.001 for weighted and unweighted UniFrac distances). Patients with CD but not patients with UC showed a lower microbial α diversity compared with the two groups of controls (p<0.05), as reflected by the Chao1 and Shannon indexes (figure 2B).

Dysbiosis in patients with IBD. (A) Microbiome clustering based on unweighted (left) and weighted (right) Principal Coordinate Analysis-UniFrac metrics. Significant differences were observed between all controls (All-HC, combining HC, healthy relatives HR(CD) and HR(UC)) and patients with CD (NPMANOVA test; p=0.001 for weighted and unweighted UniFrac indexes) and between all controls and patients with UC (NPMANOVA test, p=0.001 for unweighted and p=0.004 for weighted UniFrac). Microbial richness was calculated based on the Chao1 index (B, left) and microbial richness and evenness on the Shannon index (B, right). Using the Student's t-test, the microbiome of patients with CD presented significantly lower richness and evenness than healthy controls (HC, HR(CD), and HR(UC)) and patients with UC, but patients in remission and in recurrence (CD-RC and UC-RC) did not present significant differences. *p<0.05. (C) Taxonomic differences were detected between HC and UC and between HC and CD using Kruskal-Wallis test (corrected p values; false discovery rate <0.01). CD, Crohn's disease; NPMANOVA, non-parametric multivariate analysis of variance.
At baseline, six genera were enriched in patients with CD compared with 12 in HC (FDR<0.003). While only two genera were enriched in patients with UC compared with one in HC (FDR<0.03), thereby suggesting that dysbiosis is also greater in CD than in patients with UC at the taxonomic level, with a significant overall alteration in 18 genera versus 3, respectively (figure 2C). In order to uncover microbial signatures of recurrence, we used the Kruskal-Wallis test to compare the faecal samples of patients with UC and CD at the time of recurrence with those of patients who remained in remission after 1 year of follow-up. We did not find significant differences. Furthermore, in order to discover the predictive value of recurrence in patients with CD and UC, using the same test, we compared the baseline faecal samples of those who developed recurrence later on (n=13 for CD and n=18 for UC) with those who remained in remission after 1 year of follow-up (n=21 for CD and n=15 for UC). The results did not reveal any biomarker predictive of recurrence either for CD or UC.
Our results indicate that a loss of beneficial microorganisms is more associated with patients with CD than a gain of more pathogenic ones. The beneficial microorganisms include those involved in butyrate production such as Faecalibacterium,22 Christensenellaceae, Methanobrevibacter and Oscillospira. Our findings confirm the results of many other studies reporting the lower relative abundance of Faecalibacterium in patients with CD and also show that this genus is not missing in patients with UC, thus making it a useful marker to discriminate patients with CD from patients with UC. Christensenellaceae, Methanobrevibacter and Oscillospira have been correlated with subjects with a low BMI (<25),23–25 and they may interact with the gut immune system to maintain homeostasis. Potential pathogenic microorganisms, termed pathobionts, include Fusobacterium and Escherichia. The former is associated with infections26 and colorectal cancer27 ,28 and the latter with IBD.8 ,29
Relation between microbiome, smoking habit and clinical data
Previous works have shown that smoking habit is associated with IBD.30 Therefore, we tested the link between smoking and disease severity (remission and recurrence) using the χ2 test. We found no link between being a smoker or ex-smoker and disease severity. We then studied the association between relative abundance of groups of bacteria and smoking habit using the Kruskal-Wallis test. In patients with CD, a genus belonging to Peptostreptococcaceae was present in a higher proportion in smokers (FDR=0.006), while Eggerthella lenta was found in a higher proportion in non-smokers (see online supplementary material 1). In patients with UC, we observed that smokers presented a greater abundance of Butyricimonas, Prevotella and Veillonellaceae (FDR<0.04), while non-smokers had a higher proportion of Clostridiaceae and Bifidobacterium adolescentis (FDR<0.03). We also examined the link between the relative abundance of groups of bacteria and disease localisation for CD and extension for UC (obtained by the Montreal classification).31 In patients with CD, the disease was localised mostly in the ileum (L1, 35%) and in the ileocolon (L3, 64.7%). The Mann-Whitney test revealed that Enterococcus faecalis and an unknown species belonging to Erysipelotrichaceae were more abundant in stool when the disease was localised in the ileum than in the ileocolon. In patients with UC, the distribution of disease behaviour at sampling was as follows: proctitis (E1, 27.3%), left-sided colitis (E2, 33.3%) and pancolitis (39.4%). Using the Kruskal-Wallis test, we correlated disease behaviour and microbial community composition and found that proctitis was associated with a greater relative abundance of an unknown Clostridiales, Clostridium, an unknown Peptostreptococcaceae and Mogibacteriaceae (FDR<0.05) in stool. Finally, we did not find any relation between the medication use (table 1) and microbiome composition.
supplementary data
Microbial marker discovery
The effectiveness of FC to measure IBD activity was assessed on a subset of faecal samples (from the discovery cohort) provided by 122 participants (figure 3). For patients with CD and UC, FC was measured at baseline and either after 1-year in remission or at recurrence. During remission, FC was significantly higher in patients with CD and UC than in their HR and significantly higher during recurrence than during remission (figure 3). However, FC concentration did not differ between patients with CD and UC, either during remission or at recurrence, making them useless to discriminate the two disorders.

Calprotectin: biomarker of inflammation. Calprotectin was measured in the stool of healthy relatives of CD (HR(CD)) and UC (HR(UC)) patients, and in the stool of patients with CD and UC at baseline (TP0) and after 1-year in remission (RM) and at recurrence (RC). The Mann-Whitney test was used to compare differences between groups. CD, Crohn's disease.
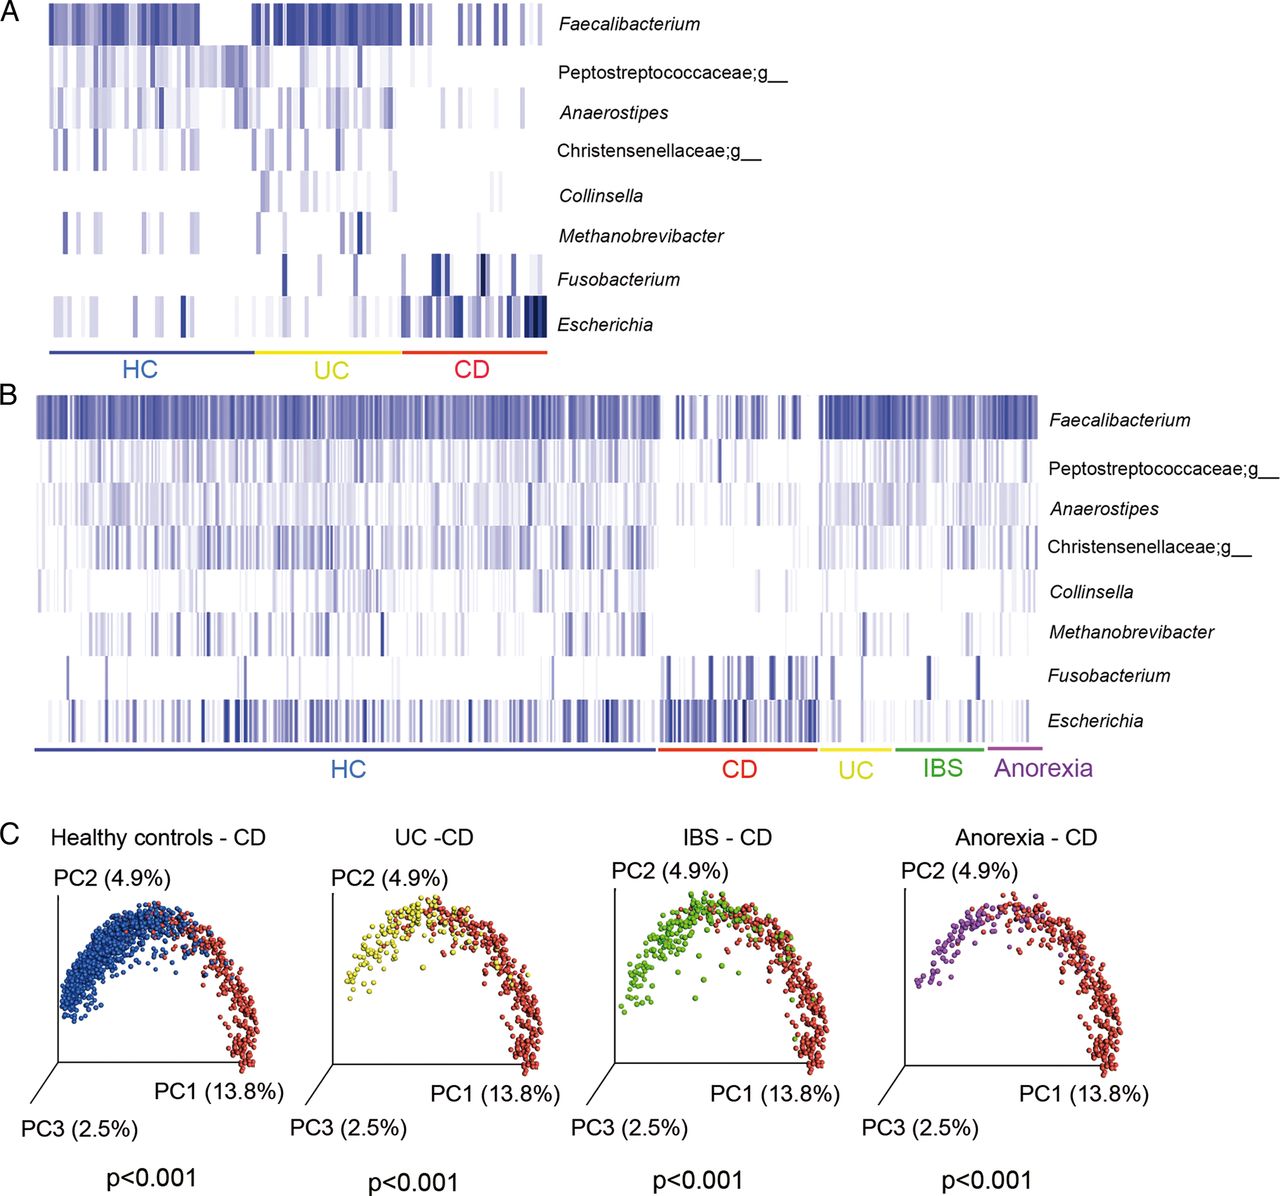
Groups of microbes that presented most significant differences between CD and UC and between CD and HC using the Kruskal-Wallis (FDR<0.05) test were selected to develop an algorithm with the potential to discriminate CD and non-CD (figure 4A). This algorithm retains samples that: “do not contain Faecalibacterium, or Peptostreptococcaceae;g, Anaerostipes and Christensenellaceae;g or contain Fusobacterium and Escherichia but not Collinsella and Methanobrevibacter”. Faecalibacterium, an unknown genus of Peptostreptococcaceae, Anaerostipes, Methanobrevibacter and an unknown genus of Christensenellaceae were abundant in HC and UC and absent or almost absent in CD ones, while Fusobacterium and Escherichia were abundant in patients with CD and almost absent in HC and UC. Collinsella, which was found mostly in UC cases, allowed us to discriminate between UC and CD. With these eight genera, we implemented the algorithm to identify patients with CD.
Microbial marker discovery and validation. Eight bacterial genera showed potential to discriminate between HC (unrelated HC) and patients with CD and UC in the discovery cohort: 34 HC, and 33 patients with UC and 34 patients with CD (A) and in the validation cohort of 2045 faecal samples from HC (n=1247), CD (n=339), UC (n=158), IBS (n=202) and anorexia (n=99) (B). Each blue bar represents the presence of each microbial group for each subject. Participants in each group are underlined with a specific colour code (blue=all HC; red=CD; yellow=UC; green=IBS and purple=anorexia). The plot was performed using an R script on relative abundance of the eight bacterial genera. The gradient of colours for the bars corresponds to white=absent, clear blue=low abundance and dark=high abundance. (C) Unweighted UniFrac Principal Coordinate Analysis representation of the various groups of subjects: HC=unrelated healthy controls, CD, Crohn's disease, Significant differences were found between CD and HC, UC, IBS and anorexia (NPMANOVA test, p<0.001). NPMANOVA, non-parametric multivariate analysis of variance.
Using this algorithm, we first tested its performance on the rest of our sample set collected 3 months after baseline from relatives of HC (167 samples), and 3, 6, 9 and 12 months after baseline for patients with IBD (135 samples for CD and 135 for UC). We obtained an average of 77.7% of true positives for CD detection and an average of 7.3% and 12.8% of false positives for the detection of HC and UC, respectively (table 2). Therefore, the diagnostic accuracy for distinguishing patients with CD from HC and from patients with UC was 85.1% and 82.4%, respectively. Of the 34 patients with CD, the median duration of the disease at sampling was 6.5 years. For four patients, the diagnosis of the disease was made the same year as the sampling, and the algorithm was able to detect three of them (75%).
Detection of CD markers in HC, CD, UC, IBS, subjects with anorexia
We validated our method with several unpublished and published data. To evaluate the sensitivity of the markers, we analysed a cohort of 54 patients with CD recruited at the University Hospital Leuven (Belgian CD cohort). Microbial DNA extraction, 16S rRNA gene amplification and sequencing and data analysis were performed in our laboratory in Spain. We generated about 5.2 million high-quality sequence reads for the 187 samples. We applied our algorithm to the whole cohort and identified an overall sensitivity of 81.8% of the samples as being CD (true positive) (table 2). Furthermore, to evaluate the predictive value of recurrence, we performed a Kruskal-Wallis analysis of the faecal samples collected before surgery, comparing patients on the basis of their Rutgeerts scores obtained 6 months after surgery. The results showed that patients who developed postoperative recurrence (with a Rutgeerts score of i3 and i4, n=28) harboured a higher relative abundance of Streptococcus (p=0.002; FDR=0.17) than those who remained in remission (with a Rutgeerts score of i0 and i1, n=26). This result suggests that the presence of Streptococcus in stool samples before surgery is a predictive marker of future recurrence.
To evaluate the specificity of the markers to detect CD versus UC, we analysed a cohort of 41 patients with UC enrolled at the University Hospital Vall d'Hebron (Spanish UC cohort). The study was part of a European project (MetaHIT; http://www.metahit.eu) and included patients with UC in long-term remission. Clinical information is shown in table 1. We extracted and sequenced the faecal microbiome at baseline (ie, collected before any intervention), generating 1.5 million sequence reads and tested our algorithm on this dataset. We obtained a specificity of 95.1% for the detection of CD versus UC (table 2). We also tested the specificity of our algorithm on several non-IBD published datasets, namely on IBS, subjects with anorexia and healthy subjects. IBS and CD may present common symptoms, including abdominal pain, cramps, constipation and diarrhoea, and a simple method that distinguishes CD from IBS could also help reducing unnecessary endoscopies. Therefore, we applied our algorithm to the faecal samples of 125 subjects previously diagnosed with IBS. The sequence data were obtained from a recently published study.32 Of the 125 patients with IBS, the algorithm identified seven as being CD, thus showing only 5.6% of false positives and a specificity of 94.4% (table 2).
The algorithm was then tested against a set of 1016 faecal samples collected at King’s College (London) from a cohort of 977 healthy twin individuals23 and against 158 faecal samples obtained from HC and patients diagnosed with anorexia.33 Comprising healthy female adult twin pairs from the UK, the former study was originally designed to evaluate how host genetic variation shapes the gut microbiome. Our algorithm detected 75 out of 1016 samples (7.3% of false positive) as being CD, thus showing a specificity of 92.7%. The second study was designed to address dysbiosis in patients with anorexia compared with HC and to evaluate the shift in the microbial community after weight gain in patients with anorexia.34 As shown in this study, anorexia is associated with an alteration of gut microbiome composition. In order to evaluate whether changes occur in the gut community as a result of a condition other than IBD, we tested the algorithm on this anorexic cohort. Our tool detected 9 false positives out of 158 samples, thus showing a specificity of 94.3%.
Figure 4B illustrates the profile of the 8 microbial markers in the whole dataset of 2045 faecal samples from the various conditions: HC, CD, UC, IBS and anorexia. The results clearly confirmed that CD is characterised by a different abundance profile of the eight markers compared with the other groups, as also shown by a separate clustering based on the unweighted UniFrac PcoA representation (figure 4C).
To test the accuracy of the method, we also applied it to a set of recently published data recovered from a French cohort of IBD subjects5 although those authors used a different method to analyse the microbial community compared with our approach. In that case, they addressed a different variable region of the 16S rRNA gene (V3–V5 instead of V4) and a different sequencing platform (Ion Torrent sequencing instead of Illumina Miseq). In that study, Sokol et al characterised the microbiome of 235 well-phenotyped patients with IBD and 38 HC. In spite of the technical differences, we re-ran the analysis using their raw sequence data and our sequence analysis protocol (see the Methods section). Using our quality control criteria, we recovered 8.5 million high-quality sequences for 232 patients with IBD (146 CD and 86 UC) and the 38 HC. Our method showed an accuracy of 64% for the prediction of CD versus UC (60% sensitivity and 68% specificity) and of 77% for the prediction of CD versus HC (60% sensitivity and 94.8% specificity), respectively. Moreover, we noticed that this dataset does not carry any sequences belonging to the genus Collinsella and a very low abundance of Methanobrevibacter, which in our algorithm allow the differentiation between UC and CD.
Conclusion
Although UC and CD share many epidemiologic, immunologic, therapeutic and clinical features, our results from the microbial community analysis confirmed that they are two distinct subtypes of IBD at the microbiome level. Based on the comparison of the microbial community between HC and CD and between HC and UC, we determined, for the first time, a non-invasive test and evaluated its potential clinical utility as a screening marker for CD in adults. We first tested its performance on the Spanish IBD cohort used as the discovery cohort and validated its sensitivity on a newly enrolled Belgian CD cohort. The overall IBD cohort comprised new-onset patients with CD and IBD in remission or with active disease. We evaluated its specificity on a healthy UK twin cohort and on several cohorts of patients with non-IBD. The test showed a sensitivity of about 80% for CD, using the Spanish and Belgian cohorts, and a specificity of 94.3%, 94.4%%, 89.4% and 90.9% of CD detection versus HC, and patients with anorexia, IBS and UC, respectively. Furthermore, all the samples from the Belgian patients with CD who took antibiotics were detected by the algorithm, thereby suggesting that antibiotics intake prior to sampling did not affect detection by the algorithm. Nevertheless, the overall sensitivity of 80% obtained with the Spanish and Belgian cohorts could have been inflated as a result of the fact that we applied the algorithm to the samples independently over time. Another limitation of our analysis is that the higher accuracy of 85.4%, to detect CD versus UC, obtained using the Spanish cohort compared with the 60% with the French cohort could be explained by a difference in the methodological approach. The low accuracy obtained with the French data may point to a limitation of this method as a diagnostic tool, as the laboratories analysing the patient's microbiome should apply the method used in this study. This finding also demonstrates the importance of the development and use of standardised methods to analyse the microbiome. Further experimental designs could be proposed to evaluate the extent to which the method used here could be implemented in a laboratory.
The rapid gathering of information on the human gut microbiome, which is the collective genomes of the gut microbiota, has been possible thanks to the following: advances in culture techniques, thus allowing a full picture of the microbial diversity present in a biological sample; the development of new sequencing technologies, which led to an exponential decrease in sequencing costs and the emergence of powerful bioinformatics tools to analyse sequence data. Together, these developments have allowed us to perform the microbiome analysis of a faecal sample for less than 150 euros on a small scale and in 1 day. On a larger scale the cost could be significantly reduced.
The non-invasive diagnostic tool described herein may be valuable when assessing patients with non-specific signs and symptoms suggestive of IBD, thereby facilitating clinical decision-making when the diagnosis of CD is initially uncertain. Indeed, this tool could be combined with either imaging techniques or calprotectin data to confirm diagnosis.
Acknowledgments
We thank Julia Goodrich for sharing information on her published twin study from UK, Santiago Perez-Hoyos for his advice on statistical analysis and Andreu Schoenenberger for his statistical analyses.
References
Footnotes
VP and MP share co-first authorship
Contributors CM: Study concept and design; FC, NB, FG and SV: acquisition of samples; AS, DC, GS, KM, EV and HS: acquisition of data; VP, MP and XM: analysis of data; CM: interpretation of data; CM: drafting of the manuscript; FG, HS, SV and CM: critical revision of the manuscript for important intellectual content; VP, MP: statistical analysis; CM: obtained funding). All the authors contributed to manuscript revision.
Funding This study was supported by two grants from the Instituto de Salud Carlos III/FEDER (CP13/00181, PI14/00764). KM is a postdoctoral fellow and SV a senior clinical investigator of the Fund for Scientific Research Flanders, Belgium (FWO-Vlaanderen).
Competing interests None declared.
Patient consent Obtained.
Ethics approval Local Ethical Committee of the University Hospital Vall d'Hebron in Barcelona and the University Hospital Gasthuisberg in Leuven.
Provenance and peer review Not commissioned; externally peer reviewed.