Article Text

Abstract
Objective It is evident that the gut microbiota and factors that influence its composition and activity effect human metabolic, immunological and developmental processes. We previously reported that extreme physical activity with associated dietary adaptations, such as that pursued by professional athletes, is associated with changes in faecal microbial diversity and composition relative to that of individuals with a more sedentary lifestyle. Here we address the impact of these factors on the functionality/metabolic activity of the microbiota which reveals even greater separation between exercise and a more sedentary state.
Design Metabolic phenotyping and functional metagenomic analysis of the gut microbiome of professional international rugby union players (n=40) and controls (n=46) was carried out and results were correlated with lifestyle parameters and clinical measurements (eg, dietary habit and serum creatine kinase, respectively).
Results Athletes had relative increases in pathways (eg, amino acid and antibiotic biosynthesis and carbohydrate metabolism) and faecal metabolites (eg, microbial produced short-chain fatty acids (SCFAs) acetate, propionate and butyrate) associated with enhanced muscle turnover (fitness) and overall health when compared with control groups.
Conclusions Differences in faecal microbiota between athletes and sedentary controls show even greater separation at the metagenomic and metabolomic than at compositional levels and provide added insight into the diet–exercise–gut microbiota paradigm.
- DIET
- MOLECULAR BIOLOGY
Statistics from Altmetric.com
Significance of this study
What is already known on this subject?
Taxonomic and functional compositions of the gut microbiome are emerging as biomarkers of human health and disease.
Physical exercise and associated dietary adaptation are linked with changes in the composition of the gut microbiome.
Metabolites such as short-chain fatty acids (SCFAs) have an impact on a range of health parameters including immunity, colonic epithelial cell integrity and brain function.
What are the new findings?
Our original observation of differences in gut microbiota composition in elite athletes is confirmed and the separation between athletes and those with a more sedentary lifestyle is even more evident at the functional or metabolic level. Microbial-derived SCFAs are enhanced within the athletes.
How might it impact on clinical practice in the foreseeable future?
The findings provide new evidence supporting the link between exercise and metabolic health. The findings provide a platform for the rational design of diets for those engaged in vigorous exercise. The identification of specific alterations in the metabolic profile of subjects engaged in high levels of exercise provides insight necessary for future efforts towards targeted manipulation of the microbiome.
Introduction
Regular exercise challenges systemic homeostasis resulting in a breadth of multiorgan molecular and physiological responses, including many that centre on immunity, metabolism and the microbiome–gut–brain axis.1–5 Exercise exhibits systemic and end-organ anti-inflammatory effects as well as contributing to more efficient carbohydrate metabolism, in addition to trophic effects at the level of the central nervous system.6 ,7 In fact, increasing physical activity offers an effective treatment and preventative strategy for many chronic conditions in which the gut microbiome has been implicated.8–10 Conversely, a sedentary lifestyle is a major contributing factor to morbidity in developed Western society and is associated with heightened risk of numerous diseases of affluence, such as obesity, diabetes, asthma and cardiovascular disease (CVD).11–14 Recent evidence supports an influential role for the gut microbiome in these diseases.15–23
The concept that regular exercise and sustained levels of increased physical activity foster or assist the maintenance of a preferential intestinal microbiome has recently gained momentum and interest.24–29 Previously, using 16S rRNA amplicon sequencing, we demonstrated taxonomic differences in gut microbiota between an elite athlete cohort of international-level rugby players and a group of age-matched high (>28 kg/m2) and low (<25 kg/m2) body mass index (BMI) controls.26 This analysis illustrated a significantly greater intestinal microbial diversity among the athletes compared with both control groups. This taxonomic diversity significantly correlated with exercise and dietary protein consumption. However, the possibility existed that these differences did not equate to differences at a functional level. Here, we re-examine the microbiome in these participants by whole metagenome shotgun sequencing to provide deeper insight into taxonomic composition and functional potential and by complementary metabolic phenotyping analyses of host-derived and microbial-derived (urine and faecal, respectively) metabolic profiles. This analysis shows that the differences in the gut microbiota between athletes and controls is even more pronounced at the functional metabolic level than at the compositional level as previously reported and provides further rationale for prospective controlled studies to unravel the relationship between diet, exercise and the gut microbiome.
Results
The study groups comprise professional male athletes (n=40) and healthy controls (n=46).26 To better represent the variability of BMI in the athletes, controls were classified as either low BMI (n=22, BMI≤25.2) or high BMI (n=24, BMI≥26.5). Participants made no report of GI distress or alterations of GI transit time throughout the course of the initial study.
Functional structure of the enteric microbiome correlates with athletic state
Functional metagenomic analysis of faecal samples allowed for the prediction of the operational potential of each individual's microbiota. In total, 19 300 taxonomically linked metabolic pathways were identified in at least one individual. Comparison of phylogenetic constructions derived from the 16S rRNA amplicon data of our previous study and the functional data of this present report reveals a greater level of identification at higher levels of taxonomy (eg, phylum) for 16S sequences,26 while the metagenomic data had greater fidelity and superior resolution of lower levels of taxonomy (eg, species) (figure 1). Consistent with previous results, the microbiota of the athletes were significantly more diverse than that of both the low-BMI and high-BMI control groups at the functional level (figure 2A). Furthermore, our previous findings of an enrichment of Akkermansia in athletes was corroborated by the presence of significantly higher proportions of metabolic pathways associated with this genus in athletes when compared with high-BMI controls (p<0.001). Correlation analysis revealed that, of the total 19 300 pathways, 98 were significantly altered between the three cohorts (p<0.05) (see online supplementary table S1). Subsequently, large-scale functional dissimilarity between athletes and controls was determined and distinct patterns of pathway composition between groups were revealed (see online supplementary figure S1A). This functional distinction remained true whether applied to total pathway data or to the statistically significant subset of pathways (see online supplementary figure S1B). Correlation of pathways present in at least one member from both cohorts further exemplified the uniformity of the athletes and the division between the athletes and control groups (see online supplementary figure S1C). Separation according to group membership was further illustrated through principal coordinate analysis (PCoA), with statistical support of the significant separation between the athletes and both control groups (p<0.05) (figure 2B). This was also the case for the statistically significant subset of pathways (see online supplementary figure S1D). Principal component analysis (PCA) supplemented with a correspondence analysis and k-nearest neighbour semisupervised learning approach cast further light (ie, visualisation of robustly defined class associations of specific individuals within the groups) on the clustering of participants within and between cohorts (see online supplementary figure S1E).
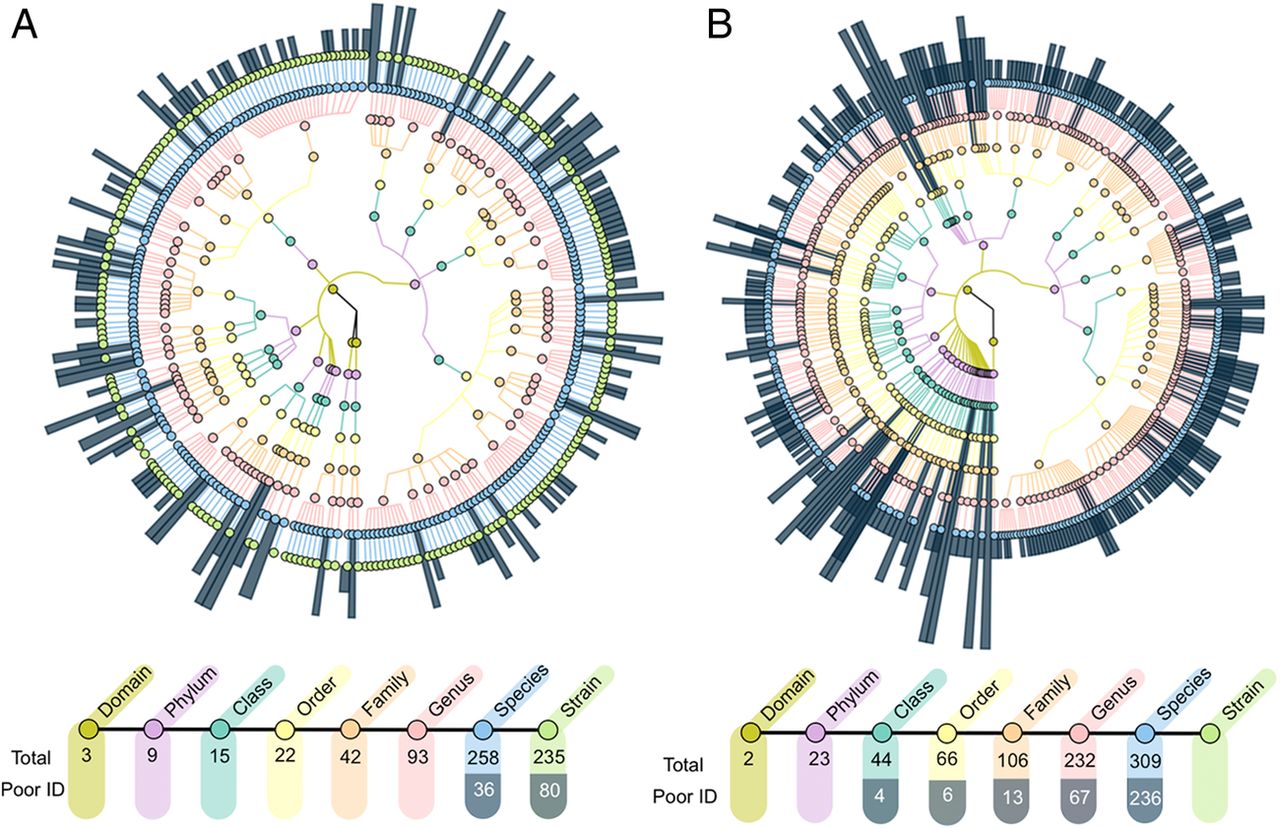
Comparison of phylogenetic constructions from metagenomic and 16S rRNA gene sequencing sourced from all participants. Phylogenetic trees derived from (A) metagenomic sequencing and (B) 16S rRNA amplicon sequencing. Taxonomic levels are assigned from centre out with kingdom-level assignment in centre and strain-level assignment in outer most ring. Dark blue radial highlights correspond to poorly identified taxonomies (ie, ‘unknown’ and ‘unassigned’ database entries). Number of assignments at each level of phylogeny is displayed below the respective graph. Taxonomic trees derived from the two sequencing approaches illustrate an advantage of metagenomic sequencing in the number of predictions of lower taxonomic levels and the frequency of full identification of taxa, while 16S rRNA sequencing grants greater insight of high-level phylogenies within the population.

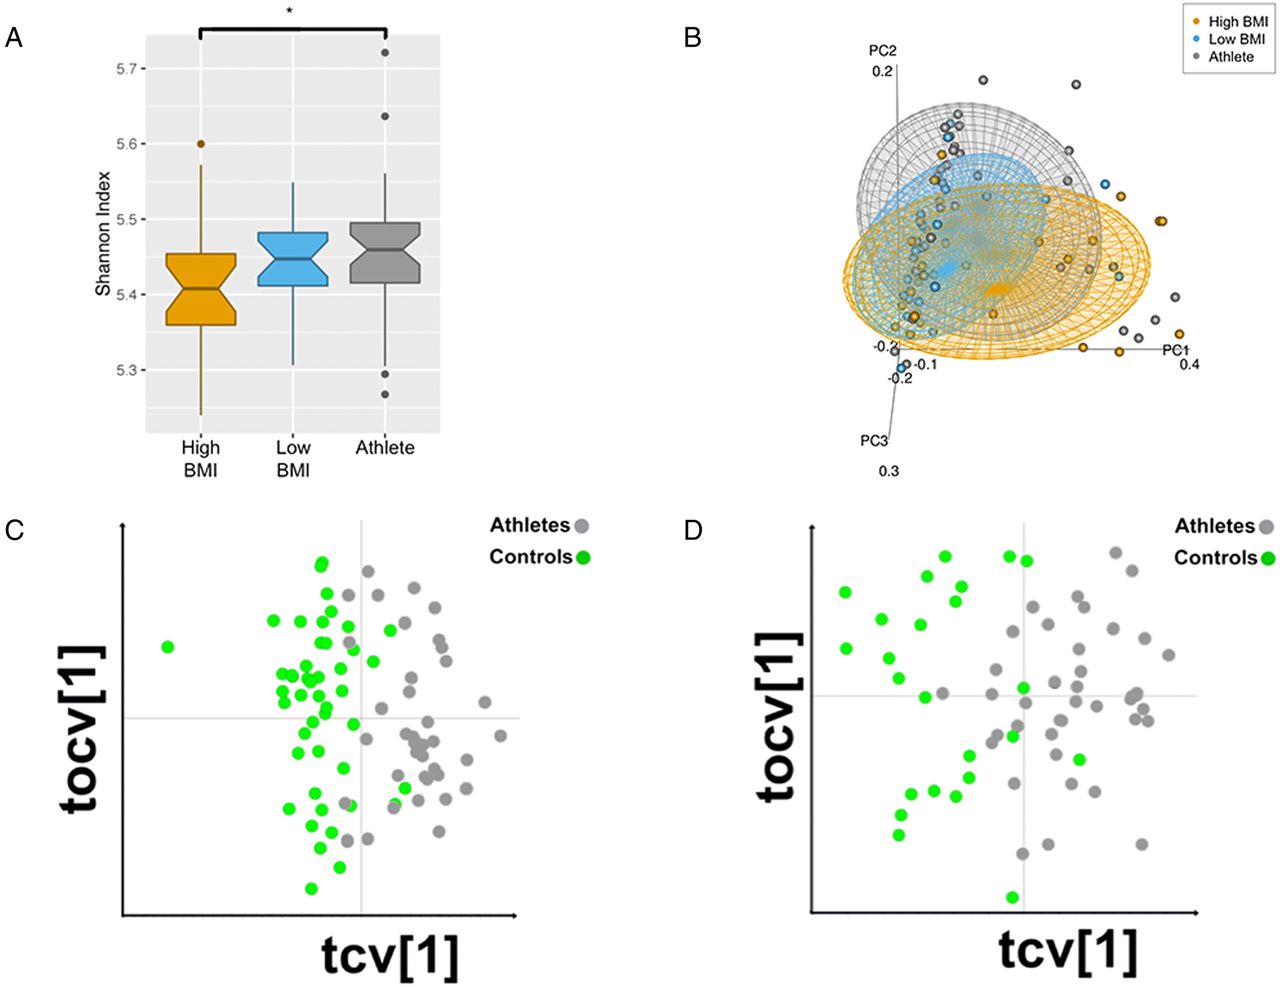
Group-wise comparison of microbial metagenomic and metabolomic profiles. (A) Shannon index of diversity for metabolic pathways from all three groups. Pathway diversity is increased in the athlete group when compared with low-body mass index (BMI) and high-BMI controls. Diversity measures are statistically significant between low-BMI and athlete groups (p<0.049), with statistical significance between all groups (Kruskal-Wallis p<0.05). (B) Principle coordinate analysis of Bray-Curtis compiled distance matrix of all microbial metabolic pathway relative abundances. Groups show significant variation from one another (Adonis PERMANOVA p<0.05). Cross-validated orthogonal partial least squares regression discriminant analysis (OPLS-DA) of full nuclear magnetic resonance (1H-NMR) spectra from urine (R2Y=0.86, Q2Y=0.60) (C) and faecal water (R2Y=0.86, Q2Y=0.52) (D) samples. OPLS-DA displays robust separation between athletes and controls. Models comprise 1 predictive (tcv[1]) and 1 orthogonal (tocv[1]) principal component.
Supplemental material
Pathways exhibiting statistically significant variation between the athletes and both control groups were organised according to MetaCyc metabolic pathway hierarchy classification (34 metabolic categories), highlighting a number of differences (figure 3A and online supplementary table S2). Distinct clustering patterns were observed within each cohort, with the high-BMI control group having the lowest average abundance scores across 31 metabolic pathway categories (the exceptions being vitamin biosynthesis (VB), lipid biosynthesis (LB) and amino acid biosynthesis (AAB) categories). The athlete group had the highest mean abundance across 29 of the 34 metabolic categories (eg, carbohydrate biosynthesis, cofactor biosynthesis and energy metabolism) (see online supplementary table S2).
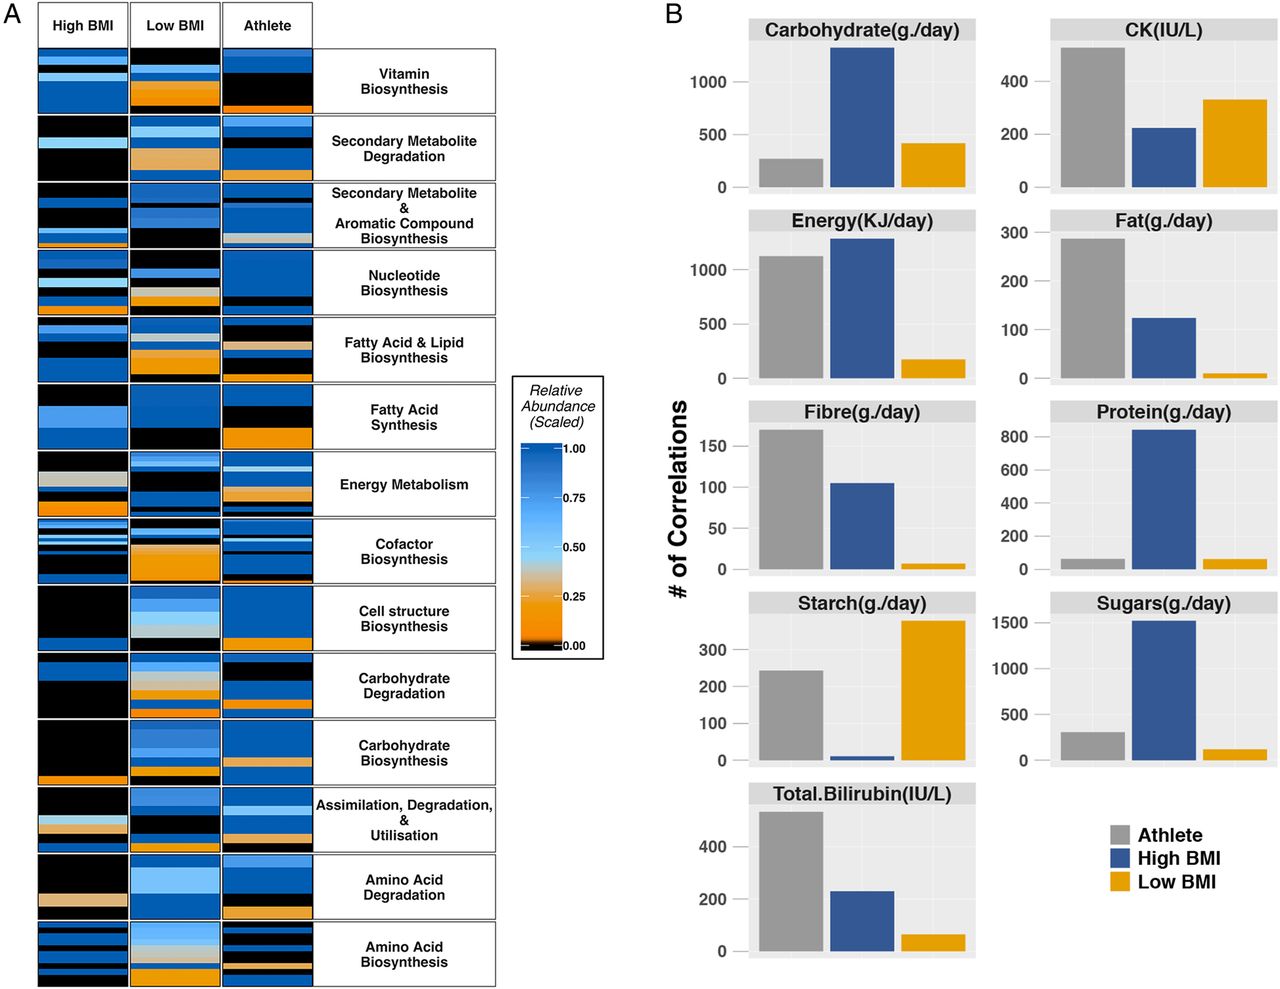
Group variation of microbial metabolic function and associations between pathways and clinical and dietary variables. (A) Mean relative abundance values of statistically significant (Kruskal-Wallis p<0.05) metabolic pathways binned according to categories of metabolic function. (B) Number of metabolic pathways significantly (Benjamini-Hochberg corrected p<0.05) correlated with dietary constituents and blood serum metabolites. BMI, body mass index.
Numerous statistically significant (p<0.05) associations were identified between pathway abundances and serum creatine kinase (CK)—an enzymatic marker of muscle activity (IU/L), total bilirubin (IU/L) and dietary macronutrient intake of protein (g/day), fibre (g/day), carbohydrates (g/day), sugars (g/day), starch (g/day), fat (g/day) and total energy (KJ/day) (figure 3B). Each group was represented by distinct association profiles of the correlation between clinical measurements and metagenomic pathways. Dietary factors, sugars and other carbohydrates, as well as energy intake, provide the majority of the correlations for the control groups, whereas the athlete group was predominantly correlated with CK, total bilirubin and total energy intake. Of the total number of metabolic pathways with associations to the clinical data from all three groups (10 760; data not shown), relevant pathways related to the production of secondary metabolites, cofactors and short-chain fatty acids (SCFAs) were identified (eg, biotin biosynthesis and pyruvate fermentation to butanoate).
Distinct differences between host and microbial metabolites in athletes and controls
A combination of multiplatform metabolic phenotyping and multivariate analysis based on orthogonal partial least squares discriminant analysis (OPLS-DA) was used to compare urine and faecal samples from athletes and controls. The cross-validated (CV) OPLS-DA models show strong differences between athletes and controls in urine samples by proton nuclear magnetic resonance (1H-NMR) analysis (R2Y=0.86, Q2Y=0.60, figure 2C), hydrophilic interaction ultra-performance liquid chromatography mass spectroscopy (HILIC UPLC-MS) positive mode analysis (R2Y=0.85, Q2Y=0.74, online supplementary figure S2A) and reversed-phase UPLC-MS (RP UPLC-MS) in both positive and negative mode analysis (R2Y=0.83, Q2Y=0.73 and R2Y=0.83, Q2Y=0.67, online supplementary figure S2B,C respectively). Likewise, the CV-OPLS-DA models comparing faecal samples, although weaker than the urine models, reveal significant differences between athletes and controls by 1H-NMR analysis (R2Y=0.86, Q2Y=0.52, figure 2D) and HILIC UPLC-MS positive mode analysis (R2Y=0.65, Q2Y=0.34, online supplementary figure S2D).
The loadings of the pairwise OPLS-DA models were used to identify metabolites discriminating between the two classes. Athletes' 1H-NMR metabolic phenotypes were characterised by higher levels of trimethylamine-N-oxide (TMAO), L-carnitine, dimethylglycine, O-acetyl carnitine, proline betaine, creatine, acetoacetate, 3-hydroxy-isovaleric acid, acetone, N-methylnicotinate, N-methylnicotinamide, phenylacetylglutamine (PAG) and 3-methylhistidine in urine samples and higher levels of propionate, acetate, butyrate, trimethylamine (TMA), lysine and methylamine in faecal samples, relative to controls. Athletes were further characterised by lower levels of glycerate, allantoin and succinate and lower levels of glycine and tyrosine relative to controls in urine and faecal samples, respectively (see online supplementary table S3).
While numerous metabolites discriminated significantly between athletes and controls with RP UPLC-MS positive (490) and negative (434) modes for urine, as well as with HILIC UPLC-MS positive mode for urine (196) and faecal water (3), key metabolites were structurally identified using the strategy described below. UPLC-MS analyses revealed higher urinary excretion of N-formylanthranilic acid, hydantoin-5-propionic acid, 3-carboxy-4-methyl-5-propyl-2-furanpropionic acid (CMPF), CMPF glucuronide, trimetaphosphoric acid, acetylcarnitine (C2), propionylcarnitine (C3), isobutyrylcarnitine (C4), 2-methylbutyroylcarnitine (C5), hexanoylcarnitine (C6), C9:1-carnitine, L-valine, nicotinuric acid, 4-pyridoxic acid and creatine in athletes relative to controls. Levels of glutamine, 7-methylxanthine, imidazoleacetic acid, isoquinoline/quinolone were lower in athletes' urinary samples relative to controls. In addition, 16 unknown glucuronides were lower in the athlete samples (see online supplementary table S4).
SCFA levels in faeces measured by targeted gas chromatography–mass spectrometry (GC-MS) showed significantly higher levels of acetate (p<0.001), propionate (p<0.001), butyrate (p<0.001) and valerate (p=0.011) in athletes relative to controls. Isobutyrate and isovalerate did not differ significantly between the groups (figure 4B and online supplementary table S5). Furthermore, concentrations of propionate strongly correlated to protein intake, while butyrate was shown to have a strong association with intake of dietary fibre (see online supplementary table S6).

Athletes display a profile of short-chain fatty acids (SCFAs) that alters from that of the controls. (A) Heat map of bacterial taxa (family, genus and species level) that correlate with faecal short-chain fatty acid levels using Spearman's correlation. Cool colours represent positive correlations; hot colours represent negative correlations (r). All taxa shown had a correlation p value<0.01. Those marked with * represent correlations with a false discovery rate <0.01 after Benjamini-Hochberg multiple testing corrections. (B) Median concentrations of GC-MS-derived faecal SCFA. Quantitative analysis of SCFAs in faecal samples shows significant increase in measured concentrations of acetate, propionate, butyrate and valerate in athletes. Error bars represent 95% CIs. (C) Quantification of statistically relevant correlations of metabolic pathways to GC-MS-derived faecal SCFA concentrations (μM). BMI, body mass index; GC-MS, gas chromatography–mass spectrometry.
Correlating metabonomic and metagenomic results
Correlation analysis between targeted measurements of SCFAs and taxonomic data from 16S rRNA sequencing revealed a number of correlations that remained significant following correction; Roseburia was positively correlated with acetate (p=0.004) and butyrate (p=0.018) while Family XIII Incertae Sedis was positively correlated with isobutyrate (p<0.001), isovaleric acid (p<0.001) and valeric acid (p=0.008) (figure 4A and online supplementary table S7).
SCFAs were also correlated with pathway relative abundances, with all SCFAs associating with considerably more pathways in the athletes versus the controls (figure 4C). Multiple statistically significant (7948) (p<0.05) correlations between the metabolic pathways and SCFAs were identified (see online supplementary table S8). Two distinct blocks of proportionately discriminant correlations were observed with isobutyric and isovaleric acids, which were more abundant in the athletes, while acetic and butyric acids were proportionately more abundant in controls. Correlations of the SCFA concentrations to pathways related to fermentation, biosynthesis or modification of fatty acids were identified among the numerous other associations (see online supplementary table S8 for complete list). Additional correlations of metabolic pathways against well-identified metabolites detected from both faecal water (figure 5A, C) and urine (figure 5B, D) presented numerous significant associations (6186 and 13 412, respectively; data not shown) (p<0.05). It was also observed that 16 genera correlated with 12 metabolites (see online supplementary table S9).

Distinctive association profiles of metabolic pathways to metabolites in athletes and controls. (A) Significant correlations of faecal water-derived metabolites and metabolic pathways, represented by number of correlations for each metabolite. (B) Urine metabolites significantly correlated to pathways and displayed as number of correlations. (C) Significant correlations shown in (A) displayed as proportions of total associations. (D) Correlations presented in (B) given as proportions of total associations. BMI, body mass index; PAG, phenylacetylglutamine; TMAO, trimethylamine-N-oxide.
Discussion
The results confirm enhancement of microbial diversity in athletes compared with controls. Supporting previous insights into the beneficial influence of physical exercise and associated diet on the compositional structure of the gut microbiota,25 ,26 ,30 this study has extended the paradigm to include links between physical fitness and the functional potential of the gut microbiota and its metabolites. It must be conceded that some athletes, although fit, may not necessarily be more healthy.31
Athletes have an increased abundance of pathways that—given an equivalent amount of expression activity—could be exploited by the host for potential health benefit, including biosynthesis of organic cofactors and antibiotics, as well as carbohydrate degradation and secondary metabolite metabolism.32 Furthermore, athletes have an enriched profile of SCFAs, previously associated with numerous health benefits and a lean phenotype.33–35 While interpretation of SCFA data can be difficult as levels represent a combination of SCFA production and host-absorption rates, it is notable that, as previously presented, the athletes' diet maintained significantly higher quantities of fibre intake.26 This along with an increased number of detected SCFA pathways in the athletes would be conducive to an enhanced rate of SCFA production36
It was noted that athletes excreted proportionately higher levels of the metabolite TMAO, an end product metabolite of dietary protein degradation. Elevated TMAO has been observed in patients with cardiovascular disease and atherosclerosis, highlighting a potential downside to increased protein intake.15–17 ,22 ,37 However, TMAO is also found in high levels in the urine of Japanese populations,38 who do not have high risk for CVD. Similarly to these populations, the athletes' diet contained a significantly greater proportion of fish. Our current understanding of the implications of this result remains limited and requires elaboration in future studies. Furthermore, pathway abundance in a metagenome merely reflects functional potential and not necessarily increased expression in situ.
Variance of metagenomic composition between athletes and controls was exemplified with unique pathway–pathway correlations between the two groups. Analysis of categorically arranged pathway abundances within the separate cohorts provided additional insight into the previously described dichotomy between the microbiota of athletes and high-BMI controls. The two groups displayed distinct structures of functional capacity, separately oriented to operate under the different physiological milieu of the two groups. Notably, from a functional perspective, the microbiota of the low-BMI group was more similar to the athletes. The low-BMI controls were generally engaged in a modestly active lifestyle, reflected by their leanness and increased levels of CK. It is speculative but not implausible that moderate improvements in physical activity for overweight and obese individuals may confer the beneficial metabolic functions observed within the athlete microbiome.
Dietary contributions to the functional composition of the enteric microbial system are also evident in our study. The relative abundances of pathways related to fundamental metabolic function—AAB, VB and LB—were higher on average within the high-BMI control group when compared with the athlete group. The mechanisms behind these differences are unclear and might reflect chronic adaptation of the athlete gut microbiome; possibly due to a reduced reliance on the corresponding biosynthetic capacities of their gut microbiota. On the contrary, the athlete microbiome presents a functional capacity that is primed for tissue repair and to harness energy from the diet with increased capacity for carbohydrate, cell structure and nucleotide biosynthesis, reflecting the significant energy demands and high cell-turnover evident in elite sport.
Remarkably, our examination of pathway correlation to dietary macronutrients and plasma CK, as a biomarker of exercise,39 is suggestive of an impact of physical activity on the use of dietary nutrients by the microbiota of the gut. Comparing athletes to both high-BMI and low-BMI controls, a greater number of pathways correlating to specific macronutrients with the controls suggests a shift in the dynamics of these varied metabolic functions. The impact of the athletes' increased protein intake compared with both control groups was evident in the metabolomic phenotyping results. By-products of dietary protein metabolism (mostly by microbes) including TMAO, carnitines, TMA, 3-CMPF and 3-hydroxy-isovaleric acid are all elevated in the athlete cohort. Of particular interest is 3-hydroxy-isovaleric acid (potentially from egg consumption), which has been demonstrated to have efficacy for inhibiting muscle wasting when used in conjunction with physical exercise.40 ,41 The compound is also commonly used as a supplement by athletes to increase exercise-induced gains in muscle size, muscle strength and lean body mass, reduce exercise-induced muscle damage and speed recovery from high-intensity exercise.41 Numerous metabolites associated with muscle turnover, creatine, 3-methylhistidine and L-valine, and host metabolism, carnitine, are elevated in the athlete groups. Metabolites derived from vitamins and recovery supplements common in professional sports, including glutamine, lysine, 4-pyridoxic acid and nicotinamide, are also raised in the athlete group. It is notable that PAG, a microbial conversion product of phenylalanine, has been associated with a lean phenotype and is increased in the athletes.42 Furthermore, PAG positively correlates with the genus Erysipelotrichaceae incertae sedis, which we have previously noted to be present in relatively higher proportions in the athlete group compared with both control groups. PAG is the strongest biomarker postbariatric surgery, where it is associated with an increase in the relative proportions of Proteobacteria as observed here in the athlete group. Within the SCFAs, two distinct clusters were observed; acetic acid, propionic acid and butyric acid correlate with dietary contributors (fibre and protein), while isobutyric acid, isovaleric acid and valeric acid correlate with microbial diversity. The same clusters are observed when correlating with individual taxa, in support of previously observed links between SCFAs and numerous metabolic benefits and a lean phenotype.33–35
Our ongoing work in this area with non-athletes engaging in a structured exercise regime looks to further explore components of the exercise and diet–microbiome paradigm, which, along with this study, may inform the design of exercise and fitness programmes, including diet design in the context of optimising microbiota functionality for both athletes and the general population.
Materials and methods
Study population
Elite professional male athletes (n=40) and healthy controls (n=46) matched for age and gender were enrolled in 2011 as previously described in the study.26 Due to the range of physiques within a rugby team (player position dictates need for a variety of physical constitutions, ie, forward players tend to have larger BMI values than backs, often in the overweight/obese range) the recruited control cohort was subdivided into two groups. To more completely include control participants, the BMI parameter for group inclusion was adjusted to BMI ≤25.2 and BMI ≥26.5 for the low-BMI and high-BMI groups, respectively. Approval for this study was granted by the Cork Clinical Research Ethics Committee.
Acquisition of clinical, exercise and dietary data
Self-reported dietary intake information was accommodated by a research nutritionist within the parameters of a food frequency questionnaire in conjunction with a photographic food atlas as per the initial investigation.26 Fasting blood samples were collected and analysed at the Mercy University Hospital clinical laboratories, Cork. As the athletes were involved in a rigorous training camp, we needed to assess the physical activity levels of both control groups. To determine this, we used an adapted version of the EPIC-Norfolk questionnaire.43 Creatine kinase levels were used as a proxy for level of physical activity across all groups.
Preparation of metagenomic libraries
DNA derived from faecal samples was extracted and purified using the QIAmp DNA Stool Mini Kit (cat. no 51 504) prior to storage at −80°C. DNA libraries were prepared with the Nextera XT DNA Library Kit (cat. no FC-131-1096) prior to processing on the Illumina HiSeq 2500 sequencing platform (see online supplementary methods for further detail).
Supplementary methods
Metagenomic statistical and bioinformatic analysis
Delivered raw FASTQ sequence files were quality checked as follows: contaminating sequences of human origin were first removed through the NCBI Best Match Tagger (BMTagger). Poor-quality and duplicate read removal, as well as trimming was implemented using a combination of SAM (sequence alignment map) and Picard tools. Processing of raw sequence data produced a total of 2 803 449 392 filtered reads with a mean read count of 32 598 248.74 (±10 639 447 SD) per each of the 86 samples. These refined reads were then subjected to functional profiling by the most recent iteration of the Human Microbiome Project Unified Metabolic Analysis Network (HUMAnN2 V.0.5.0) pipeline.44 The functional profiling performed by HUMAnN2 composed tabulated files of microbial metabolic pathway abundance and coverage derived from the Metacyc database.45 Microbial pathway data were statistically analysed in the R software environment (V.3.2.2) (for further details see online supplementary methods) (R Development Core Team. R: A Language and Environment for Statistical Computing (R Foundation for Statistical Computing, Vienna, 2012). 2015. http://www.R-project.org). All presented p values were corrected for multiple comparisons using the Benjamini-Hochberg false discovery rate (pFDR) method.46
Metabolic profiling
Urine and faecal samples were prepared for metabonomic analysis as previously described.47 ,48 Using established methods, urine samples underwent 1H-NMR, RP and HILIC chromatography profiling experiments. Faecal samples underwent 1H-NMR, HILIC and bile acid UPLC-MS profiling experiments and GC-MS-targeted SCFA analysis.48–50
After data preprocessing,51 the resulting 1H-NMR and LC-MS data sets were imported into SIMCA 14.1 (Umetrics) to conduct multivariate statistical analysis. PCA, followed by OPLS-DA, was performed to examine the data sets and to observe clustering in the results according to the predefined classes. The OPLS-DA models in this study were established based on one PLS component and one orthogonal component. Unit variance scaling was applied to 1H-NMR data, Pareto scaling was applied to MS data. The fit and predictability of the models obtained were determined by the R2Y and Q2Y values, respectively. Significant metabolites were obtained from LC-MS OPLS-DA models through division of the regression coefficients by the jack-knife interval SE to give an estimate of the t-statistic. Variables with a t-statistic ≥1.96 (z-score, corresponding to the 97.5 percentile) were considered significant. Significant metabolites were obtained from 1H-NMR OPLS-DA models after investigating correlations with correlation coefficients values higher than 0.4. Univariate statistical analysis (Mann-Whitney U test) was used to examine the SCFA data set. p values were adjusted for multiple testing using the pFDR method.
Confirmation of metabolite identities in the NMR data was obtained using 1D 1H NMR and 2D 1H-1H NMR and 1H-13C NMR experiments. In addition, statistical tools such as SubseT Optimization by Reference Matching (STORM) and Statistical TOtal Correlation SpectroscopY (STOCSY) were also applied.52 ,53 Confirmation of metabolites identities in the LC-MS data was obtained using tandem MS (MS/MS) on selected target ions.
Metabolite identification was characterised by a level of assignment (LoA) score that describes how the identification was made.54 The levels used were as follows: LoA 1: identified compound, confirmed by comparison to an authentic chemical reference. LoA 2: MS/MS precursor and product ions or 1D+2D NMR chemical shifts and multiplicity match to a reference database or literature to putatively annotate compound. LoA 3: chemical shift (δ) and multiplicity matches a reference database to tentatively assign the compound (for further details see online supplementary methods).
Acknowledgments
The authors express gratitude to all participants for the donation of time and samples, in particular staff and players at the Irish Rugby Football Union. Fiona Fouhy for insight provided into the library preparation of metagenomic sequencing. The authors thank the Imperial-National Institute for Health Research (NIHR) Clinical Phenome Centre for support.
References
Footnotes
Twitter Follow Orla O'Sullivan @OrlaOS
Contributors WB prepared DNA samples for metagenomic sequencing. OOS and WB processed and analysed the metagenomic data. EH, IGP and NCP performed metabolomic processing and statistical analysis thereof. FS, PDC, OOS and WB devised experimental design and approach. FS, PDC, OC, OOS, MGM, EH, NCP and WB wrote manuscript. Results discussed by all authors.
Funding This research was funded by Science Foundation Ireland in the form of a centre grant (APC Microbiome Institute Grant Number SFI/12/RC/2273). Research in the Cotter laboratory is funded by SFI through the PI award, ‘Obesibiotics’ (11/PI/1137). OOS and WB are funded by Science Foundation Ireland through a Starting Investigator Research Grant award (13/SIRG/2160). Nicholas Penney is funded by the Diabetes Research and Wellness Foundation through the Sutherland-Earl Clinical Research Fellowship 2015. The centre is supported by the NIHR Imperial Biomedical Research Centre based at Imperial College Healthcare National Health Service (NHS) Trust and Imperial College London.
Disclaimer The views expressed are those of the author(s) and not necessarily those of the NHS, the NIHR or the Department of Health.
Competing interests FS is a founder shareholder in Atlantia Food Clinical Trials, Tucana Health and Alimentary Health. He is director of the APC Microbiome Institute, a research centre funded in part by Science Foundation Ireland (APC/SFI/12/RC/2273) and which is/has recently been in receipt of research grants from Abbvie, Alimentary Health, Cremo, Danone, Janssen, Friesland Campina, General Mills, Kerry, MeadJohnson, Nutricia, 4D pharma and Second Genome, Sigmoid pharma.
Ethics approval Cork Clinical Research Ethics Committee.
Provenance and peer review Not commissioned; externally peer reviewed.
Data sharing statement In conformation of data accessibility protocol, metagenomic raw sequence data from this study are deposited in EMBL BNucleotide Sequence Database (ENA) (http://www.ebi.ac.uk/ena/data/), accession number PRJEB15388.